Federal Highway Administration Focus States Initiative: Traffic Incident Management Performance Measures Final Report
Traffic Incident Management Performance Measurement Presentation
PowerPoint Presentation (PPT 5.2MB)
To view PPT files, you need the
Microsoft PowerPoint Viewer.
Slide 1
Traffic Incident Management Performance Measurement
The Focus States Initiative: On the Road to Success

Slide Notes:
After introducing yourself, explain the purpose of this presentation,
which is to detail the results of the TIM Performance Measures Focus
States Initiative with a goal of determining how you (we) can capitalize
on the results and utilize them in your (our) state.
Slide 2
Traffic Incident Management
"The systematic, planned and coordinated used of human, institutional,
mechanical and technical resources to reduce the duration and impact
of incidents and improve the safety of motorists, crash victims and
incident responders."
Source: FHWA Traffic Incident Management (TIM) Handbook (2000).
Slide Notes:
Definition of Traffic Incident Management (TIM).
- As long as there have been traffic incidents, there has been traffic
incident management.
- The advent of freeways changed how we respond to incidents.
- Working in a high-speed, high-volume environment is much different
than working on an arterial roadway. Concern for both congestion
and safety of responders (and travelers, too) in freeway environments
has increased the level of coordination and cooperation required in
order for the various stakeholders to effectively conduct TIM.
Slide 3
Who are the TIM Stakeholders?
- Law Enforcement
- Fire and Rescue Emergency Medical Services
- Transportation Agencies
- Towing and Recovery
- Emergency Managers
- Hazardous Materials Responders
- Medical Examiners and/or Coroners
- Elected and Appointed Officials
- Traffic Media
- Highway Users
Slide Notes:
Who are TIM stakeholders?
- Public safety/first responders including police, fire, EMS
- State and local Departments of Transportation
- Towing and recovery
- Traffic media
- And of course, our customers, road users.
Slide 4
5 Benefits of Effective TIM
- Increased driver and responder safety
- Reduced secondary accidents, fatalities, injuries and property
damage
- Congestion relief
- More effective preparation for larger-scale emergencies/disasters
- Public resources go further/Happier public
- Reduced emissions
Slide Notes:
Why is traffic incident management (TIM) so important?
- .Effective TIM saves the lives of emergency responders who are often
killed or injured at incident scenes by passing vehicles:
- Over 43,000 Americans are killed in highway crashes each year.
That is the average spectator capacity of some of the largest
baseball stadiums in the nation.
- Traffic crashes claim the lives of more law enforcement personnel
than any other cause of death in the line of duty. "Struck-bys"
are the 2nd leading cause of accidental law enforcement officer
death and account for 20% of on-duty firefighter deaths per year.
- Effective TIM also reduces the occurrence of secondary crashes.
The likelihood of a secondary crash increases by 2.8% for each
minute the primary incident continues to be a hazard, increasing
the risk to driver and responder lives, and making it even more
difficult for responders to get to and from the scene.
- Faster detection of and response to highway incidents saves
lives. Response time has a well-documented relationship to the
likelihood of crash survival.
- Effective TIM relieves congestion on our nation's roadways:
- Traffic incidents account for approximately 25% of all congestion
on U.S. roadways.
- Every minute of blockage on a freeway travel lane increases
delay after the incident is cleared by a factor of four.
- Idling in traffic costs the U.S. trucking industry over $7.8
billion annually.
- Effective TIM for roadside incidents supports more effective response
to large-scale emergencies/disasters:
- TIM is scalable. The improved coordination between primary TIM
responder agencies (law enforcement, fire/EMS, transportation)
for routine, roadside TIM response activities translates to improved
coordination for larger incidents and emergencies, both man-made
and natural.
- Effective TIM also helps agencies gain efficiencies with existing
resources and increases public satisfaction with government services:
- Improved TIM means better (more efficient) resource management
(personnel, equipment, and transportation infrastructure) for
public sector agencies.
- When surveyed on top priorities for the Maryland Department
of Transportation, citizens overwhelmingly ranked clearing the
road after an incident as the top priority.
- Environmental benefits accrue when congestion is reduced and less
fuel is spent idling:
- Maryland's TIM program, CHART, saved Maryland motorists an estimated
6.4 million gallons of fuel in 2005.
Slide 5
Measuring Success
What Gets Measured Gets Performed...
- Builds critical mass for program support from managers and elected
officials
- Ensures buy-in from diverse stakeholders
- Multiple agencies, coordinated response
- Supports allocation of technical and budget resources
Slide Notes:
- We all intuitively understand that TIM is important. However, the
best way to show its value is to measure it.
- With so many competing interests for limited public resources, it
has become critical to quantify the benefits of TIM to ensure program
continuation.
- With the identification of appropriate performance metrics for TIM,
the various stakeholders all assume responsibility for improved performance
and accountability.
- Performance measurement also enables the assessment of coordinated,
multi-agency TIM to identify benefits and impacts.
Slide 6
TIM Performance Measurement Focus States Initiative
Eleven states working together to develop consensus on national program-level
TIM Performance Measures
TIM Performance Measures
Focus States:
- California
- Connecticut
- Florida
- Georgia
- Maryland
- New York
- North Carolina
- Texas
- Utah
- Washington
- Wisconsin
Representatives from Law Enforcement and Transportation
Slide Notes:
- The TIM Performance Measures Focus States Initiative identified
11 states considered leaders in TIM programs and in particular in
their efforts to track and analyze TIM performance measures. FHWA
convened law enforcement and transportation representatives from each
of these states in a series of workshops to develop consensus on program-level
TIM Performance Measures.
- Program-level measures are those that cross agencies rather than
focusing on the performance of just one responding agency. There are
two reasons for this multi-agency involvement in PM. First, both enforcement
and transportation agencies (as well as many other agencies) are involved
in TIM and collect their own data.
- These two agencies represent the starting point for multi-agency
TIM PM. Second, accurate performance measurement involves the fusion
of data from these multiple sources. For example, data about an incident
from first report to lane clearance to total clearance exists in at
least two databases - transportation and law enforcement. To accurately
measure performance, these databases will need to be integrated to
include all responder activities, not just those of one agency.
- The TIM FSI resulted in several accomplishments including valuable
peer exchange of innovative approaches to TIM PM, data exchange, and
systems integration, institutional models to promote multi-agency
information sharing. Perhaps the most significant accomplishment,
however, was the consensus-based development of shared definitions
for objectives and supporting performance measurement in three core
TIM areas central to the NUG and to State and local government priorities:
Reducing Roadway Clearance Time, Incident Clearance Time, and Secondary
Crashes.[1]
[1]These three core PMs directly support NUG Strategy #11: Response
and Clearance Time Goals. See: http://www.transportation.org/sites/ntimc/docs/NUG%20Unified%20Goal-Nov07.pdf.
Slide 7
TIM Performance Measurement Focus States Initiative
- Two performance measures initially identified for collection and
analysis
- "Roadway" Clearance Time
- "Incident" Clearance Time
- Third performance measure proposed by participating states
Focus State Testimonials:
"The [TIM FSI] process helped to crystallize what the measurements
are about. It became very clear we are all defining things in different
ways." New York FSI Participant
"There were a lot of definitional differences between public safety
and DOT. This was a major hurdle [we] overcame." Washington FSI
Participant
"Determining secondary crashes and the reduction of this through
TIM is important for funding for Road Rangers and the expansion of TIM."
Florida FSI Participant
Slide Notes:
- People regularly talk about reducing "clearance" time
- or may commonly refer to "incident" clearance time and
yet mean up to 3 different things by that language:
- The time it takes to clear the incident from the roadway and
restore all lanes to traffic flow;
- The time it takes for the last responder to leave the scene;
- The time it takes to clear all incident debris from the scene,
including the shoulder.
- The focus states realized that the first step towards real progress
in measuring TIM performance is having everyone use the SAME language
to mean the SAME THING. One of the significant accomplishments of
the initiative was to begin to use more precise language when discussing
TIM performance objectives and measures.
- Through a series of workshops the Focus States participants agreed
to pursue two program-level performance measures, "roadway"
clearance time and "incident" clearance time. A third measure,
reducing the number of secondary crashes, was also considered by the
participants at the final workshop held in October 2007.
- These are the three proposed national-level TIM program objectives
and the supporting performance measures the Focus States agreed to
implement in common.
- The majority of FSI participants are actively implementing or planning
to implement the "roadway" and/or "incident" clearance
time performance measures. It is significant that the Focus States
were able to agree on a shared definition of secondary crashes given
the many differing perspectives and variables impacting this area.
At the conclusion of the TIM FSI, participants had not yet begun actively
measuring this last consensus-based PM.
Slide 8
TIM Performance Measurement
"Roadway" Clearance Time
- The time between first recordable awareness of an incident (detection/notification/verification)
by a responsible agency and first confirmation that all lanes are
available for traffic flow.
Slide Notes:
- "Roadway" Clearance Time is defined as the time between
the first recordable awareness of an incident (detection, notification
or verification) by a responding agency and first confirmation that
all lanes are available for traffic flow.
Slide 9
TIM Performance Measurement
"Incident" Clearance Time
- The time between the first recordable awareness and the time at
which the last responder has left the scene.
Slide Notes:
- "Incident" Clearance Time is defined as the time between
the first recordable awareness of the incident and the time at which
the last responder has left the scene.
Slide 10
TIM Performance Measurement
Secondary Crashes
- The number of secondary crashes beginning with the time of detection
of the primary incident where a collision occurs either a) within
the incident scene or b) within the queue, including the opposite
direction, resulting from the original incident.
Slide Notes:
"Secondary Crashes" are defined as the number of crashes
beginning with the time of detection of the primary incident where the
collision occurs either a) within the incident scene or b) within the
queue, including the opposite direction, resulting from the original
incident.
Slide 11
Some Focus State Experiences - Benefits of Performance Measurement
Slide Notes:
- Let's see what the Focus States had to say about why they measure
program-level TIM.
Slide 12
The Maryland (CHART) Experience
- Response Time Reduction
- Clearance Time Reduction
- Delay Reduction
- Reduction In Incident Duration
- Fuel Consumption
- Emissions
- Secondary Incidents
- Risks At Primary Incident Sites
- Potential Incidents Due To Chart Ops.
 
Slide Notes:
- This slide, from FSI participant Maryland, highlights some of the
benefits of tracking TIM performance, including reduced incident response,
reduced clearance and duration times, reduced fuel consumption and
the resulting emissions benefits, reductions in secondary incidents,
and reduced risks at primary incident sites.
Slide 13
The Wisconsin Experience
- Establish a baseline
- Method to monitor and improve day-to-day operations
- Tool for prioritizing needs
- Ultimately use to support/justify programs

Slide Notes:
This slide, from FSI participant Wisconsin, identifies the Wisconsin
DOT's rationale for tracking TIM performance, allowing for a program
performance baseline to be established and progress to be tracked over
time. This provides a tool for prioritizing where program resources
will need to be expended to improve performance.
Slide 14
Monthly Performance Report
- Total Incidents
- Response Time
- Incident Clearance Times
- Travel Rate Index
- Hours of Delay
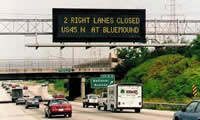
- VMS Usage Report
- Maintenance Average�Service Time
- Freeway Service & Safety�Patrol Assists
- HOV Ramp Lane Usage


Slide Notes:
- The Wisconsin program produces a monthly performance measures report
that includes a number of metrics, such as: total number of incidents,
response and incident clearance time, variable message sign usage
report for delivering traveler and incident information, number of
freeway service patrol assists, and HOV ramp lane usage.
Slide 15
Some Focus State Experiences - Data Collection and Evaluation
Slide Notes:
- Let's look at some of the results Focus States achieved and some
of their experiences with program-level data collection and evaluation.
Slide 16
Wisconsin: Average Incident Clearance Time
Definition:
- Time between State Transportation Operations Center awareness of
an incident and the time all vehicles/debris/etc. are clear of the
incident scene (including shoulder/median)
Data Source:
- Start time
- CAD data sent from Milwaukee County Sheriff’s Office
- Operator entered: observes or is notified of an incident
- End time
- Operator entered: observes or is notified incident scene is
clear
Computation:
- Automated using Incident Management System database
Issues/Limitations:
- Based on Operator entered data, not always highest priority
Future Enhancements:
- Direct link to the Wisconsin State Patrol CAD data
Slide Notes:
- Wisconsin defines "Incident" Clearance Time as the time
between awareness of the incident by its Statewide Transportation
Operations Center (STOC) in Milwaukee and the time that all involved
vehicles and debris are removed from the incident scene, including
the shoulder or median.
- The start-and end-time data are entered into the state's Incident
Management System (IMS) database by a STOC operator. The start time
data is either CAD data sent from the Milwaukee Sheriff’s Office
or incident data observed by the operator on the STOC cameras.
- Similarly, the end-time data is entered based on operator observation.
Slide 17
Wisconsin: Average Incident Clearance Time
Slide Notes:
- This slide depicts average incident clearance time for the Wisconsin
program throughout 2006 and part of 2007.
Slide 18
Florida: Incident Duration
- Objective: To obtain the incident timeline from the time any Florida
DOT (FDOT) or Florida Highway Patrol (FHP) staff is notified to the
time that all travel lanes are cleared
- "Incident Influence Time"? Entire length of the timeline
(from occurrence to return to normal flow)
- [Roadway] Clearance Time
- Begins with the arrival of the first responder, either FHP or
FDOT, and ends when all mainline travel lanes are cleared
- Directly comparable with the Open Roads Policy of clearing all
travel lanes in 90 minutes or less
Slide Notes:
- This slide, from the Florida program, details how the Florida DOT
measures incident duration.
- Florida has been using what the focus states labeled "Roadway"
Clearance Time to help measure incident duration. Previously, Florida
referred to this as simply "clearance" time.
Slide 19
Florida: Incident Duration Data Collection
- Pilot Effort in 2005 to collect incident timeline data from manual�
(paper) records
- Results determined that collecting incident timeline data was too
complex and time-consuming to be done manually
- In 2006 the SunGuide statewide Traffic Management Center (TMC) software
was modified to include the data collection and reporting requirements
for obtaining incident duration data
- 2 districts are currently able to collect data.
- In late 2007 or early 2008 it is anticipated that several other
Districts will also be able collect and report incident duration
data
Slide Notes:
- Also from the Florida program, this slide details some of the evolution
of the TIM PM data collection, starting with manual entry of the timeline
data from paper records, which proved to be too time-consuming.
- The Florida solution was to modify the statewide Transportation
Management Center (TMC) software to include data collection and reporting
for incident duration.
Slide 20
Florida: Data Collection Recommendations
- Manual data collection not recommended
- Too expensive, not enough data
- Develop automated data collection of ALL incident timeline components
through SunGuide software in all Districts
- Collect data and establish targets for all components of timeline
(i.e. 90 minute clearance time) in 2007
Slide 21
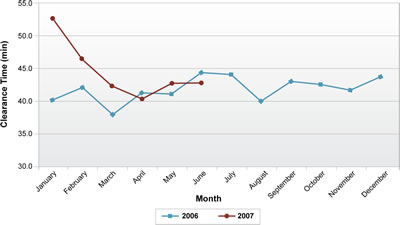
Florida: 2007 Incident Duration Results
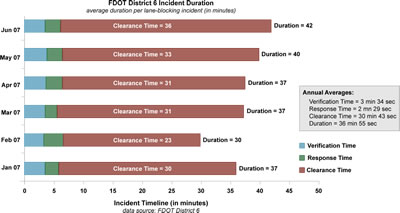
Slide Notes:
- This is a good example of the power of TIM performance tracking.
- These results, from Florida DOT District 6, show incident duration
times for the first six months of 2007, where clearance times have
started to increase slightly. While knowing more about the types of
incidents may explain the increase in average clearance time, this
data provides all incident responders with important feedback on performance.
- Again, knowing how the performance is trending allows for identification
of issues to be resolved and successes (such as reductions in response
time) to be acknowledged.
Slide 22
Maryland (CHART) Evaluation Findings
- Reduction in Incident Duration ("Roadway" Clearance Time)
for Each Incident Evaluation Period
- < ½ Hour (13% Reduction)
- > ½ & < 1 Hour (13% Reduction)
- > 1 Hour & < 2 Hours (41% Reduction)
- > 2 Hours (35% Reduction)
Slide Notes:
- This, from Maryland, demonstrates again the value of tracking performance - here demonstrating significant percentage reductions in incident
clearance time.
- Note here that some agencies still use their own language internally
("incident duration") but can link to parallel national
performance measure ("Roadway" Clearance Time).
Slide 23
Some Focus State Experiences - Challenges and Lessons Learned
Slide Notes:
- The next several slides are from TIM PM FSI participants and illustrate
lessons learned and challenges identified through their participation
in the Focus States Initiative.
- The first one, from Florida, points to the importance of automated
data collection.
Slide 24
Florida - Challenges
- Creating and maintaining a data archive that stores all the needed
data (output and outcome)
- Developing TMC management software that collects the needed data
for the incident duration timeline (all components need to be collected
and stored) ? manual data collection is far too time consuming
- Training TMC operators to properly collect the needed incident data
- they must understand the importance
- Training service patrol operators to collect or at least cooperate
with the TMC operators collecting incident data
- Integrating disparate systems to enable data exchange
- Inconsistencies in data availability
Slide Notes:
- Florida challenges included software development/modification to
automate data collection, the need to train service patrol operators
to assist in the data collection, and, like Wisconsin, challenges
with data quality and data availability.
- Other important lessons learned by the Florida participants include
the need to focus on one or two key performance measures rather than
trying to capture too many divergent measures.
Slide 25
Florida - Lessons Learned
- PMs need to reflect multi-agency nature of incident management
- Need for output and outcome measures
- Limit reporting to a critical few
- Track data before setting targets
Slide 26
Wisconsin - Challenges
- Data quality
- Constant technology changes/advances
- Initial lack of standard measures
- Making the results meaningful to multiple audiences
Slide Notes:
- Among the challenges identified by TIM PM FSI participants are these
from Wisconsin, which include data quality, an initial lack of standard
measures (impacting how operators entered the data) and making the
results meaningful to multiple stakeholders.
Slide 27
CHART TIM Evaluation Lessons Learned
- Need Consistency In Logging "All Lanes Open" and "Incident
Closed" as Separate Events
- Need to Provide Select Responding Agencies with Chart Workstation
Access to Log "First Recordable Awareness" Data
- Evaluation Constrained Due to Lack of Data From CHART Roads
- Need Ongoing/Active Participation Among TIM Stakeholders In Jurisdictions
Slide Notes:
- From the Maryland experience, we learn consistent data definitions
and data entry are important. Also important is the inclusion of and
ongoing participation by the various TIM stakeholders.
Slide 28
Getting Started
Slide Notes:
- Obviously there is some great experience among the TIM PM FSI participants
and we can and should benefit from their experience. Let's look at
what it takes to initiate program-level TIM performance measurement
in your (our) state or region.
Slide 29
What Is Needed to Get Started?
- High-level support within your organization for tracking and evaluating
TIM performance measures
- Shared commitment among your TIM partners
- Common language around the performance measures for clarity
- And maybe:
- System modifications to capture and exchange data between agencies
- Develop common data elements
- Real-time exchange of information
- Changes in operational practices to improve TIM
- Investment of additional resources in terms of people and/or
equipment
Slide Notes:
- The focus states initiative resulted in several significant lessons
that can make it easier for other states to get started with program-level
TIM performance measurement.
- One big thing that we learned, not surprisingly, is that tracking
TIM performance measures will require high-level support and buy-in
from leadership within participating agencies.
- This is because doing any sort of performance measurement in
general requires some investment of time, and this may require
a shift in priorities and/or additional resources (people and/or
equipment) to accommodate this initially. Note, however, that
over time, states that are regularly performing program-level
TIM performance measurement have reported success in winning additional
resources to support TIM because they are demonstrating the value
of TIM as well as accountability and commitment to results among
the agencies.
- Performance measurement may also require system/software modifications
as well as interagency agreements to collect and track data and
changes in operational practices.
- The final bullet is called an "investment" because it is not a sunk
cost - it is indeed an investment that pays off in the long run.
Slide 30
Resources Available: TIM Performance Measurement Knowledge Management
System
- Subscribe to the TIM PM managed email list to access the experiences
and expertise of the focus states and others across the country measuring
TIM performance:
- Ask specific questions, get helpful answers from people with
experience
- Suggest/share helpful resources
- Send an email to TIMPM@dot.gov
to subscribe!
- Bookmark the TIM PM Knowledgebase at www.ops.fhwa.dot.gov/eto_tim_pse/preparedness/tim/knowledgebase/index.htm to
access documented knowledge:
- TIM Performance Measurement Fact Sheet and Presentation
- TIM Performance Measurement Focus State Workshop Reports
- Helpful Materials/Resources from States doing performance measurement
- Example Memorandum of Agreements
- Example requirements documents or reports
- Example systems specifications for data sharing
- Contact List of TIM PM Focus States Participants
- FHWA TIM Self-Assessment and other resources
Slide Notes:
- The good news is, a number of resources are already available to
assist in getting started with TIM performance measures.
- At the request of the 11 participating Focus States, FHWA has developed
a knowledge management system to allow the Focus States and others
interested in TIM performance measurement to continue to share information,
experiences, and resources, such as data exchange standards and architectures,
with each other.
- This system comprises a managed email list (like a LISTSERV) to
allow folks to tap into the collective knowledge across the country
with TIM performance measurement as well as an online Knowledgebase
for convenient sharing of documents and other downloadable products.
- A one-page fact sheet on the TIM Performance Measures Focus States
Initiative gives a high-level overview of the program and its benefits
that can be used with key decisionmakers in your organizations.
- The workshop reports give more detailed information on how the Focus
States got started in their data collection and analysis and the lessons
they learned.
- A contact list of TIM PM Focus States participants is available
so that you can contact them directly for more information. FHWA's
annual TIM Self-Assessment is another useful tool for identifying
TIM performance measures and tracking those measures on a yearly basis.
Slide 31
Questions?
- Contact the FHWA TIM Program Manager:
Back to Appendix A
|