Planned Special Events: Cost Management and Cost Recovery Primer
Chapter 3: Tracking Planned Special Event Costs
The purpose of this chapter is to provide guidance to departments or jurisdictions in tracking costs for planned special events. As discussed in Chapter 2, cost tracking is critical to the process of cost management, as all subsequent decisions will be based on information gathered during this phase. Unless a department or jurisdiction has an accurate estimate of the costs incurred for each type of activity for special events, they will be unable to forecast future expenditures and also will be unable to critically examine the benefits and costs of hosting events.
Developing Event and Activity Codes
Managing Travel for Planned Special Events communicates new and proven institutional and high-level operational techniques and strategies for achieving a coordinated, proactive approach to managing travel for all planned special events in a region, in addition to facilitating successful and cost-effective management of specific planned special events. |
Cost tracking involves both event and activity codes. The first step is to develop a code for each event, so that the hours and equipment costs can be associated with a specific event. This can be done when a permit is requested. A set of codes should then be developed for each activity. Each cost that is incurred is assigned both an event and an activity code.
The assignment of activity codes is somewhat more complex, as it is important to accurately capture the costs associated with each activity for the large number of potential activities. This level of detail will allow for the planning, forecasting and management of individual costs. The process of developing activity codes starts with determining the activities that need to be performed throughout the entire process, from planning all the way to the post-event review. Two references, the handbook Managing Travel for Planned Special Events,1 and Planned Special Events: Checklists for Practitioners,2 are useful resources, as they provide listings of all the travel-related activities of staging a planned special event.
Planned Special Events: Checklists for Practitioners consists of six checklists on event-specific planning for planned special event travel management. It provides common, sequential steps for plans and activities that practitioners may use for most significant planned special events, regardless of the event or area type. |
It is important to determine activities in advance to provide a road map to be used throughout each event. The activities list can remain flexible, but it should be understood that changes that are made will affect the ability to track changes in the number of units used per event and their costs across events and from year to year. Once the activities are determined, a distinct cost code can be assigned to each of the activities. This cost code allows tracking of the specific tasks undertaken and costs incurred as part of each planned special event. A sample breakdown of planned special event activities is provided in Exhibit 3.1. The task list presented is representative and can be amended to meet a locality's (or event's) specific needs. The activities undertaken by each jurisdiction differ, and this task list can be modified according to the needs of each. The key to efficient cost-tracking is the preparation of this list as a first step, rather than as events progress.
In order to facilitate the tracking of costs in an efficient and accurate manner, the planning team should coordinate the development and assignment of cost codes with financial staff. The use of these codes by those involved in the planned special event will allow for the capture and consequent tracking of all costs associated with the various activities of the planned special event. Departments may develop their own cost codes and financial accounting system if there is no existing system, as long as all costs are summed when estimating city-wide expenses. It should also be clear whether each department's expenses include overhead and staff time involved in handling applications and planning, as these activities may be dealt with differently across departments. Discussion between members of the planning team, from State and local transportation officials to law enforcement, may assist with tracking costs consistently across departments and jurisdictions. Such information-sharing may also benefit those departments that are unsure how to implement cost-tracking. Financial staff should be involved in the process to ensure that costs are collected in accordance with overall financial system protocols governing direct costs and overhead items.
|
Exhibit 3.1 Task List Activities by Category Pre-Planning
Planning
Traffic Management
Traveler Information
Implementation
Day-of-Event
Post Event
|
Collecting Direct and Indirect Costs
Financial systems generally classify costs into direct and indirect costs. Direct costs can be specifically identified and assigned to a particular cost objective, which in this case is a specific special event. Indirect costs are incurred for common purposes and either cannot be assigned to a specific cost objective or can be assigned only at an effort disproportionate to the results achieved.
The distinction between direct and indirect costs is important, as a department need only assign event and activity codes to direct costs. Indirect costs will be pooled in the financial accounting system and there may be multiple indirect cost pools, each of which will be distributed according to a different formula.
Direct costs for planned special events will generally consist of direct labor, equipment, materials and purchased services. The collection of costs for each of these components is described in the following subsections.
Direct Labor Costs
Direct labor costs for each individual are found by multiplying the hours charged to an event by the individual's labor rate. The sum of this calculation across all workers charging hours to a particular event provides total direct labor costs.
Typically, workers fill out a timesheet in which they charge their hours to distinct projects or activities. Hours may be differentiated between regular and overtime hours, with the latter reflecting a higher rate.
Exhibit 3.2 Example of a DOT Timecard Entry Data Sheet
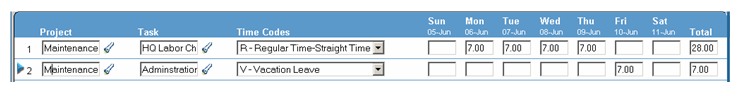
An example of an employee timesheet data entry form from the Rhode Island Financial Management System Timecard Entry User Manual is provided in Exhibit 3.2. Note that employees assign hours to both projects (events) and tasks (activities).
Equipment Costs
Managing special events will often require the use of equipment such as trucks and other vehicles, barricades, signs, variable message signs, flashing arrow sign units, and temporary lights. Since equipment typically has a lifetime of many years and is used for multiple events or purposes, only a portion of the costs of these items is assigned to a particular event. Typically, the costs of an individual item are depreciated (see text box) to derive an annual cost. This annual cost is then converted to a per-day, per-hour, or per-week charge based on average annual usage for that type of equipment. The individual event will pay for the piece of equipment based on the per-unit rate and the amount of usage.
|
Exhibit 3.3 The Concept of Depreciation "The established accounting technique of 'depreciation' can be used to convert capital outlays into annual costs. Depreciation is a method of allocating the costs of capital outlays over the useful life of the resource acquired. A simple 'straight-line' method of depreciation may be used to calculate costs of depreciation by dividing the acquisition cost of the resource by the number of years for which the resource is expected to provide services. For example, a collection truck that costs $150,000 and has a useful life of 10 years would have an annual depreciation cost of one-tenth of its total capital cost, or $15,000. Examples of costs that local governments should depreciate include the costs of equipment, vehicles, and structures owned by the local government... Local governments should recognize annually the cost of depreciation for all such assets until they are fully depreciated. No depreciation expense, however, should be recorded for assets that have remained in service after their estimated useful life has ended." Source: Florida Department of Environmental Protection, "Municipal Solid Waste Management Full Cost Accounting Workbook for Local Governments in Florida," Prepared by: Tetra Tech EM Inc, Vienna, VA, June 30, 1997. |
An example of an equipment price list—the short-term lease rates from the South Carolina State Fleet Management Motor Pool—is provided in Exhibit 3.4. Note that there is both a fixed (daily) and variable (per-mile) charge for each vehicle type.
| Vehicle Type | Daily | + Per Mile |
|---|---|---|
| Full-size Sedan | $20 | .17 |
| Intermediate Sedan | $17 | .16 |
| Compact Sedan | $14 | .15 |
| Intermediate Station Wagon | $17 | .16 |
| Compact Station Wagon | $17 | .15 |
| Full-size Van | $18 | .21 |
| Mini-Van | $13 | .17 |
| Source: http://www.ogs.state.sc.us/statefleet/SFM-lease-rates.phtm | ||
Materials and Purchased Services
Special events may require purchases of materials or services. For example, a particular special event may require extra security that is contracted to an outside vendor, such as a security firm. Since these purchases are made exclusively for a particular special event, they may be charged directly to that event. If an item is to be used for more than one event, it can be allocated to the events individually as long as it is allocated in a reasonable manner.
Indirect Costs
Once the direct costs of managing special events have been tabulated, these costs are augmented by indirect or overhead costs. Indirect costs are incurred for common purposes and either cannot be assigned to a specific cost objective or can be assigned, but only at an effort disproportionate to the results achieved. An example of an indirect cost is leave and fringe benefits for employees. These benefits include sick leave, annual leave, holiday leave, insurance, retirement, employer social security payments, etc.
An example of a labor-loading analysis for the Nevada Department of Transportation is provided in Exhibit 3.4. In the exhibit, totals are developed for direct labor costs as well as costs for leave and fringe benefits. The total cost for leave and fringe benefits is then divided by total direct labor costs to develop a ratio of 62.46 percent as shown at the bottom of the exhibit. Direct labor rates for individual personnel can be multiplied by this rate to estimate indirect costs.
Other types of indirect costs can be developed and divided by some measure of direct costs for allocation purposes. For example, costs for overhead items such as offices or data processing can be added together and allocated based on number of employees, hours, labor costs or total direct costs.
Assigning Costs to Activities
Assigning direct and indirect costs to each event allows a department or jurisdiction to understand how the cost of managing these events affects their budgets. It provides data which affords the ability to weight costs against the benefits of the events to the community. However, to be able to manage and forecast costs, the collection of data by both event and activity is imperative. A list of potential activities is provided in Exhibit 3.1. These activities are divided into eight categories, including:
- Pre-Planning
- Planning
- Feasibility
- Traffic Management
- Traveler Information
- Implementation
- Day-of-Event
- Post Event
Note that the level of activity detail to be collected will depend upon the needs of the particular department or jurisdiction, sophistication of its financial management system, and the complexity of its events. Some may choose to collect data only at the level similar to the eight categories listed above, while others may collect data at a more detailed level, such as the 31 activities listed in Exhibit 3.1. The following subsections describe one of the activities from each of the eight categories. The purpose is to illustrate what these activities are comprised of and how direct costs can be assigned to them.
| Object and Description | Actual Costs | Fringe % | Loading |
|---|---|---|---|
| Direct Labor | |||
| 5100 Salaries | $ 59,336,737 | ||
| 5810 Overtime Pay (Non Holiday) | $ 3,514,266 | ||
| 5880 Shift Differential | $ 53,903 | ||
| 5901 Payroll Adjustments | $ (2,780) | ||
| 5910 Standby Pay | $ 25,056 | ||
| 5940 Dangerous Duty | $ 3,458 | ||
| 5980 Call Back | $ 204,418 | ||
| Total Direct Labor | $ 63,135,057 | ||
| Leave Employer Costs | |||
| 5610 Sick Leave | $ 3,459,132 | $ 3,459,132 | |
| 5620 Annual Leave | $ 4,686,250 | 4,686,250 | |
| 5630 Holiday Leave | $ 3,077,648 | 3,077,648 | |
| 5640 Compensatory Leave | $ 1,057,848 | 1,057,848 | |
| 5650 Other Leave | $ 225,065 | 225,065 | |
| 5820 Holiday Pay – OT | $ 175,015 | 175,015 | |
| 5830 Compensatory Leave Payoff | $ 286,883 | 286,883 | |
| 5930 Longevity Pay | $ 726,201 | 726,201 | |
| 5960 Terminal Sick Leave | $ 389,073 | 389,073 | |
| 5970 Terminal Annual Leave | $ 380,085 | 380,085 | |
| 5975 YE Leave Payoff | $ 36,483 | 36,483 | |
| Total Leave Costs | $ 14,499,683 | $ 14,499,683 | |
| Total Labor (Direct and Leave) | $ 77,634,740 | ||
| Fringe Costs | |||
| 5200 Industrial Insurance | $ 3,444,271 | 4.44 | $ 643,279 |
| 5300 Retirement | $ 11,217,954 | 14.45 | 2,095,155 |
| 5400 Personnel Assessment | $ 760,749 | 0.00% | - |
| 5500 Group Insurance | $ 9,244,652 | 11.91 | 1,726,605 |
| 5700 Payroll Assessment | $ 272,606 | 0.00% | - |
| 5800 Retired Employee Insurance | $ 1,339,737 | 0.00% | - |
| 5800 Unemployment | $ 141,612 | 0.18% | 26,449 |
| 5840 Medicare | $ 790,775 | 1.02% | 147,691 |
| 5841 Social Security | $ 96,520 | 0.12% | 18,027 |
| 7170 Clothing/Tool Allowance | $ 58,850 | 0.00 | |
| Total Fringe Costs | $ 27,367,727 | $ 4,657,206 | |
| Total Leave, Fringe and Labor | $ 105,002,467 | $ 19,156,889 | |
| Labor Loading Factor (Total Labor Load/Direct Labor) | n/a | n/a | 30.34% |
| Labor Load for Fringe - Leave/Direct | |||
| Total Direct Labor | $ 63,135,057 | ||
| Total Leave Cost | $ 14,499,683 | ||
| Total Fringe Cost | $ 27,367,727 | ||
| Total Ineligible Fringe Cost | $ (2,431,942) | ||
| Total Leave and Eligible Fringe Cost | $ 39,435,467 | ||
| Total Fringe and Leave Cost/Direct Cost | 62.46% |
Pre-planning
The first step in tracking costs for planned special events is to determine the activities that need to be performed throughout the process (activity #1 from Exhibit 3.1). Since in our hypothetical community the DOT Traffic Engineering Division is the lead agency for planned special events, Senior Level staff in Traffic Engineering determined the appropriate activities and assigned a distinct cost code to each of the activities. Their selections were then reviewed by staff at other departments involved with planned special events. During this process, each of the individuals involved in this activity assigned the hours on their biweekly time sheet to the appropriate cost code for activity #1. The hours were then tabulated, and the hypothetical staff time breakdown for this activity is shown in Exhibit 3.6. In total, this activity required 50 hours at a direct cost of $2,036.00. Since this is the first event for which our hypothetical community has used these activity cost codes, the cost of this activity will be lower for subsequent events and years, as this list will only require minor revisions. Having cost data for this individual activity will aid in developing future budgets.
| Department | Level | Hours | Rate | Total |
|---|---|---|---|---|
| DOT Traffic Engineering (TE) | Senior Staff | 6 | $55.00 | $330.00 |
| DOT Traffic Engineering (TE) | Mid-Level Staff | 8 | $38.00 | $304.00 |
| DOT Planning Department | Senior Staff | 2 | $55.00 | $110.00 |
| DOT Planning Department | Mid-Level Staff | 4 | $38.00 | $152.00 |
| Police | Senior Staff | 2 | $57.00 | $114.00 |
| Police | Mid-Level Staff | 4 | $28.00 | $112.00 |
| Office of Emergency Management (OEM) | Senior Staff | 2 | $56.00 | $112.00 |
| Office of Emergency Management (OEM) | Mid-Level Staff | 4 | $39.00 | $156.00 |
| Incident Command Center (ICM) | Senior Staff | 2 | $52.00 | $104.00 |
| Incident Command Center (ICM) | Mid-Level Staff | 4 | $29.00 | $116.00 |
| Traffic Control Center (TCC) | Senior Staff | 2 | $50.00 | $100.00 |
| Traffic Control Center (TCC) | Mid-Level Staff | 4 | $24.00 | $96.00 |
| Transit | Senior Staff | 2 | $59.00 | $118.00 |
| Transit | Mid-Level Staff | 4 | $28.00 | $112.00 |
| TOTAL | $2,036.00 |
Planning
The Planning category is the development of contingency plans. The planning category develops scenarios in the event that day-of-event modifications to the traffic management plan are needed. These are packaged into a plan that provides a selection of options for a range of potential unexpected occurrences or events.
Task #4, Assess Construction Activities and Effects, was chosen for illustrative purposes. This task requires meetings that include members of the DOT Construction Department, as well as the Design Department, to determine any road construction projects that are currently underway or are in the planning phases and are scheduled to be in place on the day of the event. A typical scenario would be to reschedule planned roadway construction and maintenance projects to accommodate known events. The breakdown of staff time for this activity is shown in Exhibit 3.7.
| Department | Level | Hours | Rate | Total |
|---|---|---|---|---|
| DOT Traffic Engineering (TE) | Senior Staff | 3 | $55.00 | $165.00 |
| DOT Traffic Engineering (TE) | Mid-Level Staff | 14 | $38.00 | $532.00 |
| DOT Planning Department | Senior Staff | 4 | $55.00 | $220.00 |
| DOT Planning Department | Mid-Level Staff | 14 | $38.00 | $532.00 |
| DOT Construction Management Division | Senior Staff | 5 | $58.00 | $290.00 |
| DOT Construction Management Division | Mid-Level Staff | 18 | $39.00 | $702.00 |
| DOT Design Division | Senior Staff | 4 | $59.00 | $236.00 |
| DOT Design Division | Mid-Level Staff | 12 | $40.00 | $480.00 |
| Traffic Control Center (TCC) | Senior Staff | 2 | $50.00 | $100.00 |
| Traffic Control Center (TCC) | Mid-Level Staff | 8 | $24.00 | $192.00 |
| Transit | Senior Staff | 1 | $59.00 | $59.00 |
| Transit | Mid-Level Staff | 4 | $28.00 | $112.00 |
| TOTAL | $3,620.00 |
Feasibility
The feasibility category enumerates steps and associated considerations for gauging the effect that one or more proposed special events may have on surface transportation operations in the vicinity of the venue and the region as a whole. The project team develops a feasibility study to determine if a planned special event will cause travel problems, where and when identified problems will occur, and the magnitude of each identified problem.
Activity #10, Traffic Assignment and Capacity Analysis, was chosen to illustrate the feasibility category. In this activity, staff members from the DOT's Traffic Engineering and Planning Departments begin the process of assigning all event traffic to the roadway network and performing capacity analysis to determine roadway deficiencies. This is a labor-intensive task involving an analysis of all of the data that was gathered in earlier activities as part of the planning phase.
A first step in this process might be to estimate event attendance. The second step would be to determine the percentage of event patrons who will use modes of travel other than the automobile and then to determine average automobile vehicle occupancies. This allows the number of vehicles arriving at the event to be calculated. A third step determines event patron origins and their arrival and departures rates. For example, for events that have a definite start and end time, most patrons will generally arrive within one hour of the beginning of the event and depart within a half hour of the end of the event. These three steps will provide estimates of automobile volumes by time.
Estimated volumes are then factored into the roadway network, and a capacity analysis is performed to determine whether there are any deficiencies in the roadway network. The breakdown of staff time for this portion of the project, tabulated from employee time sheets, is shown in Exhibit 3.8. Once the deficiencies are determined, roadway plans can be implemented to reduce congestion, manage travel demand, and insure safety.
| Department | Level | Hours | Rate | Total |
|---|---|---|---|---|
| DOT Traffic Engineering (TE) | Senior Staff | 5 | $55.00 | $275.00 |
| DOT Traffic Engineering (TE) | Mid-Level Staff | 52 | $38.00 | $1,976.00 |
| DOT Planning Department | Senior Staff | 2 | $55.00 | $110.00 |
| DOT Planning Department | Mid-Level Staff | 39 | $38.00 | $1,482.00 |
| TOTAL | $3,843.00 |
Traffic Management
The traffic management category includes activities that analyze traffic, parking, and pedestrian management techniques to mitigate any and all anticipated problems on the day of the event. Operations strategies and resource applications are developed to mitigate potential congestion, but all operations tactics need to be examined in depth to ensure that one particular strategy does not defeat the objectives of another. A successful traffic management plan: (1) satisfies the customer requirements of all transportation system users, and (2) meets the allotted budget for personnel and equipment resources assigned to the day-of-event operation.
Activity #13, Determine Pedestrian Routing, was chosen to illustrate the traffic Management Category. Traffic Engineering and Planning staff will have to consider all types of parking, including on-site, off-site, disabled, reserved, participant, valet, media, employee, bus, recreational vehicle, taxi and limousine, and emergency vehicle staging. After the parking types are determined, each type is assigned to the appropriate lot and then the internal parking lot layouts evaluated.
If the majority of patrons will arrive within an hour of the event, circulation of pedestrians and automobiles is critical. Vehicles will be arriving while pedestrians are walking from their cars, homes and public transit. The major design criterion is to minimize contact between pedestrian routing and vehicles entering the parking lots. This effort maximizes safety and efficiency. In addition to the internal parking lot layout, the design of the access drives to the lots needs to be analyzed and the appropriate traffic control, including police presence, should be determined. The breakdown of staff time for this portion of the project can be seen in Exhibit 3.9.
| Department | Level | Hours | Rate | Total |
|---|---|---|---|---|
| DOT Traffic Engineering (TE) | Senior Staff | 6 | $55.00 | $330.00 |
| DOT Traffic Engineering (TE) | Mid-Level Staff | 42 | $38.00 | $1,596.00 |
| DOT Planning Department | Senior Staff | 4 | $55.00 | $220.00 |
| DOT Planning Department | Mid-Level Staff | 39 | $38.00 | $1,482.00 |
| Police | Senior Staff | 2 | $57.00 | $114.00 |
| Police | Mid-Level Staff | 15 | $28.00 | $420.00 |
| Transit | Senior Staff | 3 | $59.00 | $177.00 |
| Transit | Mid-Level Staff | 26 | $28.00 | $728.00 |
| TOTAL | $5,067.00 |
Implementation
The implementation portion of managing travel for planned special events includes testing and training activities, as well as the development and deployment of a traffic management plan. Implementation activities are a transitional phase between planning and operations. These activities improve the efficiency of traffic management plan deployment and increase traffic management team preparedness. The implementation phase of the project uses the data and analysis from all of the other phases to determine what will be needed to ensure safe and efficient traffic and pedestrian flow throughout the event, including any contingency plans.
Activity #21, Determine Quantity of Equipment, was chosen to illustrate the traffic Implementation Category. The traffic management plans are followed to determine the type and quantity of equipment necessary for the event. The implementation portion of the project deals only with the equipment itself and not design and layout, which are determined in previous activities. This allows the focus to be on equipment availability and cost. The costs for equipment used during the event are presented in Exhibit 3.10. "Linear feet" is abbreviated as "LF" and "square feet" as "SF." It is assumed that existing equipment will be used and that new equipment will not need to be purchased. Each piece of equipment has a purchase value as well as a depreciation value. The DOT can establish a cost-per-unit per day that takes into consideration the purchase price and the expected lifespan of the equipment. Cost can be determined in this manner for each piece of equipment used for planned special events. This is a usage cost, rather than the cost of the good itself. These values need to be determined prior to tracking costs for the planned special event and need to be updated periodically to account for changes in value.
| Code | Equipment | Quantity | Unit | Cost Per Unit | Total Cost |
|---|---|---|---|---|---|
| 1A | Traffic Cones | 2500 | Each | $0.25 | 625.00 |
| 1B | Traffic Guides | 200 | Each | $0.28 | 56.00 |
| 1C | Drums | 2000 | Each | $0.35 | 700.00 |
| 1D | Type III Barricades | 600 | Each | $1.15 | 690.00 |
| 2 | Pavement Markings | 2500 | LF | $1.90 | 4,750.00 |
| 3 | Signs | 6000 | SF | $7.00 | 42,000.00 |
| 3A | Sign Stands | 150 | Each | $2.25 | 337.50 |
| 3B | Portable Signs | 85 | Each | $2.30 | 195.50 |
| 3C | Sign Bagging | 600 | Each | $12.00 | 7,200.00 |
| 3D | Variable Message Signs | 15 | Each | $12.00 | 180.00 |
| 3E | Flashing Arrow Sign Unit (FASU) | 12 | Each | $9.00 | 108.00 |
| 4 | Concrete Barrier | 2500 | LF | $2.50 | 6,250.00 |
| 4A | Water Filled Barrier | 1500 | Each | $1.25 | 1,875.00 |
| 5 | Temporary Lights | 400 | Each | $1.75 | 700.00 |
| TOTAL | 65,667.00 |
Day-of-Event
The day-of-event activities facilitate the actual operation of the traffic management plan, as well as monitoring of real-time conditions before, during, and after the event. These activities support real-time traffic management and control decisions during the day of event and provide key performance evaluation data for future planning.
Activity #26, Data Collection and Surveillance during Event Operations, was chosen to illustrate the Day-of-Event Category. It includes data collection, surveillance and performance measurement during the event operations. The types of data to be collected, along with the surveillance methods, are determined in earlier activities, so this activity involves only actual collection and surveillance. The data should be collected in a consistent manner and may be used for future events at the same site or for an event of a similar type. The possible methods used to collect data include:
- Road sensors for measuring traffic flow
- Vehicle probes for collecting data on travel times, trip origins, and trip destinations
- CCTV systems for viewing real-time traffic information
- Traffic signal system detectors to measure congestion
- Manual turning movement traffic counts
- Parking occupancy counts
The data collected is also used to determine when and if additional parking lots should be opened due to overflow conditions. The volume necessary for the overflow condition, as well as the method used to direct people to the overflow lots, should have already been determined as part of the Traffic Management category of activities. This includes the placement and bagging of signs along the routes in case additional lots are necessary. The staff time and equipment costs for this task can be seen in Exhibit 3.11.
| Department | Level | Hours/Quant. | Rate | Total |
|---|---|---|---|---|
| DOT Traffic Engineering (TE) | Senior Staff | 3 | $55.00 | $165.00 |
| DOT Traffic Engineering (TE) | Mid-Level Staff | 24 | $38.00 | $912.00 |
| DOT Planning Department | Senior Staff | 2 | $55.00 | $110.00 |
| DOT Planning Department | Mid-Level Staff | 18 | $38.00 | $684.00 |
| Police | Senior Staff | 6 | $57.00 | $342.00 |
| Police | Mid-Level Staff | 12 | $28.00 | $336.00 |
| Incident Command Center (ICM) | Senior Staff | 6 | $52.00 | $312.00 |
| Incident Command Center (ICM) | Mid-Level Staff | 11 | $29.00 | $319.00 |
| Traffic Control Center (TCC) | Senior Staff | 3 | $50.00 | $150.00 |
| Traffic Control Center (TCC) | Mid-Level Staff | 8 | $24.00 | $192.00 |
| Transit | Senior Staff | 6 | $59.00 | $354.00 |
| Transit | Mid-Level Staff | 12 | $28.00 | $336.00 |
| Equipment | Road sensors | 15 | $250.00 | $3,750.00 |
| Equipment | Vehicle probes | 10 | $175.00 | $1,750.00 |
| Equipment | CCTV systems | 8 | $285.00 | $2,280.00 |
| Equipment | Traffic signal system detectors | 12 | $180.00 | $2,160.00 |
| TOTAL | $14,152.00 |
Post-Event
The Post-Event category includes the evaluation of local and regional operations based on debriefings and an analysis of traffic data collected on the day of event. The outcome of each and every activity represents the first step in planning for future events. This can contribute toward proactively improving travel management for all planned special events in a region. The project team can compile comments, develop surveys, and identify successes and failures to create a post-event report, often called an after-action report. The after-action report should be completed in conjunction with the project team and conducted with a focus on resource management and improving the delivery of services for the next planned event.
Activity #29, Event Patron Survey Preparation and Analysis, was chosen to illustrate the Post-Event category. An event patron survey is a useful tool for determining what can be changed for future events as well as assisting in the planning of similar events. The survey itself should be developed during the planning phase of the project. Unlike all of the other tasks discussed as part of this project, event patron survey preparation and analysis spans the life of the project and encompasses time spent throughout all of the phases of the project. The survey also encompasses the remaining sections of the project, since the survey should reflect real-time conditions on the day of the event. The survey needs to be completed, and the means of distribution determined, before the event itself so the process is seamless.
When the event is completed, this survey needs to be analyzed and a report prepared that discusses the results of the survey. This allows meaningful data to inform future event planning. The staff time for this portion of the project can be seen in Exhibit 3.12.
| Department | Level | Hours | Rate | Total |
|---|---|---|---|---|
| DOT Traffic Engineering (TE) | Senior Staff | 11 | $55.00 | $605.00 |
| DOT Traffic Engineering (TE) | Mid-Level Staff | 24 | $38.00 | $912.00 |
| DOT Planning Department | Senior Staff | 8 | $55.00 | $440.00 |
| DOT Planning Department | Mid-Level Staff | 18 | $38.00 | $684.00 |
| TOTAL | $2,641.00 |
Cost-Tracking for an Example Special Event
The final activity identified in Exhibit 3.1 includes cost analysis of the event. An analysis of the total costs of managing the event is developed by tracking direct costs throughout the project and assigning indirect costs collected through the financial management system.
The purpose of this section is to provide a simple stylized example of the tabulation of costs of a hypothetical event. This example will help to familiarize the user of this primer with the types of data necessary to successfully track the costs of a planned special event.
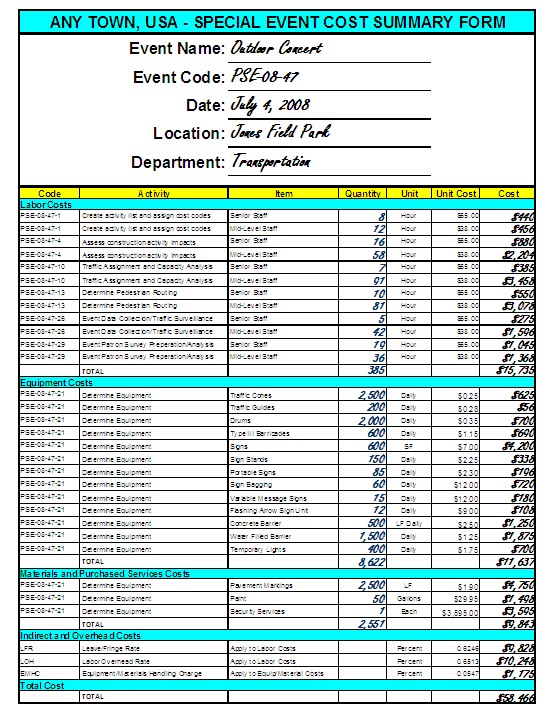
The stylized example is provided in Exhibit 3.13. The example uses the following hypothetical event: An outdoor concert at Jones Field Park in Any Town, USA that is held on July 4, 2008 and located off State Route 1. The hypothetical event is also assumed to be the 47th PSE event in the area in 2008. The exhibit lists the DOT costs for the activities with direct costs, including:
- Hour and rate detail for staff members
- Usage and rate for equipment
- Costs for purchased materials and services
- Leave and fringe rates for staff costs
- General overhead rate that is applied to labor costs
- Equipment and materials handling rate that is applied to equipment and material costs
Exhibit 3.13: Costs for a Hypothetical Example Planned Special Event
1 Federal Highway Administration. (2003). Managing Travel for Planned Special Events. Retrieved from https://ops.fhwa.dot.gov/program_areas/sp-events-mgmt/handbook/index.htm
2 Federal Highway Administration. (2006). Planned Special Events: Checklists for Practitioners. Retrieved from https://ops.fhwa.dot.gov/publications/psechecklists/index.htm