Rural Interstate Corridor Communications Study
Report to States
Appendix B. Using the SVG Viewer
B1. Overview
An Internet mapping application was developed to support the corridor profiling aspect of the Rural Interstate Corridor Communications Study. The original application developed in 2007 was later enhanced to add several capabilities to maximize the use and visualization of collected data.
The Mapping System was developed using Scalable Vector Graphics (SVG) technology, an innovative technology based entirely on open standards and open source components, for producing two-dimensional graphics and graphical applications. The application includes a generic map application with one map view for each of the three corridors along with several map manipulation, navigation and visualization functions. It uses data in a standard GIS format such as ESRI shapefiles as its input, which will then be converted into an SVG format using customized scripts in ESRI GIS software.
B.2 Accessing the Application
The application is easily accessible through a standard web browser and preferably using Internet Explorer. The users can access the application using the following web URL - http://camims01.camsys.com/svg/FHWARR_2/mainpage/view.htm.
Figure B.1 Components on the Main Page
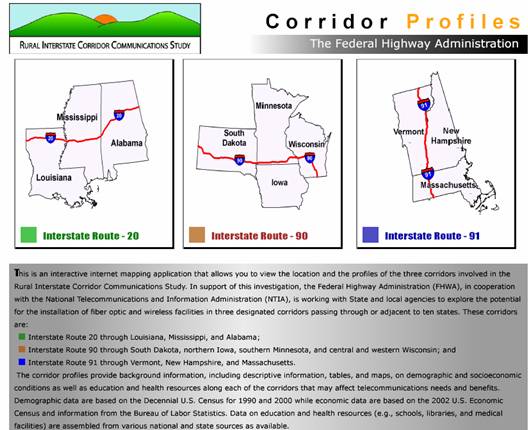
Figure A.1 shows the layout of the main page in the application. From this page, the user can click on any of the maps or their corresponding texts to navigate to the map views of individual corridors. The main page also provides a brief description regarding the study. By clicking the "Rural Interstate Corridor Communication Study" logo, the user can navigate to the overall project web site.
Figure B.2 Sample Corridor Map View (I-20)
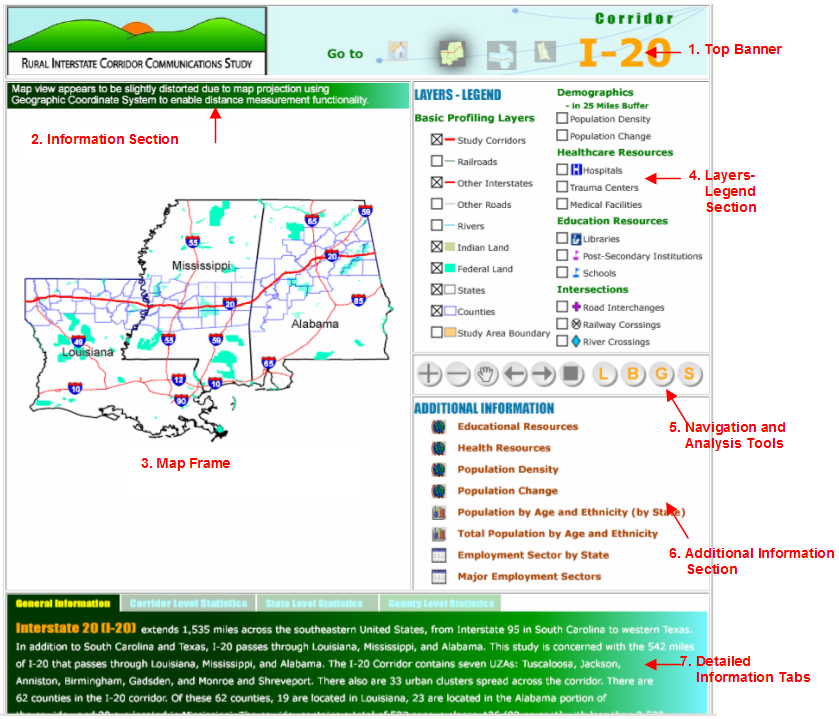
Figure A.2 shows a snapshot of a sample corridor map view (I-20) in the application. The entire view can be divided into 7 different elements.
1. Top Banner – The top banner consists of the project logo along with several icons that help the user to navigate to either the main page or to other corridor map views. The user can place the mouse cursor over each of the icons to see the corridor name and then click on these icons to navigate to the corresponding map view.

2. Information Section – The information provides important information regarding the map view and the attributes that relate to the "Measure Tool" and the "Buffer Tool." More details on this section will be provided while describing each of these tools.
3. Map Frame – The map frame consists of the initial extent of the corridor provides an interactive environment for the user to visualize, navigate, and select several features on the map interface. The exact behavior of this interactive environment is dependent upon the tool that the user selects. For example, if the user chooses the "Pan Tool" the map frame enables user to drag and point the mouse cursor to locate the new extent to pan to. This map frame is the primary interactive area for the user to geographically visualize the corridor data.
4. Layers-Legend – Several layers of geographic data are included as a part of this interactive mapping application. This section enables the user to identify all these layers on the map interface and also to turn on/off any of these layers in an interactive manner. In order to turn a layer on (to display a layer on the map frame), the user can simply clicks on the check box to show the check symbol. Similarly, in order to turn the layer off, the user clicks again on the check box to turn off the check symbol. Please note that the initial display has only a few layers checked on and other layers can be turned on as required.
5. Navigation and Analysis Tools – The following are the Navigation and Analysis Tools provided in the application.
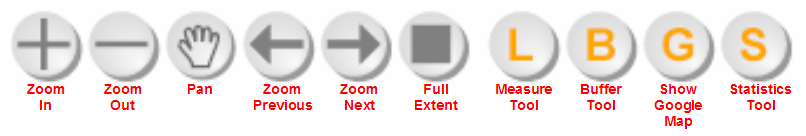
Any tool can be activated by simply clicking on the corresponding tool. Tools like Zoom in, Zoom out, Measure, Buffer and Statistics require the user to perform certain interaction in the map frame. Also, when the user clicks on these tools, the corresponding tool icon turns into blue color indicating that a selection has been made.
Zoom In and Zoom Out Tools – Allows the user to zoom in and out in the map area. To use these tools, the user selects the tool and draws a rectangle on the map frame, using the mouse, indicating the area the user wishes to zoom in/out. Upon releasing the mouse button the map frame adjusts its extent to show the user specified extent.
Pan Tool – Allows the user to pan across the map by holding down the left mouse button and dragging the cursor.
Previous Extent – Zooms to the last extent chosen by panning or zooming. This tool allows the previously accessed extents to be displayed.
Next Extent – Zooms to the next extent chosen by panning or zooming. This tool allows access to the subsequent extents while using Previous Extent tool.
Full Extent – Zooms out to the full extent of the map.
Measure Tool – Enables users to measure the distance between a set of points. The user clicks at a point on the map, then successively on other points and a line is drawn from the first clicked point to the next clicked point and so on, and the accumulated distance to each point is displayed on the map inside the 'Information Section', as shown in the figure below.

Buffer Tool – Enables users to create a point buffer overlay of specified size on the map interface. To use this tool, the users clicks anywhere on the map and specifies the buffer distance in the 'Information Section' and clicks on the "Go" button to show the cirular buffer transperant overlay on the map view. The user can then click anywhere on the map view and move the overlay freely to any location on the map.

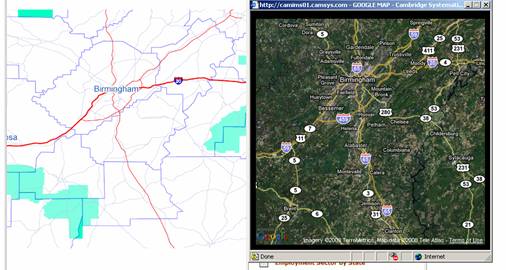
Show Google Map – Ties the current SVG map view with a Google map view and enable users to view Google's maps and satellite imagery for the current SVG map extent. Upon clicking on this tool, the application opens a new window showing similar extents of the Google map view as in the Map frame.
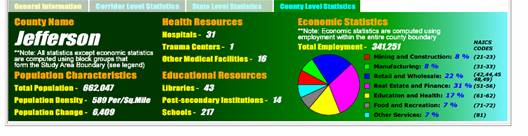
Statistics Tool – Shows statistics at three geographic levels such as the entire corridor, State level and the county level. Different kinds of demographic, economic, health and educational statistics can be viewed using this tool.
In order to obtain the corridor level statistics, upon activating the tool, the user clicks on the "Corridor Level Statistics" tab in the "Detailed Information Tabs" section and then should click on the corridor in the map frame. Doing so would select the corridor (turns into a yellow shade) and updated the statistics for the entire corridor. Similarly, to obtain the State level statistics, the user clicks on the "State Level Statistics" tab and selects a particular State on the map view. As the user selects different States, their corresponding statistics get updated. Similarly, to obtain county level statistics, the user clicks on the "County Level Statistics" tab and select a county on the map interface (the user should make sure the 'Counties' layer is checked on in the 'Layers-Legend' section). Upon selecting a county, the user can navigate onto State or corridor levels and compare corresponding statistics.
6. Additional Information Section – Provides access to previously compiled static maps and tables related to a particular corridor. The user can simple click on the required map/table in the interface and a new window opens with the corresponding information.
7. Detailed Information Tabs – Provides general description of the corridor and the tabs provide statistical information at various geographic levels while using the "Statistics Tool."