1. Introduction
The iFlorida Model Deployment began with the Federal Highway Administration's (FHWA) release of a request for applications (RFA) entitled Surface Transportation Security and Reliability Information System Model Deployment. In this document, FHWA called for a model deployment to examine how the widespread availability of real-time transportation information would enhance the security and reliability of the surface transportation system. Florida Department of Transportation (FDOT) District 5 (D5) responded to this request with a proposal for a model deployment entitled "iFlorida."1 This proposal laid out plans for a model deployment that consisted of activities in the following seven areas:
- The iFlorida plans for metropolitan operations would be supported by deploying a network of real-time traffic sensors and traffic surveillance cameras on both limited access highways and arterials in the Orlando metropolitan area, as well as interfacing to the Florida Highway Patrol Computer Aided Design (FHP CAD) system and contracting for receipt of weather data. Data from these sources would be consolidated by Transportation Management Center (TMC) decision support software and used to control traffic management resources such as dynamic message signs (DMS), variable speed limits (VSL), 511 messages, and road ranger (motorist assistance) activities. Other activities would help coordinate between organizations involved in traffic management in the Orlando area. The City of Orlando Integrated Operations Center (IOC), the Brevard County Emergency Operations Center (EOC), Orlando-Orange County Expressway Authority (OOCEA), and the LYNX transit agency would all be connected to the FDOT Intelligent Transportation Systems (ITS) network to facilitate sharing information. FHP patrol cars would be issued laptops that could connect to the ITS network through a broadband wireless system deployed along a portion of I-4.
- The iFlorida plans for statewide operations would be supported by deploying a statewide network of traffic sensors and surveillance cameras at select locations throughout the state. This data, as well as incident data from the FHP CAD system and weather data, provided the basis for supporting statewide traveler information systems (i.e., 511 and a Web site). One novel feature of the statewide data collection was the use of available bandwidth in an existing microwave network to provide network connectivity to the statewide network of traffic sensors and cameras.
- The iFlorida plans for traveler information operations would be supported primarily through Central Florida and a Statewide 511 system and a Web site that provided access to both Central Florida and statewide traveler information. A large number of additional dynamic message signs would also be deployed along with variable speed limit signs to provide other means of providing traveler information to the public.
- The iFlorida plans for evacuation operations would be supported by deploying a series of traffic monitoring stations along SR 528, a key evacuation route between the east coast and Orlando. This route is one for which contraflow, the temporary reversal of traffic direction, might be used during an evacuation. Several organizations involved in evacuation decision making, including the Orlando IOC, the Brevard County EOC, and the State EOC, would be provided with network connectivity so that they could access iFlorida data. Bridge wind speed monitors were deployed on two bridges to support bridge closure decision making in case of high winds. FDOT also expected to use its traveler information resources to support evacuation operations.
- The iFlorida plans for weather information included two types of weather data to support FDOT traffic management activities. FDOT would deploy a number of road weather information system (RWIS) stations, including wind speed stations on two bridges. FDOT also would contract to receive weather data from a company that specializes in providing weather data customized to specific assets.
- The iFlorida plans included five projects, listed below, related
to security:
- An automated system to monitor the security of high-priority bridges.
- An on-board alarm system on Orlando LYNX transit system buses that can transmit real-time video from the bus interior to the LYNX operations center.
- A vulnerability assessment of the FDOT D5 Regional Traffic Management Center (RTMC).
- The use of traffic modeling to test transportation strategies that might be applied if a security incident occurs.
- The development of an emergency evacuation plan for the Daytona International Speedway and recommended practices for similar emergency evacuations.
- The iFlorida plans called for consolidating all of the data described above in a data warehouse and archiving the data for future analysis. Other organizations could request access to this data warehouse. The remainder of this section provides a more detailed description of the model deployment activities and the software and hardware and deployed to support it.
1.1. Metropolitan Traffic Operations
Before iFlorida, the primary traffic monitoring system being used in the Orlando area was the I-4 Surveillance Motorist Information System (SMIS), which included 70 loop detectors spaced at roughly half-mile intervals over a 39-mile stretch of I-4 with 50 closed circuit television (CCTV) cameras. The FHP Troop D dispatch center, which was co-located with FDOT in the D5 RTMC, also received 911 and FHP calls reporting information about incidents.
Several additions to Orlando traffic monitoring were programmed outside of the iFlorida deployment. The SMIS was extended an additional 26 miles so that it reaches from US 27 in Kissimmee in the west to Daytona Beach in the east. A similar network of sensors and cameras was deployed on I-95 as part of the Daytona Area Smart Highways (DASH) project. The OOCEA implemented a transponder-based travel time data collection system that covered all of the toll roads under its authority and began deploying 111 CCTVs throughout its network. Eight CCTVs were deployed on the Florida Turnpike between mileposts 263 and 267. On the arterials, the City of Orlando deployed 9 CCTVs at key intersections and Orange County deployed an additional 7 CCTVs.
The iFlorida deployment complemented these programmed changes with the following additional traffic monitoring capabilities:
- Transponder-based travel time monitoring was implemented on the Florida Turnpike, the western end of SR 528, and the northern and southern ends of SR 417. These travel times complemented those delivered by OOCEA to provide complete travel time coverage for toll roads in the Orlando area.
- The seven highest priority arterials were equipped with transponder-based travel time monitoring. The monitored arterials were US 17, US 441, SR 50, SR 436, SR 423, and SR 414.
- License plate readers were deployed to monitor travel times on US 192 and SR 520.
- Eighteen micro-loop detectors were deployed at about 1-mile intervals along SR 528 from SR 520 in the west to almost A1A in the east. Four additional detectors were placed on the parallel portion of SR 520. (This traffic monitoring capability was meant primarily for monitoring evacuation traffic.)
- CCTVs were deployed at 12 key arterial intersections, with 2 additional cameras deployed to monitor traffic at the intersections of A1A with SR 528 and SR 520, respectively.
Altogether, the programmed and iFlorida deployments provided complete traffic flow monitoring on Orlando limited access highways and on 128 miles of the most important arterials, as depicted in Figure 1. In this figure, the shaded roads are those for which traffic monitoring was available after the iFlorida deployment was complete. This included roads that were instrumented as part of iFlorida (e.g., red for arterials, green for Florida Turnpike), as well as roads that were instrumented as part of other initiatives (e.g., blue for SMIS on I-4, purple for OOCEA travel time program on toll roads).
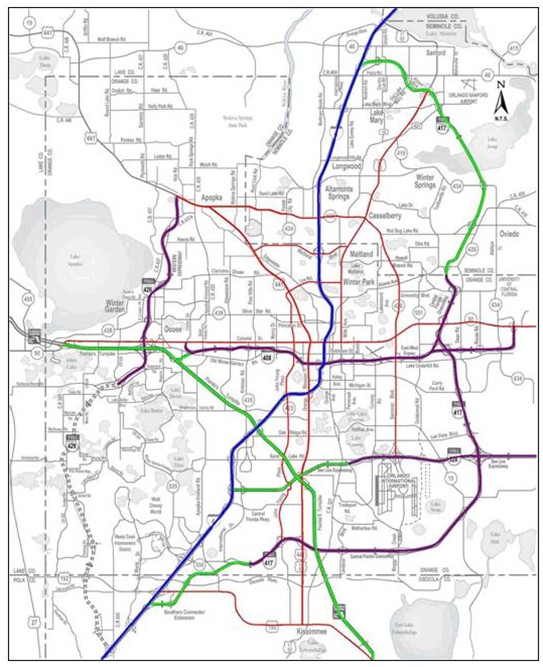
Figure 1. Orlando Metropolitan Area Operations
Not shown in this figure are the traffic monitoring on I-4 that extends north and east to the intersection of I-4 with I-95, the traffic monitoring on I-95 east of Orlando near the coast, and the traffic monitoring on SR 520 and SR 528 between the eastern coastline and Orlando.
1.1.1. Traffic Detection on I-4
Figure 2 depicts the locations of the SMIS traffic monitoring stations on I-4 in the Orlando area.
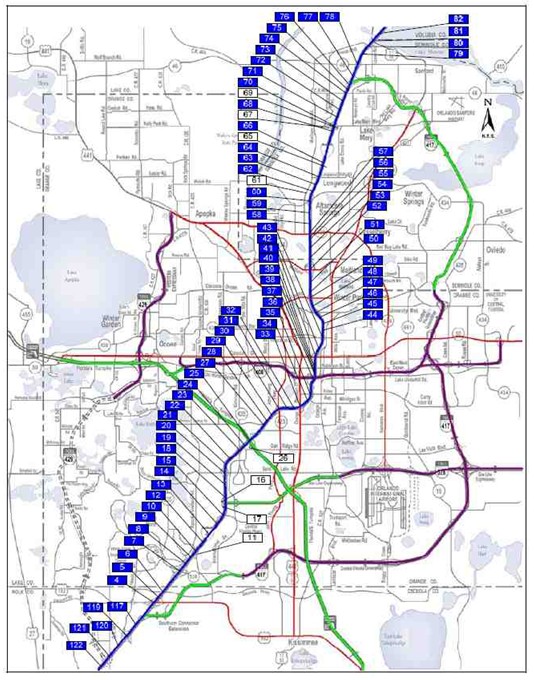
Figure 2. SMIS Traffic Monitoring on I-4 in the Orlando Area
Each traffic monitoring station measured volume, speed, and occupancy, either using dual loops or Wavetronix radar. The stations on the mainline (shaded blue in the figure) were spaced at roughly half-mile intervals. Additional stations (not shaded in the figure) were used at some entrances and exits. Traffic monitoring on the depicted region of I-4 existed prior to the iFlorida Model Deployment.
1.1.2. The FDOT AVI Travel Time Network
In order to monitor traffic conditions on other roads in the Orlando area, FDOT deployed a collection of toll tag readers, as shown in Figure 3.
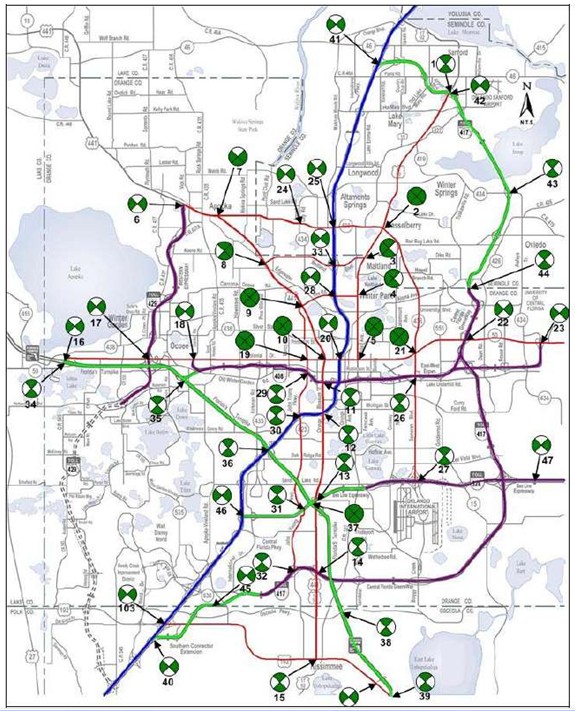
Figure 3. The iFlorida AVI Network
In this figure, each circular icon represents a location at which toll readers were deployed, with the shaded quadrants indicating the directions of travel that were monitored. For example, if the upper quadrant is shaded, then toll tags are read for northbound traffic. In total, FDOT deployed 119 toll tag readers that provided travel times on 78 arterial travel time links and 24 toll road travel time links. The average length of the arterial travel time links was about 3.5 miles, with the average length on the toll roads being just over 6 miles.
1.1.3. The OOCEA AVI Network
OOCEA deployed a denser network of toll tag readers, deploying about 150 readers to create 163 travel time links with an average link length of 1.6 miles (see Figure 4).
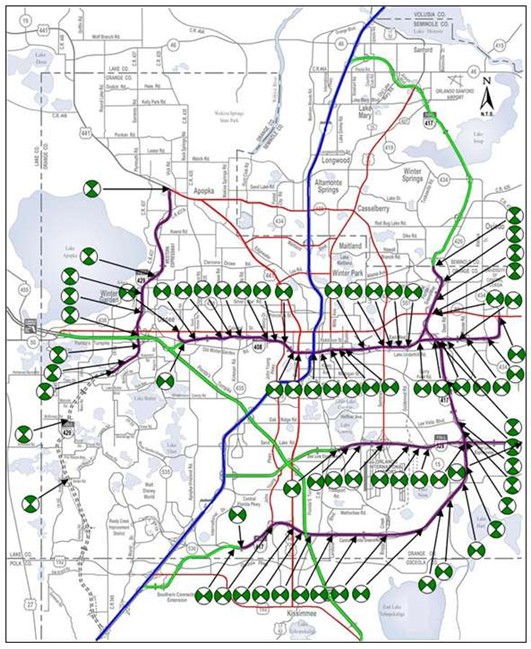
Figure 4. The OOCEA AVI Network
The dense network of detectors meant that the OOCEA network provided several capabilities not possible for the sparser iFlorida AVI network:
- More accurate estimates of the average travel time. The closer sensor spacing of the OOCEA AVI network provides fewer opportunities for vehicles to divert between the sensors, which will result in more travel time measurements and fewer outliers caused by vehicle diversions. Both of these factors make the average of the travel time measurements a more accurate estimate of the average travel time. In the case of the OOCEA AVI network, greater travel time accuracy was also achieved by separately measuring travel times for long interchange ramps. This allows route travel times to better consider the time required to navigate interchanges..
- More timely travel time estimates. In general, closer sensor spacing for a toll tag travel time network does not directly result in more accurate travel time measurements; each measurement is an accurate measurement of a vehicle travel time. Closer sensor spacing does reduce the latency of the travel time measurements. (A travel time measurement is completed when a vehicle reaches the endpoint of a segment, so receipt of that measurement is delayed by the time it takes the vehicle to drive the segment. A longer segment results in a greater delay.) More timely travel time estimates more accurately represent current traffic conditions.
- Resilience in case of a detector failure. If a sensor failed in the OOCEA AVI network, the travel time generation software would automatically combine adjacent travel time segments so that travel times were still produced for the combined segment. The short spacing between the toll tag readers in the OOCEA AVI network meant that segments created by combining nearby segments were still short enough to provide useful travel time data.2
- Potential for incident detection. The short sensor spacing in the OOCEA AVI network and high travel speeds on the toll roads it covers means that the time between reads at successive toll tag readers is typically between one and two minutes, and shorter on the more heavily traveled roads where a more dense sensor spacing was used. This opens up the possibility of using differences in the expected arrival times to detect incidents that might occur in a timely enough manner to assist with incident response.
1.1.4. Evacuation Route Monitoring
Traffic monitoring was also implemented on SR 520 and SR 528, two key evacuation routes between the coast east of Orlando and Orlando. On SR 520, license plate readers were deployed at two locations to estimate the evacuation travel time along this route. One reader was deployed near the coast at the I-95 interchange and the other near Orlando at the SR 528 interchange. On SR 528, a series of microloop detectors were used to monitor evacuation traffic.
1.1.5. Traffic Cameras
Before iFlorida, FDOT maintained an extensive set of traffic monitoring cameras deployed on I 4, as depicted in Figure 5, and a less extensive set of cameras on Orlando arterial highways. In this figure, the I 4 cameras are shaded blue and numbered, while the arterial cameras are shaded red and not numbered.
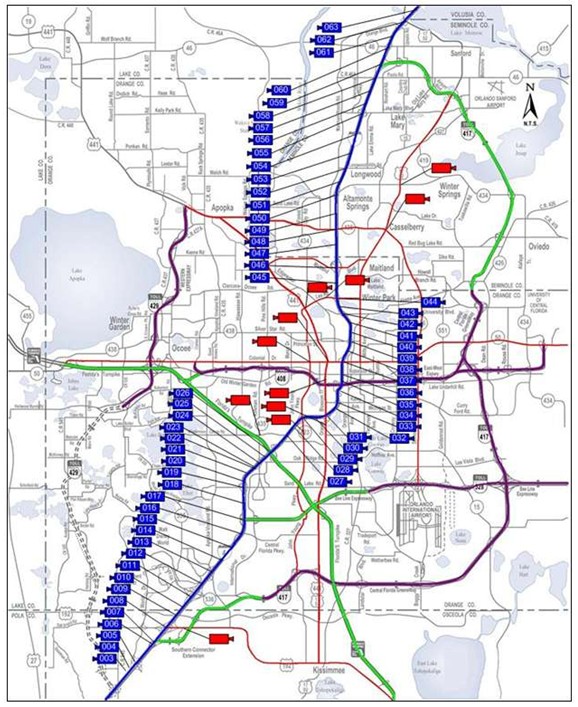
Figure 5. FDOT Cameras in the Orlando Area
1.1.6. Dynamic Message Signs
Another feature of the iFlorida system is the collection of dynamic message signs deployed along I-4, as shown in Figure 6. These signs include both standard DMSs (depicted as shaded boxes) and variable speed limit (VSL) signs (depicted as boxes containing the number 55).
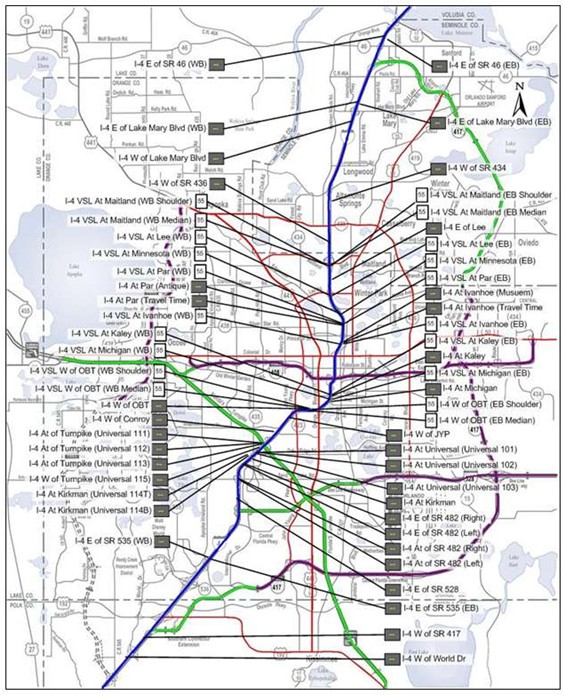
Figure 6. Dynamic Message and Variable Speed Limit Signs in the Orlando
Area
The DMS signs themselves were used in a number of different ways. Some of the signs were devoted to displaying information about nearby cultural and entertainment facilities. Some were used to suggest alternates to Orlando attractions. Some were primarily used to provide travel time information. Some were blank or carried informational messages (e.g., "For Traffic Information Dial 511") until an incident or congestion occurred, in which case the messages were changed to provide information to travelers about the incident or congestion.
FDOT also deployed DMSs along I-95 and on arterials located near the interchange between I 95 and I-4. The locations of these signs are depicted in Figure 7.
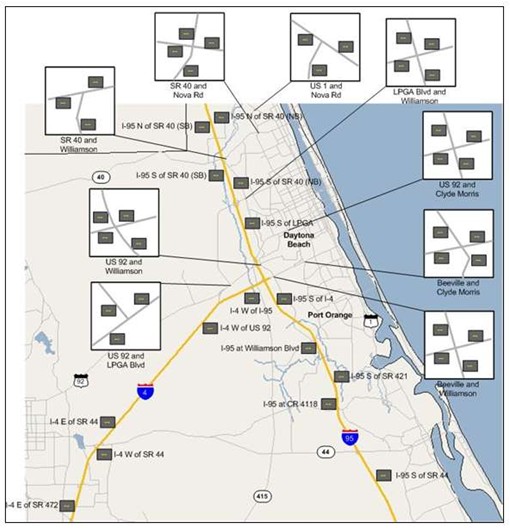
Figure 7. Dynamic Message Signs Near the I-95 / I-4 Interchange
The message signs along I-4 and I-95 were used primarily for travel time and incident information. The arterial message signs were used to help manage traffic during events at the Daytona International Speedway and when traffic was diverted onto arterials after a significant incident on I-95 or I-4.
1.1.7. Incident Data
Before iFlorida, considerable coordination existed between FDOT and FHP. The FHP dispatchers and RTMC operators shared a single room. FHP dispatchers often informed RTMC operators when an incident occurred and sometimes requested that RTMC operators move a camera so they could get a better view of an incident. FHP also maintained a Web site that provided incident information to the public, which the RTMC operators sometimes consulted.
The iFlorida project introduced automated exchange of incident information by developing an interface through which incident data from the FHP CAD system was transferred to FDOT. The intention was for data from FHP CAD incidents to be transmitted to the RTMC Condition Reporting System (CRS), where operators could choose whether to integrate the data into the CRS traffic data. If it was integrated into the CRS data, the information would appear on the traveler information Web site and could be used to trigger other traveler information activities. Otherwise, the data was ignored.3
1.1.8. Weather Data
The iFlorida deployment contracted for the receipt of weather data. Three different types of weather data were provided. First, RWIS stations were deployed, including stations on bridges that provided information about bridge wind speeds that could be used to guide bridge closure decision making. Second, FDOT contracted with a third party to receive road-specific current and forecast weather data for road monitored by iFlorida. Through this contractor, FDOT also received severe weather alerts for specific areas and roads.
1.1.9. Traffic Management
A key part of the iFlorida Model Deployment was the development of new software to support RTMC operations. The Condition Reporting System (CRS) was to integrate data from all of the sources of metropolitan traffic information and provide tools to support traffic management activities based on this data, such as:
- Managing 511 messages.
- Managing DMS messages.
- Determining speed limits to display on VSL signs.
- Providing data to the FDOT traveler information Web site.
- Dispatching road rangers.
- Sharing data with other transportation organizations.
The Central Florida Data Warehouse (CFDW) was to archive iFlorida data to support future analysis of the data. Neither the CRS nor the CFDW worked as expected, which limited the benefits seen by FDOT during the iFlorida deployment.
1.2. Statewide Traffic Operations
A second part of the iFlorida deployment focused on monitoring statewide traffic, with the primary objectives being to support statewide traveler information systems and hurricane evacuation decision making. Statewide traffic operations were managed at the D5 RTMC and covered 10 key highways in the State: the Florida Turnpike, I-4, I-10, I-75, I-95, SR 60, SR 70, SR 528, US 19, and US 27. These roads are highlighted in Figure 8 below.
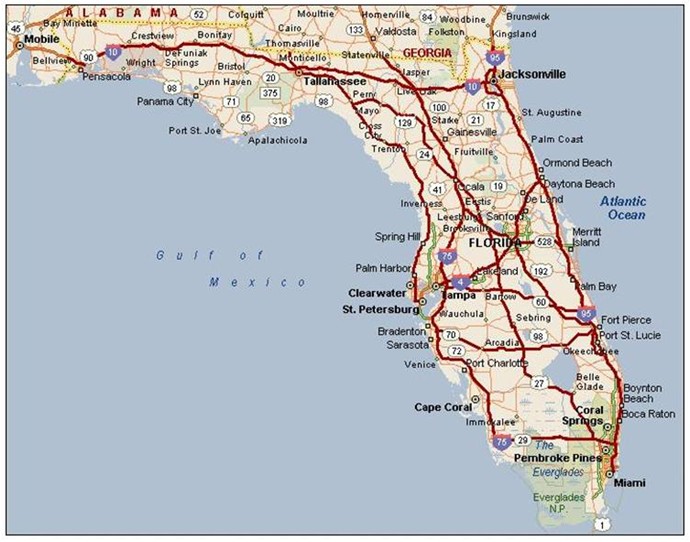
Figure 8. Statewide Traffic Operations
FDOT used the same CRS/CFDW software systems to support statewide traffic operations. The agency also relied on the FHP CAD system for incident data and contracted weather services for weather data. FDOT supplemented this information with a Statewide Monitoring System (see Figure 9), which consisted of radar speed and volume counts with traffic monitoring cameras at 25 sites in locations across the State. FDOT also established a method in which other FDOT districts could report construction and maintenance operations.
Figure 9. The Statewide Monitoring System
FDOT used the same CRS/CFDW software for consolidating statewide traffic data and managing statewide traveler information as was used for the Orlando metropolitan area. These systems were used to support a statewide 511 system and a statewide traveler information Web site.
1.3. Traveler Information
A key part of the iFlorida Model Deployment was enabling traveler information service enhancements. These services included:
- Dynamic message signs. Most of the I-4 DMSs predated the iFlorida deployment, though the VSL signs were added by iFlorida. The network of DMSs along I-95 and trailblazer signs on nearby alternate routes was deployed in the same time frame of the iFlorida deployment, but not as part of iFlorida.
- Central Florida and Statewide 511 services. The Central Florida 511 service extended the pre-iFlorida system, which provided information only for portions of I-4, to a system that provided traveler information on all of the roads highlighted in Figure 1 as well as I-95 east of Orlando and the portions of I-4, SR 520, and SR 528 from Orlando to I-95. Before iFlorida, no statewide 511 service existed in Florida. The statewide 511 system covered the roads highlighted in Figure 8.
- Traveler Information Web site. Before iFlorida, information about travel times on I-4 was available via the Internet, though the service was not widely advertised or often used. One part of the iFlorida deployment was the creation of a Central Florida and a Statewide traveler information Web site.
1.4. Other iFlorida Activities
The iFlorida Model Deployment also included a number of projects that did not fit easily into the above categories. These projects included:
- Operation Center Connectivity. Fiber connections were established between the D5 ITS network and other regional transportation agencies, including the City of Orlando Integrated Operations Center, the Brevard County Emergency Operations Center, and the LYNX transit operations center. These connections allowed these agencies to share information.
- Use of Archived Transportation Data. Several projects were included in the iFlorida plans to make use of the transportation data that would be consolidated in the CFDW. FDOT planned to conduct a network reliability analysis for Orlando roads and to use iFlorida traffic data to support traffic modeling to assess alternate routes in case of a bridge closure. METROPLAN, the Metropolitan Planning Organization for Orange, Osceola, and Seminole counties, was provided with funding to explore the usefulness of iFlorida data to support regional planning activities. Because the CFDW did not operate as expected, FDOT delayed completion of these projects until a more reliable data warehouse was available.
- Security Projects. The iFlorida plans included four projects related to transportation security. One project conducted a vulnerability assessment of the D5 RTMC, and another developed an evacuation plan for the Daytona International Speedway. A third project used a broadband wireless system deployed along a portion of I-4 to support a bus security video system for buses using that route. The last such project deployed a video security monitoring system at two Florida bridges.
1 The iFlorida deployment was led by FDOT D5, not the FDOT central office. To improve readability of this document, the acronym FDOT is used to refer to FDOT D5 throughout this document. When there is a possibility of confusion, "Florida Department of Transportation" rather than "FDOT" is used to refer to the department as a whole.
2 Because the CRS design could not accommodate on-the-fly combination of travel time segments, this feature could not be used in the iFlorida system.
3 Problems with the CRS prevented this interface from working reliably, with RTMC operators often using the FHP Web site for FHP CAD incident information.