EXECUTIVE SUMMARY
Purpose – The purpose of this study is to estimate the influence that large planned special events (PSEs) have on both the economy and congestion on a national level. Transportation planners define PSEs as public activities with a scheduled time and location that affect normal transportation system operations as a result of increased travel demand and/or reduced capacity attributed to event staging. The types of PSEs that are of interest to this study are those special events with more than 10,000 participants and spectators. Increased awareness of the frequency and economic magnitude of these large events is essential to better understanding the important role transportation planning should play in managing the transportation aspects of these events.
Data Collection – Currently, information on PSEs is largely fragmented and dispersed. This is the first known systematic attempt to collect and estimate the size, frequency, and economic magnitude of large PSEs nationally. In order to overcome challenges in data dispersion and availability, an effort was made to collect information from secondary sources, event organizers, event venue managers, and government officials. This study is essentially a first glance at the subject. It provides order-of-magnitude estimates of the extent of these events and lays the groundwork for refinement in future research.
|
Annual Estimates of PSEs with More Than 10,000 Attendees
|
Attendee revenue and spending estimates were often based on reported numbers for direct attendee spending on tickets, concessions, and merchandise during the events. At other times, these estimates were made using association or industry revenue and attendance data. In addition to direct spending at events, event attendees spend money outside the event on travel, restaurants, hotels and other goods and services. These two spending categories together are referred to as total attendee spending. Attendee spending at and outside events stimulates further spending in the economy. The sum of all this economic activity is known as economic impact. This report classifies PSE frequency, attendance, and economic data by event activity types, such as professional sports events, concerts, and fairs.
|
Economic Activity Types
|
Case Studies – To develop a better understanding of PSEs, four city-level case studies were conducted: Detroit, Michigan; Portland, Oregon; El Paso, Texas; and Columbia, South Carolina. The case studies describe the special events venues in each city and include information on the venues' locations, maximum capacities, event type characteristics, and frequency of hosting large PSEs. A summary table of the four case studies is provided in Exhibit ES-1. It can be seen that there are relatively few permanent venues capable of hosting large crowds in the case-study cities.
| Region | Major Venues | Number of Events | Event Days Per Million Capita | Most Frequent Events |
|---|---|---|---|---|
| Detroit, MI | 7 | 526 | 134 | Professional team sports & concerts |
| Portland, OR | 7 | 187 | 108 | Professional basketball, concerts, & festivals |
| El Paso, TX | 4 | 93 | 142 | College events: sports & graduations |
| Columbia, SC | 5 | 94 | 214 | High school & college events |
Source: Study estimates
Events and Attendance – Most of the PSE frequency and attendance estimates were developed by aggregating data from several of the event type categories used in this report. A summary table of number of events and attendance by event type category is provided in Exhibit ES-2.
| Event Category | Number of Events | Attendance (Millions) |
|---|---|---|
| Professional Team Sports | 5,689 | 147 |
| College Sports | 1,897 | 50 |
| Other Professional Sports | 3,655 | 78 |
| Street and Park Events | 8,523 | 249 |
| Shows & Concerts | 4,590 | 78 |
| TOTAL | 24,353 | 602 |
A disaggregated summary of the number of events by event type is provided in Exhibit ES-3. As the graph shows, street and park events are the largest category, followed by professional team sports. However, it should be noted that professional team sports data is more readily available and accurate than street and park data.
Exhibit ES-3: Number of Events
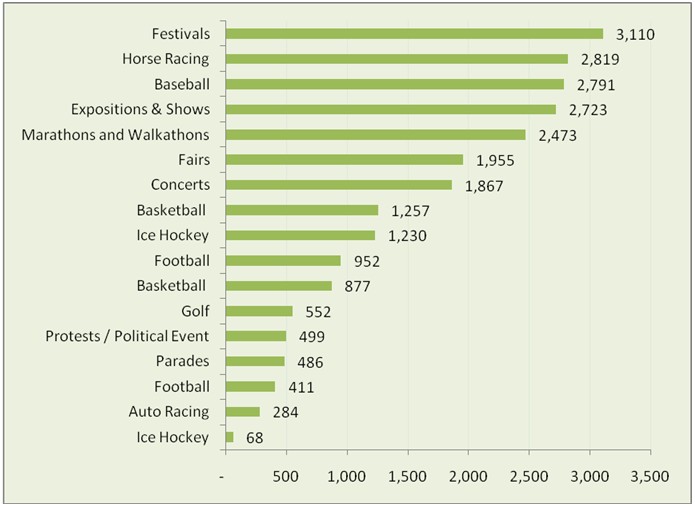
Source: Study estimates.
Economic and Fiscal Impact – Direct in-event revenues for PSEs are about $40 billion annually in the U.S. Direct outside-of-event spending and secondary economic effects raise the total economic impact of large PSEs to $164 billion. Government revenue from these events is estimated to be approximately $4 billion. The event category with the largest economic impact is professional team sports, at about $60 billion, while the category with the smallest economic impact is college sports, with about $6.7 billion. Exhibit ES-4 summarizes economic measurements by event type.
| Event Category | Attendance (Millions) | Total Attendee Spending ($ Millions) | Economic Impact ($ Millions) | Fiscal Impact ($ Millions) |
|---|---|---|---|---|
| Professional Team Sports | 147 | 18,390 | 59,698 | 1,413 |
| College Sports | 50 | 2,053 | 6,666 | 158 |
| Other Professional Sports | 78 | 7,742 | 25,131 | 595 |
| Street and Park Events | 249 | 8,427 | 58,037 | 1,692 |
| Shows & Concerts | 78 | 3,234 | 14,480 | 298 |
| TOTAL | 602 | 39,847 | 164,012 | 4,155 |
Congestion Estimates – PSE congestion accounts for between four to eight percent of total p.m. peak congestion. An important aspect of PSE-caused congestion is that the resulting delays affect both attendees and non-attendees of the events. Travel delay due to PSE-caused congestion is estimated at approximately 93 to 187 million hours annually and results in between $1.7 and $3.4 billion dollars in congestion costs. The results of the congestion analysis are summarized in Exhibit ES-5.
| Congestion Category | Units per Year | Low End Costs | High End Costs |
|---|---|---|---|
| Average Delay per Traveler | Hours | 0.8 | 1.7 |
| Wasted Fuel per Traveler | Gallons | 0.6 | 1.2 |
| Travel Delay | Hours (Millions) | 93.4 | 186.8 |
| Excessive Fuel Consumed | Gallons (Millions) | 63.9 | 127.9 |
| Congestion Cost | US$ (Billions) | 1.743 | 3.485 |
Source: Study estimates.
Mitigation Techniques – A number of traffic mitigation measures can be applied to the various modes of transportation and infrastructures. Many of these measures are classified as Intelligent Transportation Systems (ITS), which apply information and communications technologies to transportation infrastructure and vehicles in an effort to manage vehicles, loads, and routes to improve safety and reduce vehicle wear, transportation times, and fuel consumption. Research on PSE congestion mitigation measures indicates that some measures have the potential to reduce congestion substantially. One study estimates that travel time reductions associated with the introduction of ITS range from 14 to 34 percent for attendees and from 10 to 13 percent for non-attendees.1
|
Mitigation Techniques
|
Research Needs – This study identified a number of areas where additional research is needed. Further research on these topics will enhance understanding of the extent of PSEs, their contribution to congestion, and the costs, benefits, and equity impacts they impose on society.
|
Research Needs
|
Recommendations – Hosting of large PSEs involves important issues including traffic congestion and the costs of planning for and providing transportation management and control. The first step for a city or MPO attempting to manage congestion from these events will be to develop an understanding of the frequency, types, and locations of PSEs in their area. Once this data has been collected, officials can move on to assess the congestion impacts of the events and explore opportunities to apply various mitigation techniques.