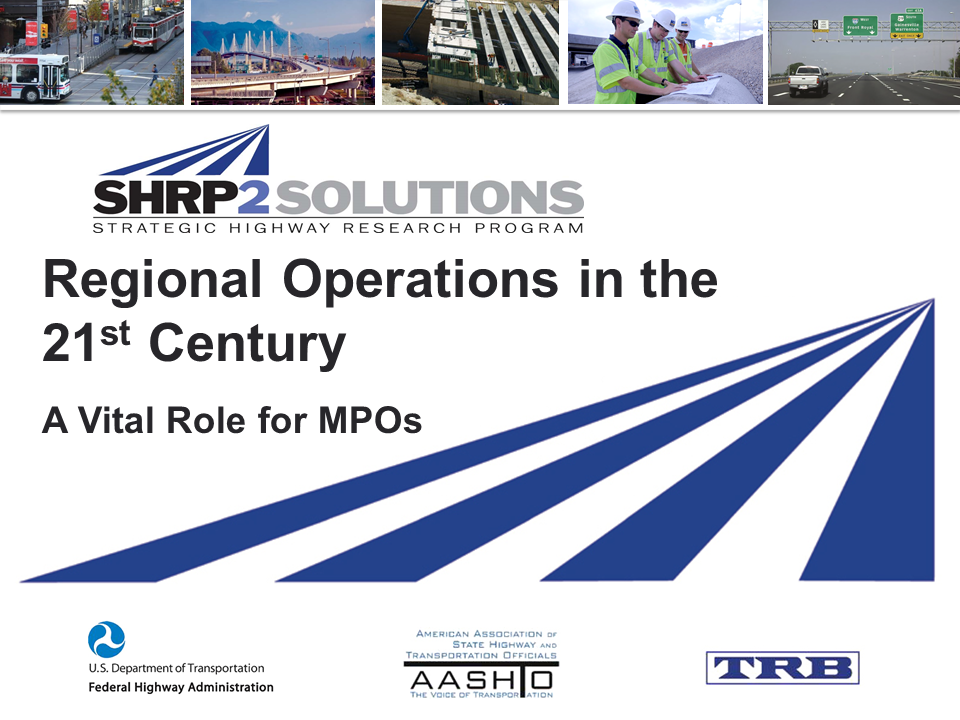
SHRP2 Solutions Regional Operations in the 21st Century – A Vital Role for MPOs
Download the Printable PDF Version [PDF,
1.8 MB]
You may need the Adobe® Reader® to view this PDF.
Download the Printable MS PowerPoint Version [PPTX,
3.8 MB]
You may need the Microsoft PowerPoint Viewer to view this PPTX file.
Presentation Guide
Slide 1.
Notes
Description of the Slide
Cover: This presentation is geared towards MPO executives and their board members regarding the increasingly important role of transportation systems management and operations (TSMO) – hereinafter simply referred to as "operations" – in the effective management and delivery of transportation services within a region. In other words – how operations can help MPOs and their member agencies achieve regional goals and meet customer needs and expectations in a rapidly changing environment.
Key Points
- Hello and thank you for taking time from your busy schedule(s) to discuss transportation systems management and operations; what operations can do to help the MPO and its member agencies achieve regional goals and improve customer service; and some actions you can take to improve operations from a regional perspective.
- Introductions
Other – Depending on the audience and time, consideration should be given to prompting the audience to ask questions at any time during the presentation.
Slide 2. Purpose of This Meeting: Share Thoughts & Discuss
- Challenges brought about by the changing transportation environment and MAP 21
- How "operations" and supporting technologies can help address these challenges
- The importance of "mainstreaming" operations into the regional planning and programming processes
- "Planning for Operations" – an objectives-driven, performance-based approach
Notes
Description of the Slide
Our presentation and discussions today will focus on three key areas as shown here.
Key Points
- The roles and responsibilities of MPOs have evolved and grown over the past few decades since the Federal Aid Highway Act of 1962, which mandated the creation of MPOs and the regional transportation planning process. In general, the planning process initially centered around building and preserving the transportation infrastructure. The responsibilities of an MPO and its member transportation agencies have expanded to also include actively managing and operating their multi-modal transportation networks as effectively as possible so as to meet the regional goals (and customers' demands) for safety, mobility, reliability, and improved environment; and to do so in the most cost-effective manner.
- Operations and the supporting technologies are valuable tools for meeting these challenges and achieving the regional transportation goals.
- Moreover, the current federal transportation authorization (MAP 21) requires MPOs and state departments of transportation (DOTs) to consider projects and strategies as part of the planning process that promote efficient operations.
- Operations cannot succeed in a vacuum – it must be understood and become a core function of all transportation agencies, and be mainstreamed into the regional transportation planning and programming processes.
- As will be discussed later, an objectives-driven and performance-based approach can help make this happen.
Slide 3. What is Operations
Transportation Systems Management and Operations (TSMO, TSM&0)
- "Integrated strategies to optimize the performance of existing infrastructure through the implementation of multimodal and intermodal, cross-jurisdictional systems, services, and projects" (MAP 21)
- Regional integration an important consideration
- Many strategies are multi-modal
- All require inter-agency collaboration, including coordinating with enforcement and incident responders
Notes
Description of the Slide
Before getting into any more discussion, it is perhaps worthwhile to define just what is meant by “operations.”
Key Points
- The current federal transportation reauthorization – Moving Ahead for Progress in the 21st Century Act, or MAP 21 – defines "Transportation Systems Management and Operations."
- A key phrase in this definition is the notion of "integrated strategies." The goal of integration is to bring the management and operation of the surface transportation network into a unified whole, thereby making the various transportation modes and facilities perform better and work together.
- There are many aspects of integration from a regional perspective – for example:
- Technical integration, such as standards and system architectures that support real-time information sharing between ITS-based systems across all modes; and also,
- Institutional integration such as coordination and collaboration between various agencies and jurisdictions in the region to achieve seamless interoperability.
Other – MAP-21 was extended and will expire May 31, 2015. A new transportation authorization (replacing MAP 21) is expected sometime in 2015. The presenter should check the subsequent re-authorization for any change in the definition of TSMO or emphasis.
Slide 4. Example Operations Strategies and Solutions
| Work Zone Management |
Traffic Signal Coordination |
| Traffic Incident Management |
Traveler Information |
| Special Event Management |
Ramp Management |
| Road Weather Management |
Managed Lanes |
| Transit Management |
Active Traffic Management |
| Freight Management |
Integrated Corridor Management |
Implemented and operated by transportation agencies (State DOT, transit agency, local DOT) on a day-to-day basis.
Notes
Description of the Slide
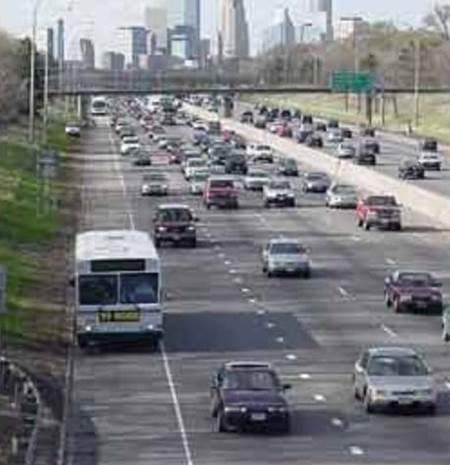
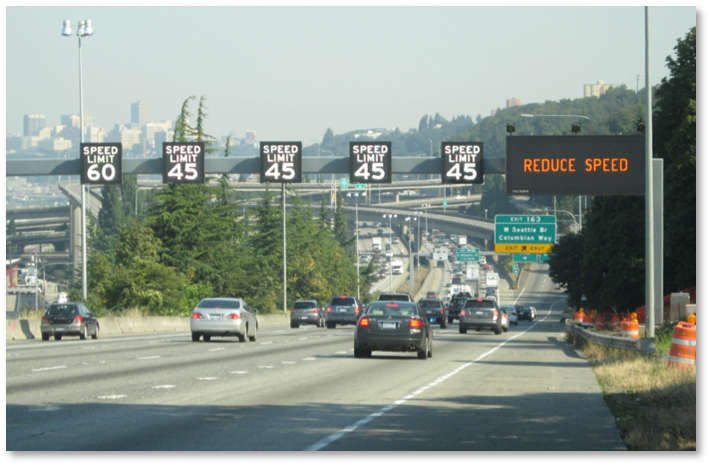
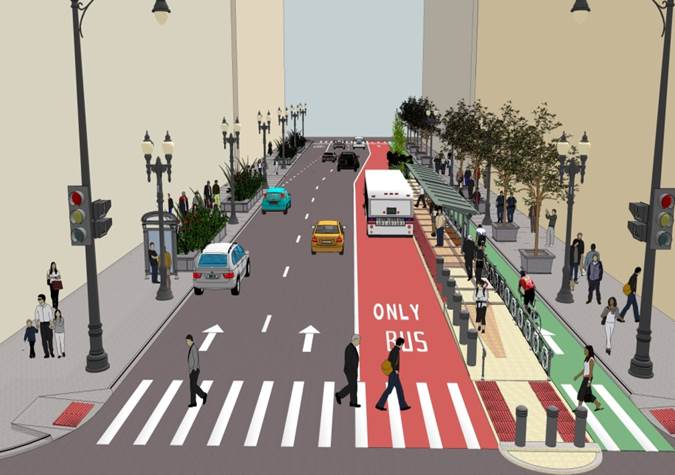
This slide lists several of the operations strategies that have been applied by transportation agencies across the country; and in so doing, they have made substantial positive impacts on the safety, mobility, and reliability of the surface transportation network.
Key Points
- Operations consists of a wide array of possible strategies and opportunities, from every-day activities to cutting-edge solutions and technologies.
- Many of these strategies can be applied to both urban and rural environments.
- These are implemented and operated by the member agencies, with support from the MPO.
Other – If possible, perhaps highlight a few of these strategies in terms of what the specific region has done / is doing. In some cases, the MPO may be actively involved in some of these strategies (e.g., incident management teams), and that should also be mentioned.
Slide 5. The Transportation Environment is Changing
- Increased reliance on information and technology
- Increasing customer needs and expectations
- Growing emphasis on outcomes and performance measurement
- MAP 21 requirements
- Reduced financial resources
- Technology also offers opportunities – enhanced operations and regional multi-modal integration
Notes
Description of the Slide
It should come as no surprise to you that the transportation environment in which your member transportation agencies conduct their business is rapidly changing.
Key Points
- We are living in an information revolution, brought about and supported by new and emerging technologies. In today's connected world, customers are regularly introduced to new ways of using real-time information to save time and money; and transportation agencies are expected to take advantage and use these technologies.
- The traveling public expects that the products they use and the technologies they encounter will be "smart" and that the information received will be accurate and reliable—regardless of who "owns" the road or the information.
- There is also an increased emphasis on accountability and transparency around the subject of how transportation agencies conduct their business; and this requires that the performance of the transportation network be regularly measured and compared to established metrics.
- MAP 21 has several requirements that impact the transportation planning process.
- Moreover, these increased expectations and accountability are coming at a time when government agencies are expected to do more, but with fewer financial resources.
- Technologies can also help transportation agencies meet these increased expectations through the execution of operations strategies. These strategies can also help promote regional integration and boundary-free operations.
Other – The key points listed above are for a shorter version. If a longer version is being presented (including the next 5 slides), then the key points can be skipped, and lead into the next slide with "there are several reasons behind this changing environment."
Slide 6. Technology is Transforming Our World
- Increased availability of information
- Internet connectivity, wireless communications, cloud computing
- Information is available 24/7 on mobile devices
- Shifting customer expectations: technology leads to improved efficiencies and service
- The future – even more innovative technologies and a shorter shelf life
- New data services
- Connected / autonomous vehicles
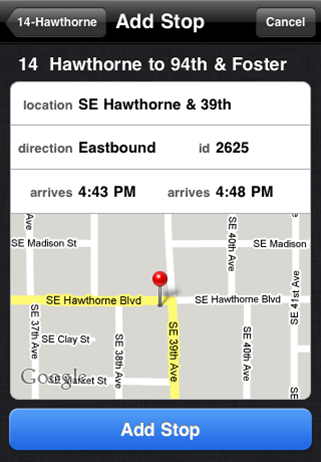
(Source: Portland TriMet)
Notes
Description of the Slide
We are living in an information revolution. The internet and wireless communications, coupled widespread use of mobile devices and related technologies, have transformed the way business is done and how value is delivered.
Key Points
- In today's connected and information-rich world, customers are regularly introduced to new ways of using real-time information to save time and money; and transportation agencies are expected to take advantage of and use technology to improve efficiency and service.
- The agencies' customers – that is, the traveling public within the region – expect that the products they use and the technologies they encounter will be "smart" and will ultimately improve their travel experience. They also expect that the information received will be accurate and reliable—regardless of who "owns" the road or the information.
- Moreover, technology will likely have an even greater impact on the transportation network in the future. We are watching a new era of transportation emerge through the Connected Vehicle program that allows cars and infrastructure to communicate with one another. And a week doesn't pass without some news article on the future of autonomous vehicles. How these future technologies may impact the ways in which we manage and operate the transportation network is mind-boggling.
Slide 7. Customer Expectations and Needs are Changing
- Public's expectations of government
- Increased productivity and efficiency
- Greater demand for accountability – value expected from the use of tax dollars and transit fares
- Transportation network viewed as a "whole"; not concerned with which agency owns the facility
- Improved performance and service for commuter, freight, recreational, and other trips
- Mobility including reduced delays and congestion
- Safety
- Accurate, timely, and accessible information
- Reliability (a focus of SHRP 2 program)
Notes
Description of the Slide
As already noted, advances in technology and the availability of real-time information have increased MPO customer expectations.
Key Points
- Technology has been harnessed by the private sector to improve productivity; and the same is expected (and is well underway) for government entities.
- Part of these increased expectations is a greater demand for accountability – that customers are receiving value for their tax dollars and transit fares. Moreover, transportation users view the transportation network as a regional whole; and are not that concerned with which agency owns or is responsible for a particular facility.
- As a result, transportation customers are expecting improvements in mobility, safety, information, and reliability.
- With respect to the last point, congestion is an accepted and even predictable reality in major urban areas. So the real source of frustration for users and lost productivity for businesses comes from additional unexpected delays that are encountered because of crashes, special events, unanticipated work zones, extreme weather, and the like. The reliability of the transportation system has come to be at least as important as travel time itself.
Other – There is a "reliability" slide in the "parking lot" at the end of the presentation, and can be used next if the audience may not be aware of what the term "reliability" actually means.
Slide 8. Performance Measures
Element of increased accountability
"The game gets serious when you start to keep score!" Increasing focus on outcomes – improvements in safety, mobility, reliability, on-time performance, emissions, etc.
Emphasized in MAP 21
Goals and associated measures being established for:
- Safety
- Infrastructure Condition
- Congestion Reduction
- System Reliability
- Freight Movement and Economic Vitality
- Environmental Sustainability
- Reduced Project Delivery Delays
Notes
Description of the Slide
The increased emphasis on government accountability and transparency has focused more attention on measuring performance. MAP-21 and FHWA emphasize the use of measureable objectives and associated performance metrics.
Key Points
- Performance measurement for transportation has been gaining traction the past several years. In essence:
- If you don't measure results, can't tell success from failure.
- If you can’t see success, can't reward it.
- If you can’t see failure, can't correct it.
- In other words, you can't manage it unless you measure it!
- Under the requirements of MAP 21, we are beginning the process of "keeping score." Goals and associated performance measures are being developed for several transportation categories.
- There is also an increasing emphasis on the outcomes from transportation improvements. It is no longer enough to say that X lane-miles were added or that Y DMS were installed; the key question is how did these changes improve the transportation network and contribute to regional transportation goals.
Other
- Prior to delivering the presentation, the presenter may wish to check on the current status of the FHWA effort to develop and publish performance measures (as required under MAP 21).
Slide 9. MAP 21 and Performance-Based Planning
- MPOs and State DOTs must consider projects and strategies as part of their planning process that promote efficient operations.
- Metropolitan planning processes will use a performance-based approach to transportation decision making.
- Plan will include performance measures, targets, and system performance report.
- TIP will link investment priorities to performance targets in Plan to extent possible.
Notes
Description of the Slide
In addition to its emphasis on performance measures, MAP 21 also requires the transportation planning process to address operations.
Key Points
- One of the requirements is that MPOs and State DOTs must consider projects and strategies that promote efficient operations as part of their planning process.
- Another requirement is that metropolitan planning processes will use a performance-based approach to transportation decision making. We'll discuss this a bit more later on.
Other – Perhaps note how the MPO has incorporated operations into its current planning process.
Slide 10. Increasing Financial Constraints
Decreasing fuel tax revenues going into Trust Fund
- No change in the federal gas tax since 1993
- Predictions that fund will become insolvent soon
- Increased fuel efficiency
- New CAFE standards
- Emerging fleet of electric vehicles and plug-in hybrids pay no fuel tax
MUST DO MORE WITH LESS
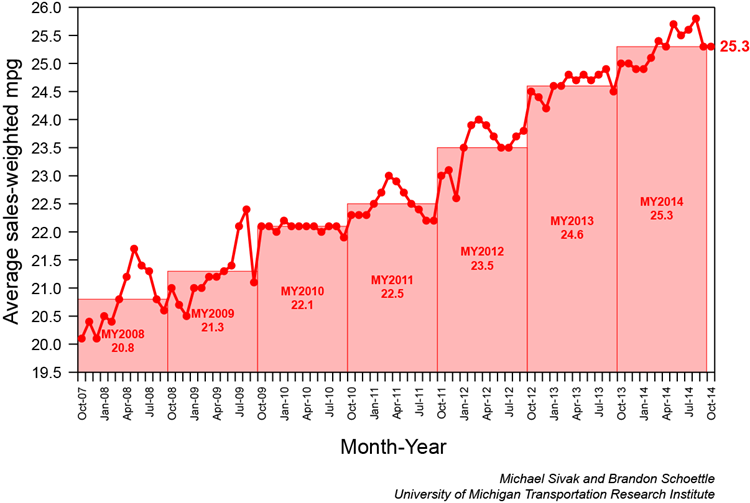
Source: University of Michigan Transportation Research Institute
Notes
Description of the Slide
The need to meet growing customer expectations for mobility and safety, increased accountability, and the associated performance management requirements are all converging at a time of reduced financial resources for most transportation agencies.
Key Points
- The Highway Trust Fund, which was so instrumental in the construction of the Interstate Highway System and other transportation improvements, is running out of money, with current predictions that the transportation fund will become insolvent next year, if not sooner.
- There are several reasons for this:
- The last increase in the federal gas tax was over 20 years ago, and inflation has significantly reduced its purchasing power.
- Cars have become more fuel efficient, and will continue to do so in accordance with current Corporate Average Fuel Economy (CAFE) standards (average 35.5 mpg in 2016; average 54.4 mpg in 2025). This means less tax is paid per miles driven, with all-electric vehicles paying no gas tax at all.
- Technology allows many of us to be virtual commuters. The recent recession and high gas prices also reduced the amount of driving, further reducing the amount of gas tax taken in.
- Several initiatives are underway to find a long-term solution to the declining gas tax revenues; but for the foreseeable future, many agencies will likely need to do more and satisfy rising customer expectations with less.
Other – It would be worthwhile to determine the state gas tax(es) where the MPO is located, the history of increases, and any initiatives underway to provide a more sustainable funding mechanism. See http://www.api.org/~/media/files/statistics/state-motor-fuel-excise-tax-update-jan-2015.pdf for one resource.
Source of Graph – University of Michigan Transportation Research Institute (http://www.umich.edu/~umtriswt/EDI_sales-weighted-mpg.html).
Slide 11. Operations Can Help Address These Challenges
Leverage Technology
- Preserve and maximize existing capacity
- Enhance safety
- Promote mobility and customer outreach
- Improve reliability for commuters and freight
- Enhance sustainability and livability
- Monitor performance
- Implement quickly at relatively low cost
- Help achieve regional goals
Notes
Description of the Slide
Given the many challenges facing transportation agencies – increased customer expectations and accountability, financial constraints, and the limitations on the provision of significant new capacity – it is increasingly important to leverage technology and operate the existing network to its fullest service potential. A robust transportation systems management and operations program can help transportation agencies within the region address all of these challenges.
Key Points
- A major selling point for an increased emphasis on operations is that these strategies and supporting ITS technologies go to the heart of what transportation agencies want and need to deliver today. Operations investments lead to:
- More efficient and effective use of the existing capacity.
- A safer system for travelers and responders to traffic incidents,
- Enhanced customer mobility and outreach via state-of-the-art technologies
- More-reliable service for commuters and shippers, thereby enhancing economic competitiveness.
- A significant contribution to a more sustainable transportation network as well as increased livability within the region
- The same data collected to support operations can also be used as part of a performance management program.
- The benefits from operations can happen more quickly than the process to build new lanes, at a relatively low cost, and with great benefit–cost ratios. Moreover, in many instances operations can provide the opportunity to alleviate bottlenecks without new construction (e.g., ramp metering, hard shoulder running).
- All of these can significantly contribute to achieving regional transportation goals.
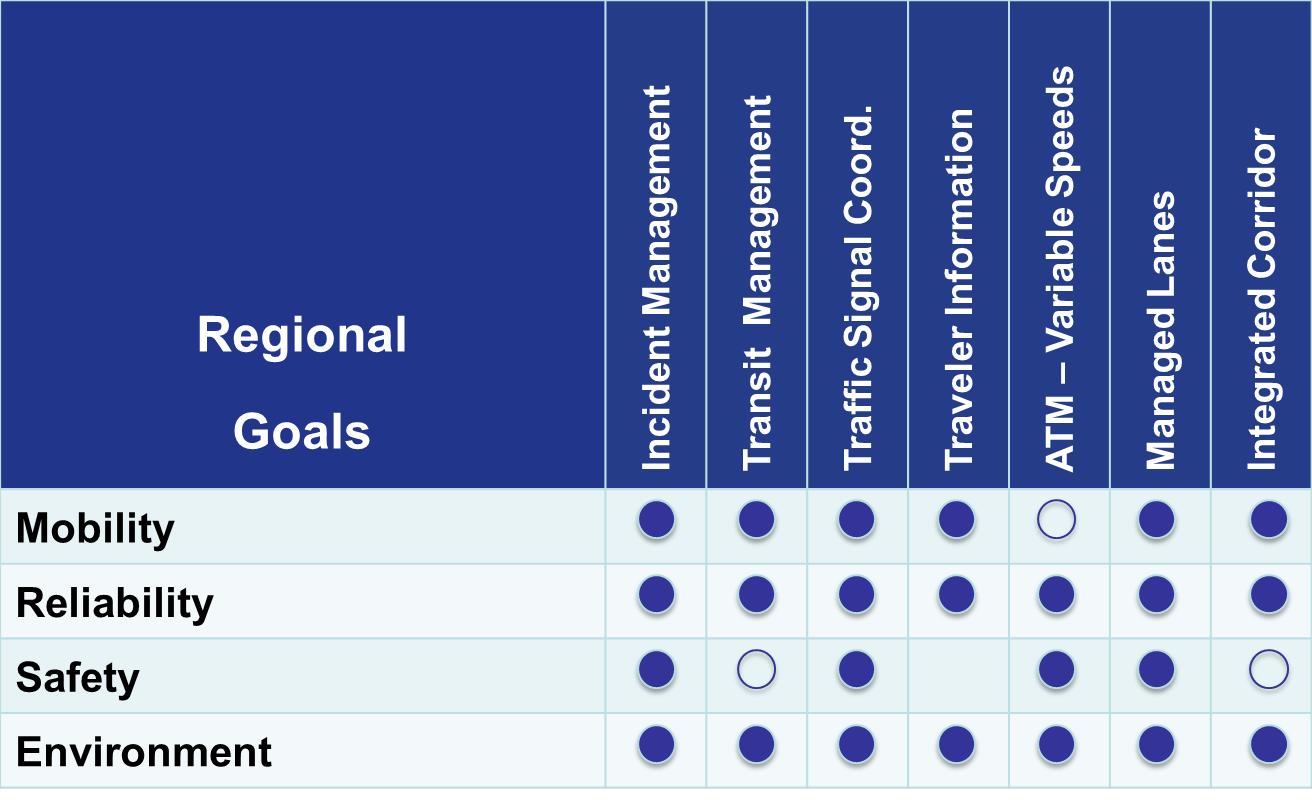
Slide 12. Benefits From Operations
Notes
Description of the Slide
Many regional transportation goals include statements addressing mobility, reliability, safety, and the environment.
Key Points
- The various operations strategies can significantly contribute to the achievement of all of these and other related transportation goals and objectives.
- A filled circle indicates that the specific operations strategy fully contributes to the associated goal, and an open circle indicates a partial (and still positive) contribution.
Other – Perhaps check the regional transportation plan of the MPO where this slide is being presented, and use the exact language vis-á-vis these goals.
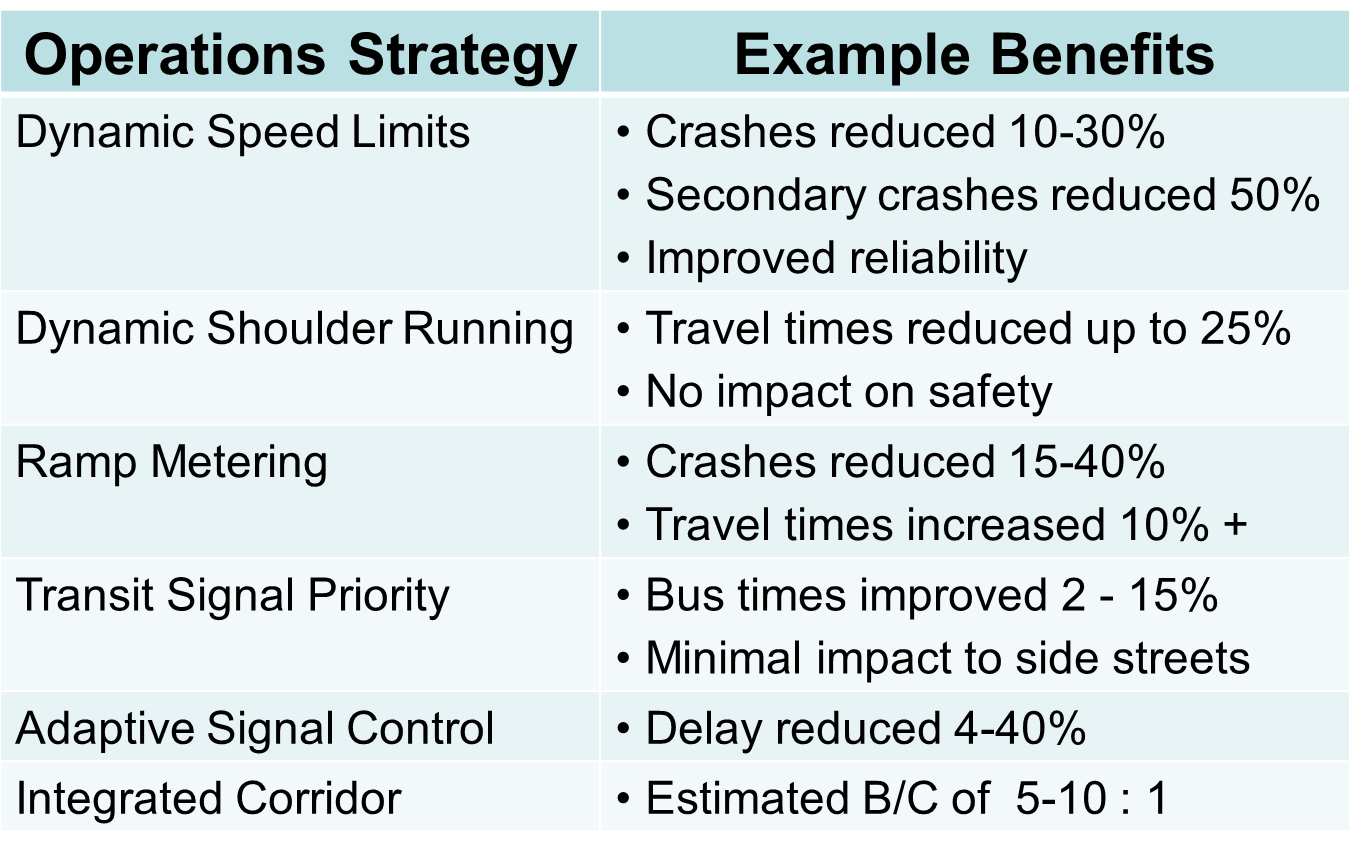
Slide 13. Operations in Support of Mobility and Safety
Notes
Description of the Slide
Examples of benefits resulting from various operations strategies as they relate to m regional mobility and safety goals.
Key Points
- This is just a sample of operations strategies and the associated improvements in mobility (such as reduced delays and improved travel times) and safety. Various operations strategies can significantly contribute to the achievement of all of these and other related transportation goals and objectives.
Other
The companion slide presentation for DOTs includes several slides (#14 - #24) plus a "parking lot" that provide more detailed information and example benefits for several different operational strategies. Depending on the available time and the interest of the audience, the presenter may consider choosing a subset of these strategies to include in the presentation.
Sources of Benefit Information
- Dynamic Speed Limits and Dynamic Shoulder Running: "Active Traffic Management: The Next Step in Congestion Management"; FHWA-PL-07-012; July 2007.
- Dynamic Shoulder Running: "Synthesis of Active Traffic Management Experiences in Europe and the United States"; FHWA-HOP-10-031; May 2010.
- Ramp Metering: "Ramp Management and Control Handbook"; FHWA-HOP-06-001.
Transit Signal Priority: "Active Traffic Management for Arterials – A Synthesis of Highway Practice"; NCHRP 447; 2013.
- Adaptive Signal Control: US DOT Benefits Database (https://www.itskrs.its.dot.gov/benefits); select "Arterial Management" application.
- Integrated Corridor: US DOT Benefits Database (https://www.itskrs.its.dot.gov/benefits); enter "ICM" into keyword for search function
Slide 14. Operations in Support of Sustainability
Promotes the entire "triple bottom line"
- Economic
- Improved mobility and reliability
- Social
- Environmental
- Reduced emissions and GHG
Examples of Environmental Benefits
- Traffic signal control: Emissions reduced 3-22%
- Congestion mitigation strategies (e.g., incident management): CO2 reduced 7-12%
- Variable speed displays: CO2 reduced 10-20%
- Operations and ITS support "eco driving" measures
Notes
Description of the Slide
The most widely quoted definition of "sustainability" is based on the concept of sustainable development as defined by the Brundtland Commission of the United Nations – "Meeting the needs of the present without compromising the ability of future generations to meet their own needs." Or perhaps in sound bite form: "Treating the world as if we intended to stay."
Key Points
- The core of mainstream sustainability thinking has become the idea of three dimensions – environmental, social, and economic sustainability. These three dimensions – which match regional transportation goals – are often referred to as the "triple bottom line." These are also referred to as the three Ps: profit, people and planet.
- The previous slide showed operations benefits as they relate to economic and social sustainability in terms of improved mobility and enhanced safety. Operations strategies can also support environmental sustainability by reducing emissions.
- Several eco-driving measures rely on operations and the supporting ITS technologies, such as "maintain optimum highway speed" (variable speed limits); "ride the green wave" (traffic signal synchronization); and "navigate to reduce carbon dioxide" (enhanced via real-time traveler information).
Sources of Benefit Information
- Barth, M., Boriboonsomsin, K.; "Real-World CO2 Impacts of Traffic Congestion", Transportation Research Record No. 2058, pp 163-171, Transportation Research Board, National Academy of Science, 2008.
- Barth, M., Boriboonsomsin, K., "Energy and Emissions Impacts of a Freeway-Based Dynamic Eco-Driving System"; Transportation Research Board, Part D 14 (2009) 400–410.
Slide 15. Operations in Support of Livability
- Addresses safety
- Helps provide range of transportation choices
- Multi-modal traveler information
- Connecting the modal pieces (ICM)
- Supports fast, frequent, and dependable public transportation
- Enhances the environment
- Reduced emissions including GHG
- Supports travel demand management (TDM) approaches
- Traveler information, managed lanes, and pricing
Notes
Description of the Slide
Livability is related to sustainability, and may be defined as using the quality, location, and type of transportation facilities and available services to help achieve broader community goals, such as increasing travel choices, improving economic competitiveness, and enhancing unique community characteristics.
Key Points
- Operations supports many aspects of livability, including:
- A safer and more secure transportation network;
- Promoting a multi-modal view and providing integrated information on all the possible choices;
- A cleaner environment; and
- Supporting various transportation demand management strategies.
Slide 16. Operations in Support of Climate Adaptation
| Extreme Weather |
Supporting Operations / ITS |
Hot Days (buckling pavements, cars overheating, wildfires) |
- ATM (variable speed limits)
- Incident management
- Work zone management
|
Rising Sea Levels / Storm Surge |
- Traveler information
- Roadway / transit diversions
|
Increased number / intensity of precipitation events |
- ATM (variable speed limits)
- Incident management
|
Increased Hurricane and Super Storm Frequency |
- Contra-flow operations
- Ramp management / closures
- Integrated Corridor Management along evacuation routes
|
Resiliency Operations Critical Before and After Weather Event
Notes
Description of the Slide
A related consideration to environmental sustainability is that of adaptation. There is no need to get into a debate regarding climate change, or its potential causes; but there can be no doubt that severe weather events are becoming more frequent, and they can have a significant regional impact.
Key Points
- Operations and the supporting ITS technologies can help the transportation network adapt to the impacts of severe weather events and enhance its resiliency.
- This is a list of potential extreme weather events, and the role operations can play, such as traveler information, incident management activities, reduced speed limits, and contra-flow operations.
- Moreover, not only do these operations strategies play an important role prior to a severe weather event (e.g., accommodating evacuations and planned closures); but there are also considerations for after the event when parts of the transportation network may still be closed and when travelers want to get back to their normal routine (e.g., return home, go to work) as soon as possible.
Other – Perhaps check recent extreme weather in the specific region where the presentation is being made, and focus on those location-specific events.
Sources of Information on Slide
- Radow, L. and Neudorff, L; "Transportation Adaptation's Bearing on Planning, Systems Management, Operations, and Emergency Response"; TRB Circular E-C152: "Adapting Transportation to the Impacts of Climate Change"; June 2011.
- Transportation Research Board, "Potential Impacts of Climate Change on U. S. Transportation," Special Report 290, 2008.
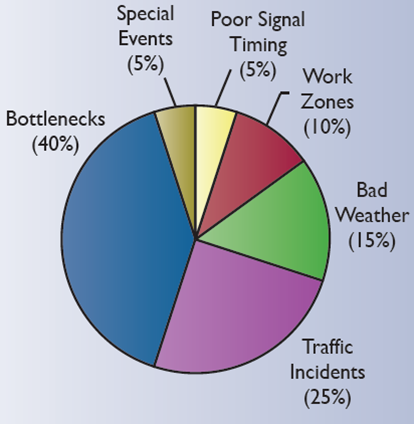
Slide 17. Traditional Approach to Managing Transportation
- Predict future (long range) traffic volumes
- Fund major capital projects to provide additional capacity
This only addresses 40% of the congestion problem.
- Also becoming more and more difficult to provide new capacity
Causes of Congestion
(Source: FHWA)
Notes
Description of the Slide
Historically, the transportation planning process has focused on relieving the causes of recurring congestion, such as bottlenecks and other capacity constraints. In large metropolitan areas, however, more than half of the total delay, and most of system unreliability, results from disruptions and incidents– what is referred to as non-recurring congestion – which is not substantially dealt with by adding new capacity.
Key Points
- The relationships among types and causes of congestion and mobility may not be widely appreciated.
- The traditional approach of adding capacity to meet current and future demands only addresses part of today's mobility, reliability and safety issues.
- Most congestion and delays are the result of "non-recurrent" causes as shown, such as crashes, weather, and construction activities – events that additional capacity does not directly address.
- Additionally, it is becoming more difficult to provide new capacity given current financial constraints and environmental concerns.
- It is therefore important to change the way we plan for, fund, and manage the surface transportation network.
Source of Information in Graph
Slide 18. Providing Effective, Safe and Reliable Transportation
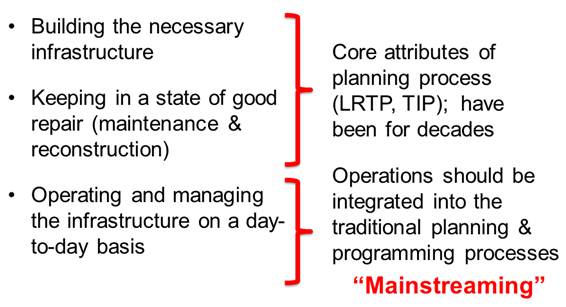
New construction will continue to be important. But we can't build our way out of congestion!
Notes
Description of the Slide
Providing a safe and reliable transportation network may be likened to a three-legged stool, with each leg representing the functions of building the necessary infrastructure, preserving that infrastructure through maintenance and reconstruction, and operating and managing it on a daily basis so the available capacity can be utilized to its fullest extent. The transportation network cannot effectively serve customer needs if any of these three legs is missing or is underemphasized (i.e., too short) relative to the others.
Key Points
- There is no doubt that adding physical capacity to our transportation infrastructure through basic construction projects, and then keeping this infrastructure in a state of good repair, will remain significant missions for transportation agencies. But we can't build our way out of congestion. Moreover, the traditional process does not fully address non-recurring congestion and the associated reliability issues.
- Operations strategies and the supporting ITS technologies must therefore become a formal core program with the same emphasis in the planning and programming processes as the other two.
- In other words, operations must be mainstreamed into the regional transportation planning process.
Other – It might be worthwhile to mention, if appropriate, that the SHRP2 effort has developed:
- Products to improve the quality of decision making and shorten project delivery time for new construction.
- Technologies and institutional solutions to support systematic rehabilitation of highway infrastructure in a way that is rapid, presents minimal disruption to users, and results in long-lasting facilities.
Slide 19. Mainstreaming Operations
"Planning for Operations" – a joint effort between planners & operators to merge operations into traditional planning and programming
- Develop and program operations strategies based on regional goals, objectives and performance measures.
- Enhance the process so that operations investments are on par with construction and preservation funding.
- Help meet requirements of MAP 21 (i.e., "promote efficient operations").

Notes
Description of the Slide
FHWA and the SHRP2 research efforts have focused significant attention on how to mainstream operations within an individual agency as well as the regional transportation planning process. One of these efforts, promoted by FHWA, is known as "planning for operations" – a joint effort between planners and operators to support improved regional transportation system management and operations.
Traditionally, transportation planning and transportation system operations have been largely separate, independent activities.
- Planners focused on long-range transportation investments, including development of metropolitan transportation plans and programming of projects.
- Operators concerned with addressing immediate system needs—incident response, traffic control, traveler information, and work zone management.
Key Points
- Planning for operations connects these two vital components of transportation, and mainstreams operations considerations into the planning process, including the integration of operations strategies into the metropolitan transportation investment and funding plans.
- It requires coordination and collaboration between a number of regional partners, including planning staff and operations staff, from metropolitan planning organizations (MPOs), State DOTs, transit agencies, and local governments.
- It involves developing and programming operations strategies based on regional goals, objectives, and performance measures.
- Such an approach also helps meet the requirements of MAP 21.
Other – Perhaps address how the MPO is already mainstreaming operations into their specific planning process.
Slide 20. Key Attributes of Planning for Operations
"Objectives – Driven Performance Based Approach"
- Multi-modal collaboration between agencies and jurisdictions, and between planners and operators
- Focus on regional goals, objectives and specific outcomes
- Not just implement a project or solve a location-specific problem.
- Prioritize investments to achieve operations objectives and improve transportation system performance
- Include operations strategies and supporting technologies in Transportation Plans and TIP
- Demonstrate accountability through performance measures
Notes
Description of the Slide
The approach to planning for operations is objectives-driven and performance-based, rather than an individual project focus.
Key Points
Key attributes of such an objectives-drive performance based approach include:
- Operators and planners from all transportation agencies working together to develop and address short-term and long-term system operations and reliability objectives.
- Focusing on operational objectives that are tied to the regional goals, and then using outcome-based performance measures and targets as a basis for identifying solutions and prioritizing investment strategies to achieve the operational objectives.
- Integrating these operations-based solutions and investments into the congestion management plan, the TIP and other planning documents.
- Demonstrating accomplishments and accountability based on performance measures and metrics. This corresponds to the maxim that "what gets measured gets managed."
- The process recognizes that performance measurement can focus the attention of decision makers, practitioners, and the public on important characteristics of the transportation system.
Slide 21. Objectives – Driven Performance-Based Approach
Notes
Description of the Slide
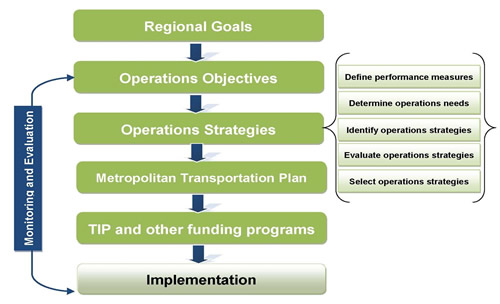
This shows the process for an objectives-driven, performance-based approach.
Key Points
- Regional goals form the basis for developing operational objectives.
- A systematic process is used for developing and selecting operations strategies based on needs (as can be identified from the Congestion Management Plan), performance measures, and an evaluation of the candidate strategies.
- The selected operations strategies are included in the Metropolitan Transportation Plans and TIP.
- This leads to the implementation of the operations strategies and supporting technologies and staffing. Implementation is a crucial part of achieving the objectives.
Other – If the previous slide (# 20) is not used in a shortened presentation, some of the Key Points from slide # 20 should be addressed with this slide.
Source of Graphic
- "Advancing Metropolitan Planning for Operations: The Building Blocks of a Model Transportation Plan Incorporating Operations – A Desk Reference"; FHWA-HOP-10-027 April 2010; (with some modification).
Slide 22. SMART Operations Objectives
Operations objectives are developed through collaboration with a broad range of regional participants and reflect regional values.
Specific. Sufficient to guide approaches.
Measurable. Quantitative/qualitative measurement.
Agreed. Consensus among partners.
Realistic. Can be accomplished with available resources.
Time-Bound. Identified time-frame for accomplishment.
Associated performance measures are outcome – based.
Notes
Description of the Slide
By definition, regional goals are broad statements. For this process to work, the associated objectives need to be tied to specific statements. Such objectives can be thought of as "SMART."
Key Points
- The term "SMART" is an easy way to reference the characteristics of operations objectives.
- They should be specific, measurable, agreed upon, realistic, and time-bound.
- Being measurable, SMART objectives lend themselves to the development of outcome-based performance measures
Other – Perhaps include examples SMART objectives as used by the specific MPO, or another near-by MPO as appropriate.
Slide 23. Summary
- Operations is a critical component for managing the transportation network on a daily basis.
- Enhances mobility, reliability, safety, and environment;
- Provides a sustainable transportation network;
- Supports a performance-based approach, focusing on outcomes; and,
- Achieves quick and cost-effective implementation.
- To be successful, operations needs to be "mainstreamed" into the regional planning and programming processes and documentation
You have an important role to play.
Notes
Description of the Slide
This slide summarizes the key points from the previous slides and discussions.
Key Points
- Operations is a critical component for actively managing the transportation network on a daily basis, providing several benefits to the region and the member transportation agencies. It:
- Enhances mobility, reliability, safety, and the environment;
- Promotes a sustainable and livable transportation network;
- Provides customer service via a performance-based approach; and'
- Achieves quick and cost-effective implementation (with large benefit – cost ratios).
- To be successful, operations needs to be "mainstreamed" into the transportation planning and programming processes at the regional and agency levels.
- Such change and mainstreaming cannot be achieved without your enthusiasm, leadership, and support.
Slide 24. Help Mainstream Operations into the Planning Process
Notes
Description of the Slide
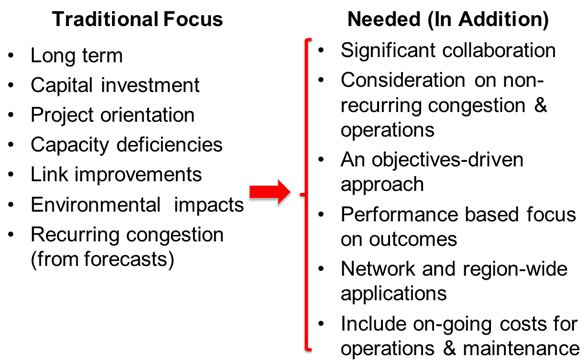
Mainstreaming operations reflects a significant shift from the previous project-focused and capital investment planning process -- a process that does not account significantly for the role of technology and operations solutions.
Key Points
The existing process needs to be enhanced to include:
- More collaboration between planners and operators.
- Implementing an objectives-driven, performance-based approach.
- Using established system performance measures rather than simply focusing on implementation of projects as a measure of success.
- Focusing on both short-term and long-term system performance, including funding for the on-going costs associated with a robust operations program.
Other – If previous slide # 23 is not used in a shortened version of this presentation, the following key points should also be emphasized:
- To be successful, operations needs to be "mainstreamed" into the transportation planning and programming processes at the regional and agency levels.
- Such change and mainstreaming cannot be achieved without your enthusiasm, leadership, and support.
Slide 25. A New Source of Information on TSM&O
National Operations Center of Excellence
- Partnership of AASHTO, ITE, and ITS America with support from the FHWA
- Offers a document library, peer exchanges, webinars, on-call assistance, assessments, and other TSM&O support via the Operations Technical Services Program.
- A place to share information as well as receive it
- www.transportationops.org

Notes
Description of the Slide
Provides information on the recently created National Operations Center of Excellence.
Key Points
- A good place for your staff to get engaged in TSM&O and with others around the county. The Center and this website are designed to actively support the transportation systems management and operations (TSM&O) community. The goal is to provide this community with the tools to fulfill their mission of enhancing safety and reducing congestion. This web portal is being established for practitioners, researchers, and policymakers to provide convenient access to key knowledge resources and the opportunity to discuss topics related to their field.
- The related NOCoE Operations Technical Services Program is also under development. Once launched this spring, the new OTSP will offer an array of technical services such as peer exchange workshops and webinars, ongoing assessments of best practices in the field, and on-call assistance.
Slide 26. Next Steps
- Demonstrate commitment and involvement — today's issues require regional approaches
- Support the mainstreaming of operations
- Develop a Regional Operations Plan and objectives
- Integrate operations into the CMP and TIP
- Empower the people in your respective agencies who can make it happen and give them the resources they need.
If you need assistance — Contact:
Notes
Description of the Slide
As an executive of an MPO or of a member agency, the ball is in your court.
Key Points
- Demonstrate your own commitment. Get engaged and develop champions within your respective organizations, and provide them with the necessary resources to help make this happen.
- Support efforts to mainstream operations into the regional transportation planning process, as well as the planning processes of individual agencies.
- Empower the people in your respective organizations who you will rely on for results.
- Feel free to contact FHWA or AASHTO at any time if you have any questions or need additional assistance.
Other – The specific names and contact information for FHWA may be changed or additional names listed depending on the DOT / agency for whom the presentation is being given.
Slide 27. Questions
Notes
Description of the Slide
- Solicit and respond to questions and comments
Key Points
- Make sure to follow up to any questions that can't be answered immediately, and to requests for any additional information.
Slide 28.
Additional Slides as Appropriate
Notes
This is a "parking lot" for slides providing additional details on selected areas and operations strategies. These may be included in the presentation as indicated in the "Other" notes for previous slides.
Another source for additional slides is the companion slide presentation for DOTs. It includes several slides (#14 - #24) that provide more detailed information and example benefits for specific operational strategies, including:
- Work zone management
- Traffic incident management and service patrols
- Planned special event management
- Road weather management
- Emergency management
- Traffic signal synchronization
- Traveler information
- Ramp management
- Active transportation and demand management
- Connected vehicles
The "parking lot" for the DOT presentation also has strategy / benefit slides for managed lanes, active traffic management, and integrated corridor management.
Depending on the available time and the interest of the audience, the presenter may consider choosing a subset of these strategies to include in the presentation.
Slide 29. What is "Reliability"?
- Consistency or dependability in travel times
- As measured from day to day, or across different times of day.
- Less tolerance for unexpected delays.
- Planning for travel variability has costs for users, including individuals, transit operators, freight and their end users.
Notes
Description of the Slide
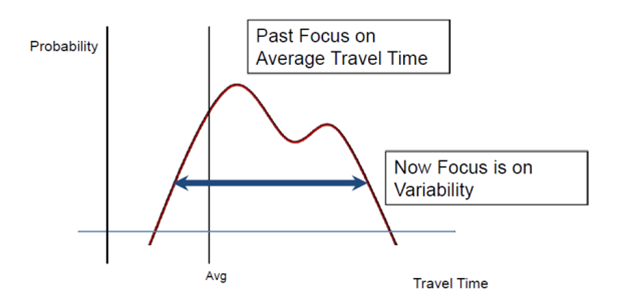
What is meant reliability? Reliability is the ability for travelers and transporters to depend on getting from Point A to B in an expected amount of time. The more reliable a route is, the less tolerance is given for unexpected delays. If we can decrease the opportunities for delay, we can decrease the need to budget for variable travel delays, thereby saving money for travelers, transit operators, freight transporters, and their end users.
Key Points
- Reliability focuses on the consistency of travel times.
- The past focus was on average travel times. Reliability is concerned with the variability of individual travel times from day to day.
- Optimal operations fine tunes travel reliability on the system and reduces amounts of unexpected delays.
- Less need to budget in time and money for "inevitable" travel delays saves money for users and end users.
Slide 30. Transit Management
Example Benefits
- AVL / CAD improved schedule adherence by 9 – 23%
- TSP improved bus travel times by 2 – 15% (minimal impact on side street traffic)
- Automated Vehicle Location (AVL)
- Computer Aided Dispatch (CAD)
- Automatic Passenger Counting (APC)
- Bus Rapid Transit (BRT)
- Transit Signal Priority (TSP)
- Transfer Connection Protection
- Automated Fare Media
Notes
Description of the Slide
Operations strategies and the enabling ITS technologies have provided significant benefits to transit agencies.
Key Points
- Several strategies and technologies exist for improving transit operations and schedule adherence – a measure of transit reliability.
Other – Perhaps provide a local / near-by example of the transit management activities.