Vermont Pilot Program Report
Download the Printable Version [PDF,
2.2 MB]
You will need the Adobe
Acrobat Reader to view this PDF.
Table of Contents
1.0 Executive Summary
Following the enactment of Public Law 111-117 (P.L. 111-117), Vermont raised truck size and weight limits on its Interstate highways for a 1-year period beginning December 16, 2009. Several heavier truck configurations that were previously limited to Vermont State highways, including a 6-axle 99,000-pound gross vehicle weight (GVW) truck, were allowed on the Interstate System during that period. As required by P.L. 111-117, the U.S. Department of Transportation (DOT) conducted a study to examine the effects of the heavier trucks on Interstate highways in Vermont during the Pilot period.
Study Approach
A team comprised of the Federal Highway Administration (FHWA), the Federal Motor Carrier Safety Administration (FMCSA), the Vermont Agency of Transportation (VTrans), and other transportation experts developed a methodology to analyze the Pilot truck impacts and prepare this report to Congress. The study looked at the impacts on the vehicle fleet, truck volumes, highway safety, commerce, pavements, bridges, and energy consumption.
To measure the changes during the Pilot period, the study estimated traffic and infrastructure impacts and energy consumption and compared them to pre-Pilot trends (Control case). Safety analysis was based on 1 year of data on crashes and inspections. The VTrans held outreach meetings and conducted a survey of motor carriers, shippers, and other freight stakeholders to corroborate analytical findings and to gain insight on how the Pilot Program affected freight operations.
While the study made the most of available models and data, a 1-year time period is simply insufficient to make any meaningful conclusions relative to the full consequences of a permanent change in vehicle weight restrictions in Vermont, or elsewhere. For example, it is accepted practice that a minimum of 3 years of safety data before and after any changes is necessary to make any conclusions on safety impacts. The pavement and bridge conclusions are based on truck volumes applied to deterministic models rather than observed damage. Pavement and bridge models are well advanced and capable of reliably predicting infrastructure impacts, while empirical measurement of infrastructure effects would require many years of empirical observation. The truck volumes applied to these models, as noted in the Commerce section of this report, reflect temporary changes and may or may not indicate how truck volumes and weights would change if the Pilot were permanent.
Summary of Findings
- Vehicles and Highway Use – Reponses to the Pilot varied by industry and carrier specialization. Some motor carriers reacted to the Pilot by more fully utilizing the capacity of existing equipment on the Interstate, leasing additional higher capacity equipment, adapting existing equipment, or purchasing new equipment. During the Pilot period, truck traffic on Vermont Interstate highways increased by nearly 2 percent while traffic decreased by nearly 2 percent on the non-Interstate highways. Part of the increase in Interstate vehicle miles traveled (VMT) is attributable to a shift of some heavy trucks to the Interstates; however, some of the increase also might be related to changes in the volume and pattern of freight demand in 2010. Among Pilot trucks, single-unit 4-axle trucks (FHWA Class 7) had the highest Interstate VMT growth rate at nearly three times that of the Control case. Since this class represents a relatively small share of total VMT, the total effect remains modest.
- Highway Safety – Safety findings from the Pilot are inconclusive because 1 year of relatively infrequent events such as fatal and injury crashes can be significantly affected by circumstances unrelated to long-term trends. That notwithstanding, the total number of truck crashes on Vermont's Interstate highways increased by 10 percent between 2009 and 2010. (Nationally, truck crashes increased by 4 percent during that time.) Moreover, the number of fatalities involving trucks on Vermont's Interstates increased from 1 in 2009 to 3 in 2010. On Vermont's non-Interstate highways, where significant safety gains were expected with the shift of trucks to Interstates, the number of crashes increased by 24 percent. Interestingly, this unexpected increase occurred when total truck VMT decreased by nearly 2 percent on non-Interstate routes. A minimum of 3 years of data is required to determine whether these changes are temporary aberrations or new safety conditions. An examination of permit, enforcement, and inspection data revealed that Vermont conducted fewer enforcement and inspection activities during 2010. In addition, the rate of out-of-service trucks dropped from 20 percent to under 8 percent of inspected trucks. Nationally, State enforcement personnel inspected 20.3 million trucks in 2010, placing 20 percent of trucks out of service.
- Commerce – The 1-year duration of the Pilot accommodated only short-term operational changes that lacked adequate scale to affect the Vermont economy or the volume of trade with other States. Carriers participating in the Pilot reported savings in operating costs. The Pilot's effect on freight railroads is not clear.
- Pavements – Trucks operating during the Pilot period carried heavier loads over the Vermont Interstate System than under normal (Control case) conditions. The pavement evaluation applied weigh-in-motion (WIM) data and truck VMT estimates to widely accepted pavement damage models to determine the effect of Pilot trucks on pavement life-cycle costs. Based on this evaluation, the higher axle weights of these trucks increased estimated pavement damage on the Vermont Interstate System by approximately 12 percent. This translates into significant increases in both pavement maintenance and repair costs because of the need for more frequent work zones and increased vehicle operating costs due to damaged pavement. A small net reduction in heavy loads carried by non-Interstate highways resulted in a negligible (less than 0.5 percent) decrease in estimated pavement damage on those facilities during the Pilot. Pavement damage attributable to single-unit 4-axle vehicles (FHWA Class 7) increased by 97 percent per VMT. Damage attributed to 6-or-more-axle single trailer combination trucks (FHWA Class 10) increased by 59 percent, and damage from 6-axle multiple trailer combination trucks (FHWA Class 12) rose by 25 percent per vehicle mile. The additional damage from each Class 10 truck is noteworthy because that type of truck accounts for roughly 4 percent of total VMT while the other two Pilot trucks (Class 7 and Class 12) collectively account for less than 2 percent of VMT.
- Bridges – Study results indicate that the Pilot Program had a negligible impact on Interstate bridges in Vermont. All of the analyzed bridges provided adequate capacity to safely support the Pilot loads. However, secondary members of two existing bridges will need strengthening if Pilot loads are allowed in the future. Vermont has typically designed its bridges to higher load standards than national specifications require. As a result, the superstructure components of both existing bridges and future designs that meet current national bridge design standards will have no problem supporting the Pilot loads. Bridge decks and deck wearing surfaces may be affected by heavier loads, but the costs to address these impacts are likely to be small in comparison to overall State highway expenditures. Other bridge components such as deck joints, bearings, piers, and abutments also may be affected, but these impacts cannot be quantified with currently available analytical tools. Long-term infrastructure costs will likely be less than for other States, especially given the relatively small truck volumes on those bridges.
- Energy – The movement of truck VMT from non-Interstate facilities to Interstates resulted in improved operating conditions and reductions in fuel consumption. On a per-mile basis, trucks consumed 15 to 20 percent less fuel on Interstate highways, providing significant savings to motor carriers. On a cumulative basis, the truck Pilot saved between 57,000 and 73,000 gallons of diesel fuel in 2010 assuming no offsets in increased truck activity from reduced shipping costs or from modal shifts.
Most of these findings have little applicability to permanent changes in Vermont's vehicle weight limits or to changes in weight limits in other States for several reasons. The 1-year period was not enough time to encourage truck operators to make investments in new equipment, or to provide reliable data on safety trends. In addition, national and local economies were in an unusual state of flux during the Pilot period, and Vermont is atypical of most States with respect to its size and other characteristics. Furthermore, the lack of detailed data hampered the analysis.
2.0 Introduction
The Consolidated Appropriations Act of 2010 (P.L. 111-117) established a 1-year pilot program that allowed Vermont to apply State commercial vehicle weight laws and regulations on its Interstate highways, except for Interstate 189, which is a 1.488-mile spur off Interstate 89. Under the Pilot Program, trucks with GVW higher than Federal limits were allowed to operate on Vermont's Interstate highways from December 16, 2009, to December 17, 2010.
P.L. 111-117 also directs the Secretary of Transportation to assess the impacts of heavier vehicles on highway safety, bridge and road durability, commerce, truck volumes, and energy use. Since December 2009, experts from the DOT's FHWA and FMCSA have been working with their counterparts from VTrans to study the effects of the Pilot Program.
| Section 194 of the Consolidated Appropriations Act of 2010, enacted December 16, 2009, as P.L. 111-117 (123 Stat. 3072): (d) VERMONT PILOT PROGRAM.-Section 127(a) of title 23, United States Code, is amended by adding at the end the following: "(13) VERMONT PILOT PROGRAM.- (A) IN GENERAL.-With respect to Interstate Routes 89, 91, and 93 in the State of Vermont, laws (including regulations) of that State concerning vehicle weight limitations applicable to State highways other than the Interstate system shall be applicable in lieu of the requirements of this subsection." (e) PERIOD OF EFFECTIVENESS FOR THE VERMONT PILOT PROGRAM.-The amendment made by subsection (d) shall be in effect during the 1-year period beginning on the date of enactment of this Act. (f) REVERSION FOR THE VERMONT PILOT PROGRAM.-Effective as of the date that is 366 days after the date of enactment of this Act, section 127(a) of title 23, United States Code, is amended by striking paragraph (13). (g) REPORT ON THE VERMONT PILOT PROGRAM.-Not later than 2 years after the date of enactment of this paragraph, the Secretary shall complete and submit to Congress a report on the effects of the Pilot program under this paragraph on highway safety, bridge and road durability, commerce, truck volumes, and energy use within the State of Vermont. |
This report presents the findings of DOT's analysis. It discusses:
- Truck Volumes – The change in the vehicle type, weight, and use of Interstate highways.
- Highway Safety – The change in crash rates, type, and severity for the heavier trucks allowed on the Interstates during the 1-year Pilot.
- Commerce – The effects on Vermont business and industry, including changes in competitiveness.
- Road (Pavement) Durability – The effects of heavier trucks on the rate at which pavement damage accumulates.
- Bridge Durability – The potential bridge damage resulting from additional truck weight and whether the heavier truck loads will decrease effective bridge life.
- Energy Use – The change
in energy consumption resulting from shifts to heavier
trucks.
While the report incorporates all available information and the most current engineering and policy analysis methods, many findings cannot be generalized beyond the place or time of the Pilot. Noteworthy limitations include the following: - One-Year Pilot Period – Many motor carriers did not invest in the equipment needed to carry heavier loads on the Interstate System because the equipment could not be utilized fully at the end of the Pilot. A longer term or permanent change in weight limits is likely to result in a much greater market response. In addition, safety findings from the Pilot are inconclusive because 1 year of relatively infrequent events such as fatal and injury crashes can be significantly affected by circumstances unrelated to long-term trends.
- Economic Conditions – The Pilot period was also atypical for growth in freight movement. Decades of steady growth through 2007 were followed by major decline in 2008 and 2009, with only a modest recovery in the Pilot year of 2010. The market for freight transportation was suppressed in 2010 compared to average years.
- Geographic Characteristics – Vermont is not representative of most States. Vermont is small in area and has one of the smallest populations and economies in the country. Its State highway system is largely comprised of two-lane highways that pass through traditional town centers and villages. There are few opportunities for trucks to detour around Vermont's historic towns while, in many other States, town bypasses are a common feature of the State highway systems. Vermont highways also carry the smallest tonnage of goods of any State, and that tonnage has declined as a consequence of national economic conditions.
- Data Availability – Because of Vermont's small size, geographically detailed data is required to identify changes in freight transportation demand. Even with special efforts made during the course of the study, available data lacked adequate detail for many of the desired analyses in the time provided.
3.0 Background
The Federal Government started regulating the size and weight of commercial vehicles in the 1950s to protect its investment in the Interstate System. The Federal-Aid Highway Act of 1956 set axle limits at 18,000 pounds for single axles and 32,000 pounds for tandem axles (a set of two closely spaced axles) up to a maximum GVW of 73,280 pounds. The Federal-Aid Highway Amendments of 1974 raised weight limits to their current standard of 80,000 pounds GVW with 20,000 pounds for single axles and 34,000 pounds for tandem axles. The 1974 law also required vehicles to comply with Federal Bridge Formula that places weight limits on axle groups for different distances between axles. Federal weight limits apply to the Interstate System, except in States that are covered by grandfather provisions. They do not apply to State highways that are not on the Interstate System.
Vermont has a grandfather provision allowing the State to issue permits for hauling unprocessed milk up to a maximum gross weight of 90,000 pounds on a 5-axle tractor-semitrailer combination or 5-axle truck-trailer combination on its Interstate highways. The State also allows several vehicle types that exceed Federal weight limits on highways off the Interstate System where Federal limits do not apply. Heavier vehicles include a 6-axle, tractor semi-trailer combination truck that weighs up to 99,000 pounds GVW.
Shortly after passage of P.L. 111-117, Vermont passed State law S.93, which allowed all State truck size and weight limits onto Interstate highways with no commodity limitations. This included 3-axle trucks with a 55,000-pound GVW; 4-axle trucks with a 69,000-pound GVW; 5 axle trucks with a 90,000-pound GVW; and 6-axle trucks with a 99,000-pound GVW.
The consequences of these regulatory changes are limited by the short duration of the Pilot Program and the relatively small size of Vermont. According to the 2010 Census, Vermont had 625,741 residents, up 2.8 percent since 2000. The 2007 Economic Census identified 21,361 employer establishments and 59,436 non-employer establishments in Vermont. Its population and economy are spread over 9,614 square miles.
Vermont's economy is dependent on service and manufacturing industries. The service sector accounts for over 80 percent of Vermont's Gross State Product (GSP) and non-farm employment. Manufacturing provides more than 10 percent of GSP and non-farm employment. The industries best positioned to take advantage of the Pilot – construction, mining and logging – together account for less than 6 percent of Vermont's GSP and non-farm employment.
Like the rest of the country, Vermont experienced declines in major industry activity during the recession. The rate at which each sector recovered from the recession affected the "typical" freight traffic mix in Vermont, making the Control Case against which Pilot impacts were assessed difficult to determine.
Table 3.1 shows two economic indicators (Employment and GSP) for the years leading up to and including the Pilot. Each indicator is indexed to a 2008 base year. The employment index shows a general decline in economic activity over the 6-year period, with the exception of service industries, which remained essentially flat. The construction, mining, and logging industries each experienced employment declines of over 10 percent from the 2008 base year to 2010.
| Industry Segment | Employment Index (2008=100) | GSP Index (2008=100 in nominal dollars) | ||||||||||
|---|---|---|---|---|---|---|---|---|---|---|---|---|
| 2005 | 2006 | 2007 | 2008 | 2009 | 2010 | 2005 | 2006 | 2007 | 2008 | 2009 | 2010 | |
| Manufacturing | 105 | 103 | 102 | 100 | 89 | 88 | 97 | 105 | 93 | 100 | 91 | 99 |
| Construction | 108 | 112 | 108 | 100 | 88 | 86 | 108 | 112 | 107 | 100 | 90 | 93 |
| Mining and Logging* | 100 | 106 | 100 | 100 | 94 | 88 | 154 | 124 | 83 | 100 | 129 | 149 |
| Service Industries | 98 | 99 | 100 | 100 | 98 | 99 | 90 | 94 | 98 | 100 | 102 | 106 |
| * Employment Index includes mining and logging; GSP Index includes mining only. | ||||||||||||
The GSP index is less consistent in terms of a discernible trend than employment, with the service industries index showing a consistent increase while the employment index for this sector remains flat. This may be explained in part by the fact that GSP is stated in nominal dollars. The GSP indices for manufacturing and construction roughly follow employment indices. The mining and logging sector shows a divergence in direction after 2008, with employment going down and GSP going up. This is due in some part to the fact that employment data combine mining and logging and GSP data include forestry with agriculture and fisheries, making the two series not directly comparable. Despite this difference in definition, the GSP index shows that mining's share of economic activity increased during 2009 and 2010.
The Vermont economy generated and attracted over 41.3 million tons of goods in 2010, of which 38.3 million tons moved by truck. All commodities moving to, from, and within Vermont were valued at $38.5 billion in 2010. Commodities moving by truck accounted for $32.8 billion of that value. Table 3-2 lists the top 15 commodities by tons of goods moved by truck to, from, and within Vermont in 2010.
| SCTG Code | Standard Classification of Transported Goods (SCTG) Description | Tons (thousands) |
|---|---|---|
| 12 | Gravel | 3,915.80 |
| 31 | Nonmetal mineral products | 3,789.20 |
| 17 | Gasoline | 2,686.50 |
| 32 | Base metals | 2,649.20 |
| 13 | Nonmetallic minerals | 2,464.50 |
| 2 | Cereal grains | 2,456.80 |
| 3 | Other agricultural products | 1,942.20 |
| 41 | Waste/scrap | 1,922.90 |
| 25 | Logs | 1,808.00 |
| 19 | Natural gas & asphalt | 1,714.7 |
| 26 | Wood products | 1,670.50 |
| 4 | Animal feed | 1,636.80 |
| 7 | Other foodstuffs | 1,416.90 |
| 18 | Fuel oils | 1,191.70 |
| 43 | Mixed freight | 1,149.50 |
Vermont's tonnage and value of goods seem large until compared with national totals. The Nation moves more tonnage and value each day than Vermont moves in a year. The U.S. transportation system moved, on average, 51 million tons worth $45 billion each day in 2007, which proved to be a peak after years of growth. National tonnage decreased 2.4 percent in 2008 and an additional 11.1 percent in 2009, followed by very modest growth in 2010. Vermont is part of this national picture, with total tonnage down 7 percent and tonnage by truck down 4 percent between 2007 and 2010. Value in 2007 dollars dropped even more: 21 percent for all commodities and 14 percent for commodities moved by truck to, from, and within Vermont between 2007 and 2010.
Vermont has 14,436 miles of public roads, of which 280 miles are Interstate highways in rural areas and 40 miles are Interstate highways in urban areas. Interstate 89 connects Canada at the northwestern corner of the State with Burlington (Vermont's biggest city), Montpelier (Vermont's capital), and Boston via New Hampshire. Interstate 91 connects Canada with the cities of western Massachusetts and central Connecticut through the eastern edge of Vermont. Interstate 93 provides an alternate route to Boston from northeastern Vermont through central New Hampshire. Of the roads in Vermont not on the Interstate System, 20 miles are other freeways and expressways and 423 miles are other principal arterials. There are no Interstate highways in the southwest quadrant of Vermont, which is responsible for a significant portion of the State's economic activity and has large population centers such as Rutland and Bennington.
4.0 Study Approach
The main objectives of this study are to identify changes in vehicle use, safety, commerce, pavement and bridge condition, and energy consumption during the Vermont Pilot, and to identify where possible how much of the change can be attributed to the Pilot. This study is based on information from focus group meetings and surveys of shippers and carriers conducted by VTrans, an investigation of safety conditions, and comparisons of impacts directly related to vehicle use for two estimates of vehicle use:
- Pilot estimates based on information collected during 2010 by VTrans, the Vermont Division of Motor Vehicles (DMV), and the DOT.
- Control estimates of likely 2010 conditions if the Pilot Program had not been implemented.
Control estimates are averages of pre-Pilot traffic data from 2006 to 2009. While the Control estimates are a plausible alternative from which comparisons can be drawn, they do not capture fully the effects of intervening variables during 2010, such as fluctuations in economic conditions, fuel prices, labor availability, weather, road repair work, and regulatory changes.
A variety of data sources were used to investigate the issues, changes, and concerns identified in Table 4-1. Population and economic statistics are derived from the Census Bureau and the Bureau of Economic Analysis. Commodity flows are based on version 3.1.2 of FHWA's Freight Analysis Framework and Freight Facts and Figures 2010. Road mileage is from table HM-20 of DOT's Highway Statistics 2009. Vehicle, bridge, pavement, and safety data were extracted from FHWA's Highway Performance Monitoring System and from data specifically provided by VTrans and Vermont DMV for this study.
| Impact | Issue | Evaluation Method | Private Sector Changes | Public Sector Concerns |
|---|---|---|---|---|
| Truck Volumes | Change in the vehicle fleet and use of Vermont highways during the Pilot | Conversion information from outreach; permit summary from VT DMV; traffic counts and vehicle classifications; weigh-in-motion data for the pre and Pilot period | Trucks converted, purchased, leased; anecdotal information on industry adaptation; vehicle counts and VMT estimates by highway | Equipment inspection, certification, permitting |
| Highway Safety | Change in highway safety performance during Pilot | Analysis of crash data for the pre and Pilot period | Safety measures, technology, other actions | Crash implications, inspection, enforcement |
| Commerce | Change in travel time, reliability, cost, industry productivity, competitiveness, jobs | Carrier outreach; shipper / carrier outreach and analysis of available economic data | Service performance (travel time reliability, cost), transport costs, business revenue, jobs | Modal diversion, State economy |
| Pavement Durability | Change in the rate of pavement damage | Pavement analysis | Motor carrier cost responsibility, in general terms | Pavement wear, replacement agency cost; traffic disruptions during construction or maintenance |
| Bridge Durability | Change in bridge wear, life, etc. | Bridge fatigue evaluation | Motor carrier cost responsibility, in general terms | Bridge loadings, fatigue, deck wear, replacement, agency cost; traffic disruptions during construction or maintenance |
| Energy | Effect on energy use | VMT estimates | Fuel consumption | Emissions |
5.0 Truck Volumes
5.1 Changes in the Vehicle Fleet
To identify the changes in the vehicle fleet, data collected by the Vermont DMV were analyzed and discussed with motor carriers and shippers. Interstate highway use permits issued to Pilot trucks during 2010 also were obtained from the Vermont DMV. The permit data provided some insight into the types of shifts that occurred between truck types.
Table 5-1 presents the FHWA Vehicle Classifications. Table 5-2 provides detail on the four FHWA Vehicle Classifications that are the focus of this study.
| FHWA Vehicle Classification | Definition |
|---|---|
| 1 | Motorcycles |
| 2 | Passenger Cars |
| 3 | Other 2-axle, 4-tire single-unit vehicles |
| 4 | Buses |
| 5 | 2-axle, 6-tire, single-unit trucks |
| 6 | 4-axle single-unit trucks |
| 7 | 4-or-more-axle single-unit trucks |
| 8 | 4-or-fewer-axle single-trailer trucks |
| 9 | 5-axle single-trailer trucks |
| 10 | 6-or-more-axle single-trailer trucks |
| 11 | 5-axle multi-trailer trucks |
| 12 | 6-axle multi-trailer trucks |
| 13 | 7-or-more-axle multi-trailer trucks |
| FHWA Vehicle Classification Type | Name | Description | Observed Axle Length (First to Last Axle) | Registered Weight / Permitted Weight |
|---|---|---|---|---|
| Class 6 | 3-Axle Single-Unit | 3-axle trucks with rear tandem axle. Rear axles are powered and braked. | 21' | 55,000 lbs. / 60,000 lbs. |
| Class 6 | 3-Axle Single-Unit Dump Truck | 3-axle trucks with rear tandem axle. Rear axles are powered and braked. Varying axle distances. | 18' to 26' | 55,000 lbs. / 60,000 lbs. |
| Class 7 | 4-Axle Single-Unit | 4-axle trucks with rear tri-axle; at least two of these axles powered and braked. | 21' to 24' | 60,000 lbs. / 69,000 lbs. |
| Class 7 | 4-Axle Single-Unit | 4-axle trucks with rear tri-axle; at least two of these axles powered and braked. | 28' | 60,000 lbs. / 69,000 lbs. |
| Class 9 | 5-Axle Tractor Semi-Trailer | 5-axle tractor/semi-trailer with standard fifth wheel hook up and truck/semi-trailer generally connected with a pintle hook. | 52' to 63' (51'*) |
80,000 lbs. / 90,000 lbs. |
| Class 10 | 6-Axle Tractor Semi-Trailer | 6-axle tractor/semi-trailer with standard fifth wheel hook up and truck/semi-trailer generally connected with a pintle hook. | Generally less than 51' (43'*) |
80,000 lbs. / 90,000 lbs. |
| Class 10 | 7-Axle Tractor Semi-Trailer | 7-axle tractor/semi-trailer with standard fifth wheel hook up and truck/semi-trailer generally connected with a pintle hook. | Generally less than 51' (43'*) |
80,000 lbs. / 90,000 lbs. |
| Class 10 | 6-Axle Tractor-Semi-Trailer | 6-or-more-axle tractor/semi-trailer with standard fifth wheel hook up and truck semi-trailer generally connected with a pintle hook. | 51' to 62' (51'*) |
80,000 lbs. / 99,000 lbs. |
| * Minimum axle spacing as per statute. | ||||
Private motor carriers made modest adjustments to their truck fleet to utilize more productive equipment during the 1-year Pilot. According to surveys and outreach meetings conducted with carriers and shippers, the trucking industry adjusted the fleet by: using existing higher capacity equipment previously limited to the secondary system on the Interstate System; utilizing more fully the capacity of existing equipment on the Interstate; leasing additional higher-capacity equipment; adapting existing equipment; purchasing new equipment; or a combination of these adjustments.
Vehicle fleet adjustments varied by industry and carrier specialization. Many carriers did not acquire new or additional equipment but, instead, loaded existing trailers more fully to take advantage of existing capacity. For example, the petroleum distribution industry was able to more fully load existing tank trailers.
Some carriers obtained additional power units and trailers to haul existing cargo more efficiently. The vehicles were acquired to allow carriers to accommodate the heavier Pilot weights.
Very few carriers purchased new equipment for the Pilot. Instead, carriers obtained Pilot-appropriate equipment through short-term lease agreements to hedge against the temporary nature of the Pilot. Carriers with multistate operations, especially in States with higher weight limits, shifted some equipment in order to meet the Vermont Pilot Program specifications.
A relatively small number of carriers adapted equipment, including the addition of trailer axles (to form a tridem axle grouping) to meet specifications for the 99,000-pound 6-axle configuration.
If weight limits were permanently lifted, carriers indicated that they would purchase additional or more productive equipment within the first few years in order to take better advantage of the higher allowable weights.
The Vermont DMV tracked some of the changes to the fleet through its permit system. Permit records show a decrease in the total number of permits issued during the Pilot period from about 43,000 total annual permits to approximately 30,000 annual permits. Moreover, permits for 99,000-pound 6-axle trucks increased from 1,500 in 2009 to more than 3,000 in 2010.
5.2 Changes in Highway Use
Before the Pilot Program was initiated, it was expected that truck traffic would divert from the Vermont State highways and local roads to Interstate highways to take advantage of higher speeds and more direct routing. Additionally, it was anticipated that truck tonnage would shift to fewer loads, thereby reducing the total number of trucks utilizing the entire highway system, but increasing average truck weight.
In order to measure the change in truck volumes on Vermont's Interstates and local roads, data on truck VMT, weigh-in-motion (WIM) stations, traffic counts, and permits were collected, and interviews were conducted with carriers and shippers. Using these data sources, changes in truck weights, vehicle types, and volumes on Vermont Interstate highways and local roads were then estimated. Key information sources include:
- WIM – Sensors in the roadway detect vehicle axles and weights in a network of stations maintained by VTrans. Data for this study came from five WIM stations on the Interstate, and 11 on the State highway system.
- Traffic Counts – The VTrans also collected automated traffic count information at approximately 100 locations to supplement WIM data. Because automated counting mechanisms are less sensitive to determine axle configurations, they are not as accurate at distinguishing truck classifications but can provide good information on trends and flows of heavier trucks.
- Statewide VMT Data – The VTrans developed truck VMT data for several classes of trucks on different functional classification highways. These data are submitted to FHWA on an annual basis. The 1-year Pilot was expected to produce two types of changes on the highway system: the weight that various truck classes carry, and the number of trucks by size and the miles that they travel.
To measure weight changes during the Pilot, the study relied on WIM data. This information was also critical to the pavement and bridge analyses.
To measure truck classifications and VMT, traffic count data and unofficial 2010 Vermont VMT estimates that the State is required to provide to FHWA were used. (The final published 2010 Vermont VMT data were not available in time for use in the study.) Following the analytical approach presented in Section 4, Pilot estimates of truck VMT observed during 2010 were developed. Because Vermont VMT data were provided at an aggregated level for single-unit and combination trucks, a method was developed to estimate specific truck classes using a sample of vehicle classification counts from Vermont's system of automated vehicle count (AVC) stations.
For comparison purposes, the Control estimates of truck VMT that would have occurred in 2010 without the Pilot Program were developed using VMT data from 2006 to 2009. The 2006-2009 VMT data provided a more reliable trend than the 1-year change from 2009 to 2010, which could have been influenced by a slight recovery from the national recession. As for the 2010 Pilot estimates, AVC data were used to divide Control estimates of VMT by vehicle type.
To validate the findings of the data analysis, focus group meetings were held with Vermont carriers, shippers, and railroads. The VTrans also conducted a separate shipper survey for the study.
Table 5-3 summarizes the key findings of the traffic volume analysis, based on the FHWA truck classifications. The table shows single-unit trucks, Classes 5, 6, and 7 and six combination trucks, Classes 8 through 13. It compares 2010 Control results (an estimation of VMT without the Pilot) to 2010 Pilot results (an estimation of VMT with the Pilot), and represents the difference between the 2010 Pilot and the 2010 Control. Table 5-3 also shows percentage change from the Control to the Pilot case. Since the Control case represents what would have happened without the Pilot, VMT for vehicle types not affected by the Pilot is held constant between the Control and Pilot cases.
| FHWA Class | Control (2010) | Pilot (2010) | ||
|---|---|---|---|---|
| Interstate | Non-Interstate | Interstate | Non-Interstate | |
| 5 | 59,130,998 | 244,504,975 | 59,130,998 | 244,504,975 |
| 6 | 10,764,037 | 35,019,797 | 10,764,037 | 35,019,797 |
| 7 | 506,668 | 9,152,425 | 1,998,723 | 6,421,228 |
| 8 | 31,565,492 | 49,450,007 | 29,906,689 | 50,882,889 |
| 9 | 91,450,272 | 56,443,643 | 93,026,429 | 53,286,115 |
| 10 | 8,992,639 | 14,579,984 | 9,235,033 | 13,225,695 |
| 11 | 2,001,974 | 661,972 | 3,309,875 | 625,042 |
| 12 | 528,811 | 794,164 | 1,091,071 | 349,704 |
| 13 | 297,874 | 469,740 | 297,874 | 469,740 |
| Total | 205,238,767 | 411,076,707 | 208,760,729 | 404,785,185 |
| FHWA Class | Change from Control to Pilot | |||
|---|---|---|---|---|
| Interstate | Percent | Non-Interstate | Percent | |
| 5 | - | 0 | - | 0 |
| 6 | - | 0 | - | 0 |
| 7 | 1,492,055 | 294.5 | -2,731,198 | -29.8 |
| 8 | -1,658,802 | -5.3 | 1,432,882 | 2.9 |
| 9 | 1,576,157 | 1.7 | -3,157,527 | -5.6 |
| 10 | 242,394 | 2.7 | -1,354,289 | -9.3 |
| 11 | 1,307,900 | 65.3 | -36,930 | -5.6 |
| 12 | 562,260 | 106.3 | -444,460 | -56 |
| 13 | - | 0 | - | 0 |
| Total | - | 1.7 | - | -1.5 |
As shown in Table 5-3, Interstate truck VMT increased by 1.7 percent during the Pilot period. During that same timeframe, truck VMT on non-Interstate highways decreased by 1.5 percent. While overall truck VMT changes were modest (between 1.5 and 1.7 percent), some truck classes experienced significant changes. However, it is important to consider these changes in the context of total truck VMT. For example, Class 7 truck VMT grew by more than 294 percent on the Interstate System during the Pilot, but the total Class 7 VMT was about 1 percent of the total Pilot VMT. This estimated change, which may be a statistical aberration resulting from the small numbers involved, had only a modest impact overall. Figures 5-1 and 5-2 illustrate the relative composition of truck VMT under Control and Pilot conditions.
Figure 5-1. Summary of Truck VMT: Control 2010
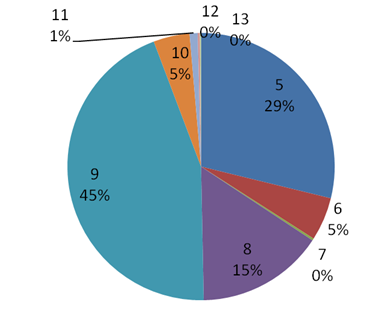
Figure 5-2. Summary of Truck VMT: Pilot 2010
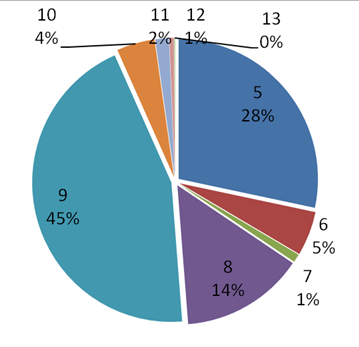
Truck configurations allowed on the Interstates during the Pilot, with the same weights previously allowed on State roads, fall within Classes 6, 7, 9, and 10 (see Table 5-2 for more detail on truck types).
According to feedback at outreach activities, carriers and industries maximized their use of the Interstate System and heavier truck configurations to the extent possible during the Pilot period. Industries that were allowed to operate heavier trucks (by Vermont statute) on non-Interstate highways shifted as many miles as possible to the Interstate System. For example, carriers said they shifted traffic from secondary routes to parallel or nearby Interstates, including a general shift of traffic from US 5 to I-91, from US 2 to I-89, and from US 7 to I-89. Truck movements between New York and Maine could transit Vermont during the Pilot period, but the effect of these longer distance trips is unknown.
This information is consistent with VTrans shipper survey results that show average truck VMT on the Interstate System was approximately 24 percent before the Pilot but increased to an average of 62 percent of total VMT during the Pilot (an average increase of 38 percent). At the same time, shippers reported a 32 percent decrease in VMT on non-Interstate highways during the Pilot. Thus, the Interstate VMT increase and non-Interstate decrease were fairly close in proportion.
6.0 Highway Safety Effects
The Pilot study examined vehicle safety issues associated with heavier trucks, including commercial vehicles operating under Vermont's special excess weight permits and illegally overweight vehicles over several years leading up to and including the 2010 Pilot year. Data were gathered on issues related to commercial truck safety from 2007 through 2010, focusing on comparisons between 2009 and the Pilot year 2010. Also analyzed were crash, inspection, and overweight violation data to determine if the redistribution of heavy truck traffic from State highways to the Interstate System during the Pilot had measurable safety impacts.
As part of the evaluation of the crash, fatality, injury and property damage caused by commercial motor vehicle crashes, the study used Vermont's crash database, which is maintained by the VTrans Highway Research Division. These data included the locations and key attributes (e.g., vehicle configuration, vehicle body type, crash type) of all crashes. The VTrans provided 6 years of crash data so that an analysis of the State's commercial vehicle crashes could be conducted. The study analyzed crashes from 2007 through 2010, in order to be consistent with other elements of the evaluation. Specifically, the following analyses were conducted:
- Changes in the number of fatal commercial-vehicle-involved crashes by road type, 2007-2010;
- Changes in the number of injury-causing commercial-vehicle-involved crashes by road type, 2007-2010; and
- Changes in the number of property damage only commercial-vehicle-involved crashes by road type, 2007-2010.
In addition to the crash data analysis, the study examined commercial motor vehicle overweight permit records and Vermont commercial vehicle enforcement data to identify safety issues and trends during the Pilot Program.
6.1 Crash Data Analysis
Crash data trends are shown in absolute numbers rather than rates per million VMT because VMT estimates for 2010 have not been finalized, and estimates for VMT by commercial motor vehicles are not available. Preliminary data indicate that VMT for all vehicles on all Vermont roads increased 1.15 percent between 2009 and 2010.
There were three fatal crashes involving commercial motor vehicles on Vermont's Interstate highways in 2010, compared to one in 2009, two in 2008, and none in 2007. None of the 2010 crashes involved Pilot vehicles: two were 90,000-pound milk tankers operating under grandfather provisions, and one was an 80,000-pound 5-axle flatbed with logs on a return trip to Quebec. There were four additional fatal crashes involving commercial motor vehicles on other highways in Vermont in 2010, compared to three in each of the preceding 3 years.
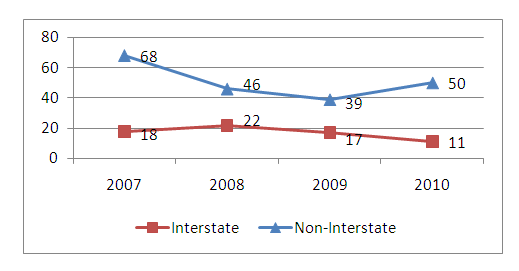
Figure 6-1. Number of Commercial-Motor-Vehicle-Involved
Crashes (ALL) by Road Type in Vermont: 2005-2010
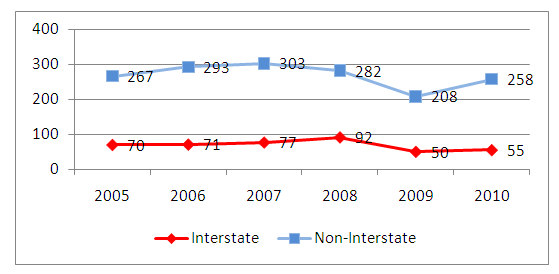
Figure 6-1 shows that all crashes involving commercial motor vehicles on non-Interstate roads in Vermont rose from 208 in 2009 to 258 in 2010, an increase of 24 percent. Interstate crashes increased from 50 crashes in 2009 to 55 crashes in 2010, an increase of 10 percent.
Figure 6-2. Number of Property Damage Crashes
in Vermont Involving a Commercial Motor Vehicle by Road
Type: 2007-2010
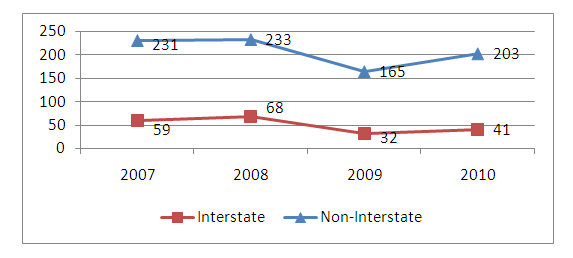
The most common crashes involved property damage. As shown in Figure 6-2, the number of non-Interstate crashes involving property damage rose from 165 to 203 between 2009 and 2010, a 1-year increase of 21 percent. Interstate crashes increased from 2009 to 2010 from 32 crashes to 41 crashes, an increase of 27 percent.
Figure 6-3. Number of Injury Crashes in Vermont
Involving a Commercial Motor Vehicle by Road Type: 2007-2010
Injury crashes are less common than crashes involving property damage but are more frequent than fatal crashes. Figure 6-3 shows the number of injury-related crashes rose from 39 in 2009 to 50 in 2010 for commercial trucks traveling on Vermont non-Interstate highways, an increase of 28 percent. The number of Interstate crashes involving injuries fell from 17 in 2009 to 11 in 2010, a reduction of 35 percent.
It is important to note that safety findings from the Pilot are considered inconclusive because one year of relatively infrequent events such as fatal and injury crashes can be significantly affected by circumstances unrelated to long-term trends.
6.2 Enforcement Analysis
As part of the Pilot study, the team looked at permit and enforcement levels as two of the many factors that contribute to crash rates. Overweight axles are a particular concern because they affect braking distances.
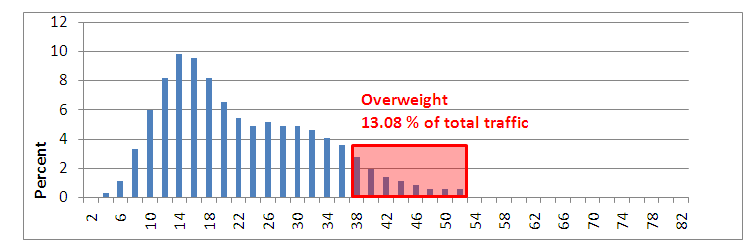
Figures 6-4 and 6-5 show the average load distribution on single and tandem axles, respectively. Figure 6-4 illustrates a relatively low rate of violation above the 20,000-pound single axle weight limit (about 3 percent) while Figure 6-5 shows a higher violation rate of 13 percent above the 36,000-pound tandem axle weight limit allowed during the Pilot period. The violations may or may not involve Pilot vehicles, Interstate or non-Interstate operation, or carriers with single-trip permits, such as construction equipment whose measured weights often exceed 36,000 pounds.
Figure 6-4. Single Axle Load Distribution (Vermont
2010 Average)
Percent of axle loads (in thousands of pounds)
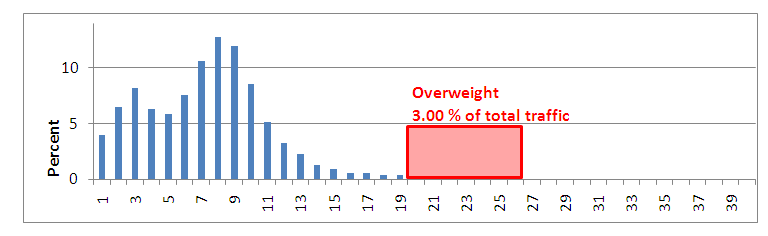
Figure 6-5. Tandem Axle Load Distribution (Vermont
2010 Average)
Percent of axle loads (in thousands of pounds)
The study analyzed permit data with crash data to determine whether Pilot trucks were involved in crashes. The Vermont DMV permit records show that 89 carriers obtained special excess weight permits in 2010. These permits include all vehicle special excess permit categories: 60,000, 69,000, 90,000, and 99,000 pounds and could be used by carriers for multiple trucks. While these records were not designed to capture the data needed to draw definitive conclusions, they were analyzed to identify potential trends. By cross-referencing the names of the carriers from the permit data with crash records, the study determined that 44 special excess permit carriers had commercial vehicles that were involved in crashes, i.e., approximately half of the Pilot carriers had vehicles involved in crashes in Vermont during the 2010 Pilot. It should be noted that crash records are not sufficiently detailed to identify whether Pilot trucks were involved in the crashes. For example, special permit holders may have many trucks in a fleet, many of which may not be Pilot trucks.
Using information on permits, vehicle weight enforcement, citations, inspections, and out-of-service rates, the study attempted to identify important safety and enforcement trends. Table 6-1 summarizes this research.
| Year | Permits | Vehicles Weighed | Weight Citations | Vermont Truck Roadside Inspections | Vermont Truck Out-of-Service Rate (Percent) |
|---|---|---|---|---|---|
| 2007 | 44,179 | 19,174 | 437 | 9,195 | 19.85 |
| 2008 | 41,879 | 9,866 | 521 | 8,082 | 21.36 |
| 2009 | 30,568 | 11,075 | 406 | 6,293 | 23.07 |
| 2010 | 20,474 | 6,272 | 284 | 4,608 | 7.9 |
As demonstrated in Table 6-1, the total number of commercial motor vehicles weighed by law enforcement personnel on platform scales, portable, or semi-portable scales decreased significantly from a high of 19,174 in 2007 to 6,272 in 2010. The number of cited violations decreased from 437 in 2007 to 284 in 2010, with permits decreasing from 44,179 in 2007 to 20,474 in 2010 (less than half of the permits issued in 2007). The number of roadside inspections declined during the Pilot period, and consequently the out-of-service rate declined to less than 10 percent of inspected vehicles.
| Year | U.S. Truck Out-of-Service Rate | Vermont Truck Out-of-Service Rate | New Hampshire Truck Out-of-Service Rate | Massachusetts Truck Out-of-Service Rate | New York Truck Out-of-Service Rate |
|---|---|---|---|---|---|
| 2007 | 23.1 | 19.9 | 18.2 | 30.1 | 23.1 |
| 2008 | 23.1 | 21.4 | 19.4 | 28.9 | 24.6 |
| 2009 | 21.7 | 23.1 | 19.9 | 30.7 | 22.9 |
| 2010 | 20.3 | 7.9 | 18.7 | 31.8 | 17.4 |
In 2010, over 2.3 million commercial motor vehicles were inspected in the United States, and 20.3 percent of those vehicles were placed out of service until safety repairs were made. Vermont conducted 4,608 truck inspections in 2010. As shown in Table 6-2, of those inspections, 7.9 percent were placed out of service, which was a significant drop from 23.1 percent in 2009. In reviewing the Vermont Commercial Vehicle Safety Plan for 2010, it was noted that six rest areas were closed in late 2009, which had been used for commercial motor vehicle inspection. The loss of inspectors could have contributed to the significant reduction in inspections but not necessarily the low vehicle out-of-service rate. In comparison, States surrounding Vermont (New Hampshire, Massachusetts, and New York) all showed consistent roadside truck out-of-service rates from 2007 through 2010, although Vermont's dropped considerably in 2010.
| Calendar Year | Total Vermont Truck Inspections | Vermont Intrastate Carrier Truck Inspections | Vermont Intrastate Carrier Inspection (Percent) | U.S. IntrastateCarrier Inspection (Percent) |
|---|---|---|---|---|
| 2007 | 12,029 | 542 | 4 | 18 |
| 2008 | 10,881 | 472 | 4 | 16 |
| 2009 | 8,418 | 344 | 4 | 16 |
| 2010 | 6,445 | 358 | 5 | 16 |
As shown in Table 6-3, Vermont inspects trucks belonging to intrastate carriers far less than the national rate. Intrastate carriers have a higher probability of being overweight since heavy commodities, such as gravel, typically move less than 50 miles according to the 2007 Commodity Flow Survey.
Even with a reduction in roadside truck inspections, Vermont continued to find overweight violations. Over half the weight violations involved trucks taken out of service for brake problems. These violations are notable because Vermont does not mandate additional or more frequent inspections of commercial motor vehicles that apply for overweight permits to determine their suitability and safety to transport the higher permitted weight. Furthermore, Vermont has less restrictive brake standards for 4-axle trucks with a single steering axle and rear tri-axle unit.
7.0 Commerce Effects
Heavier truck weight limits allow motor carriers to move freight at lower ton-mile costs because of the economies of scale provided by the additional truck capacity. Motor carriers benefit from greater truck size and weight limits on Interstate highways because each truck carries slightly more freight per load, reducing the total number of trips and decreasing operating costs for fuel, vehicle maintenance, and labor. In addition, because vehicle speeds are higher and more consistent on the Interstate System, motor carriers can complete more trips in one day with fewer trucks, further increasing efficiency and savings. Shippers might also benefit from lower freight rates charged by motor carriers. Some of the transport cost savings could benefit individual and industrial consumers as carriers and shippers pass along savings.
One possible impact of higher Interstate weight limits is the potential modal shift of freight tonnage from rail to trucks. In some circumstances, heavy trucks compete with short-line railroads for heavy and non-time-sensitive commodities like many of those shipped in Vermont. In cases where higher truck size and weight limits allow trucks to capture rail traffic, the additional road user fees collected from those trucks may not cover the additional highway construction and maintenance costs caused by those trucks.
Several factors complicate the analysis of the Pilot's effects on commerce, including: 1) the short duration of the Pilot, 2) the lack of information on origins and destinations of freight moving in study vehicles over Vermont's Interstate System, and 3) how much of the Pilot vehicles' utilization during 2010 was due to the program and how much was due to changes in economic activity. Each of these limitations is discussed here.
- Short duration of the Pilot. The 1-year duration of the study accommodated only short-term operational changes that were not large enough to affect a State economy, even a small State like Vermont.
- Differentiating between effects of the Pilot and those of changes in economic activity in general. The effects of truck traffic on impact areas in the absence of the Pilot were estimated. This was accomplished by estimating Vermont truck travel during the years 2006 through 2009 (Control case). In assessing the impacts of the Pilot, the study determined how Vermont's economic activity in 2010 differed from that during the 2006-2009 period. For example, VMT increases in 2010 might be partially attributable to increased hauling of road building materials to support $125 million in projects funded in 2010 with Federal stimulus dollars (American Recovery and Reinvestment Act).
7.1 Industry Changes
The Vermont industries with the most to gain from the truck Pilot are those that currently routinely transport heavy loads off the Interstate System. In Vermont, those industries include forest products, quarry products, and water products. Each of these industries benefitted immediately from the Pilot Program's higher weight allowances because they were able to shift existing heavy loads onto the Interstate System.
Other industries that benefited from the higher Pilot weights included petroleum, salvage/trash, asphalt, concrete, aggregates, and dairy, which routinely operate on the Interstate System. (The dairy industry has a grandfathered allowance of 90,000 pounds GVW on 5-axles.) During the Pilot, these industries had the opportunity to more fully load existing equipment or to upgrade to higher-capacity equipment to accommodate the weight limit loads. Table 7-1 describes the configurations used by heavy-hauling industries in Vermont before and during the Pilot period and illustrates how each converted.
| Industry / Carrier Specialization | Configurations Before / After the Pilot | Configurations During Pilot |
|---|---|---|
| Petroleum | 80,000-pound GVW with tandem rear axles | Utilization of 99,000-pound GVW trailers with tri-axles. Carriers tailor their compartment weights on the scales to avoid overweight axles. Petroleum tank trailers cannot be adapted to 99,000-pound GVW; must purchase or lease new trailers with tri-axles. |
| Timber | 99,000-pound GVW tri-axles on secondary system | Using the same equipment, but on the Interstates. |
| Salvage / Trash | 80,000-pound GVW on Interstates | Conversion to 99,000-pound GVW aluminum trailers with tri-axles. |
| Asphalt | 3,4,5,6-axle equipment | Carriers have adapted some trucks and have purchased lengthened pup trailers (from the Midwest). |
| Aggregates | 3,4,5,6-axle equipment | Industry utilized 69,600-pound pound trucks on the Interstates. |
| Concrete | 3,4,5,6-axle equipment | Same equipment but on Interstates where possible. |
| Dairy | 90,000-pound GVW allowance | Would convert to 99,000 pounds if made permanent. |
| Utilities | Bucket trucks above 80,000 pounds | Same equipment but on Interstates where possible. |
| Potable Water | 80,000-pound GVW with tandem rear axles | Conversion to 99,000-pound trailers with tri-axles. |
7.2 Anecdotal Information on Cost Changes, Market Expansion, and Modal Shifts
The Pilot allowed carriers to realize labor and equipment savings across all commodities moved. Overall, the productivity gains reported by Vermont carriers range from 15 to 25 percent, measured by increased payload, and reduced mileage, number of drivers, and number of trips. Vermont carriers reported operating cost savings of 20 percent or greater attributable to lower truck maintenance costs and labor costs. One petroleum carrier reported that the Pilot saved 75,000 miles-that is the equivalent of 1 year's worth of truck use. Drivers also realized higher productivity gains according to one carrier, with potentially higher pay for driving more miles and trips.
Carriers also reported that Interstate operations could lower haulage rates for some commodities by 5 to 6 percent. However, carriers said that it was difficult to estimate the potential for lower rates during the Pilot period. For example, the petroleum industry indicated that it might not be able to pass on savings because of the price volatility of the commodity.
Additionally, carriers reported that market expansion was another effect of the Pilot. Interstate operations allowed carriers to extend the boundaries of their service markets during the Pilot and to haul new commodities.
While this study did not estimate the number of loads that shifted from rail to truck during the Pilot period, research and outreach with rail carriers and shippers have provided meaningful information to inform this study. According to rail stakeholders, some traffic shifted from rail to truck in 2010, but this shift might have resulted from the recession and not necessarily from the lower truck rates during the Pilot. This study was unable to quantify the amount diverted to trucks.
Because the Pilot Program was initiated for a limited time period, the freight rail industry in Vermont was more concerned about the potential magnitude of future diversion if Interstate weight limits are permanently lifted. Within Vermont (and other States), the most vulnerable freight rail traffic is short distance moves of 500 miles or less hauled by the State's short line railroads. Vermont's short lines feed rail cars to connecting Class I (national) railroads for longer distance travel, but this function is increasingly vulnerable to truck diversion. In order to protect Vermont rail traffic, the State's rail industry believes it would need to immediately convert from 286,000-pound railcar capacity to 315,000-pound railcar capacity to compete with the 99,000-pound 6-axle truck.
8.0 Pavement Durability Effects
The rate at which pavements deteriorate depends largely on the number of vehicle axles and the loads they carry. Pavement damage caused by automobile traffic is negligible compared to that caused by heavy trucks. For this study, a key research question is whether the heavier truck fleet during the Pilot Program accelerated pavement damage on Vermont Interstate highways. Typically, techniques for measuring pavement damage "on the ground" are not sensitive enough to accurately assess the amount of damage that accumulates over a single year. Therefore, this study leveraged the results of past modeling efforts to estimate pavement damage and its effect on the life-cycle costs of pavements, or the degree to which the Pilot reduced the life of the pavements. Drawing on a significant body of research, the study sought to quantify the relative impact of the heavier truck axles during the 1-year Pilot versus the Control case in which the heavier trucks were not allowed on the Vermont Interstate System. While other factors such as weather and the use of studded tires exacerbate these effects, this study focuses on axle weights as the key element of the Pilot.
8.1 Evaluation Methods
The pavement evaluation relied on the WIM data and truck VMT estimates, presented in Section 5, to determine the effect of Pilot trucks on pavement life-cycle costs. The difference in pavement damage caused by the truck fleet under the Pilot and Control scenarios was calculated. To identify the impacts of the heavier trucks on pavement life, these four steps were followed:
Step 1: Assess Shifts in Traffic and Axle Loads
During the Pilot, some heavier trucks shifted from State routes to the Interstate System while other trucks already operating on the Interstate System started using heavier axles of the same type, or added both an axle and heavier loads. Also, some trucks that had been partly on the Interstate System increased their loads on both the Interstate and State road portions of their travels.
The study analyzed 2007 through 2010 WIM data to estimate the net changes in truck gross weights and axle weights by truck type on Interstate and non-Interstate highways in Vermont. Weight change estimates were combined with truck volume estimates, described in Section 5, to derive overall changes in axle weights for each type of highway.
The study determined that 2008 data would provide a more reliable Control year for comparisons than 2009 because, in some cases, 2009 data showed significant increases in vehicle weights that could be attributable to anticipation of the Pilot period.
Step 2: Calculate Overall Measures of Relative Pavement Damage
The weight carried by a vehicle axle is among the most important factors in determining the extent of pavement damage caused by heavier loads, which are many times more damaging than lighter loads. Models developed for the National Pavement Cost Model were used to estimate the relative damage caused by different axle weights and configurations (single, tandem, tridem) and compared it to the damage caused by a 34,000-pound tandem axle load, for several different types of distress (i.e., manifestations of damage, including rutting, cracking, and roughness).
Step 3: Evaluate Distress Levels On Vermont Highways
The VTrans collects pavement distress information biannually on Interstate, State, and Class 1 Town highways. Using the most recent compilation of this distress information, the study estimated the relative importance of each type of distress on Interstate and non-Interstate highways.
Step 4: Estimate Pavement Cost Impacts
With the information developed in steps 1 through 3, the study weighted the relative damage estimated for each distress type by the relative impact of each distress on pavement costs in Vermont to derive an assessment of overall changes in pavement damage on each type of highway. Finally, the annual overall pavement costs incurred by Vermont were estimated and factored in the estimated load-related share of these expenditures to derive an estimate of overall annual changes in pavement costs, as well as costs for each highway type.
8.2 Findings
More trucks and heavier trucks used the Interstate System during the Pilot study, resulting in increased pavement damage on Interstate highways. Although the overall truck traffic volumes decreased slightly on non-Interstate highways during the Pilot period, the reduction in truck volumes was not sufficient to result in significantly less damage. The operating weights of several types of trucks increased enough to nearly offset the lower volumes, so pavement damage remained virtually unchanged on these roads.
During the 2010 Pilot period, the Vermont Interstate System experienced an increase in vehicle operating weights for several vehicle classes. Because heavier loads are many times more damaging than lighter loads, the estimated pavement damage on the Interstate increased during the Pilot. Table 8-1 summarizes the change in pavement damage potential of various vehicle classes affected by the Pilot Program, as well as other trucks.
| FHWA Vehicle Class | Interstate Pavement Changes (Pilot Versus Control) 2010 (Percent) | Non-Interstate Pavement Changes (Pilot Versus Control) 2010 (Percent) |
|---|---|---|
| 7 | 700.5 | -4.9 |
| 8 | -5.1 | 2.7 |
| 9 | 1.7 | -5.7 |
| 10 | 71.5 | 19.5 |
| 11 | 65.5 | 9.1 |
| 12 | 149.2 | -45.3 |
| Other | 0 | 0 |
| All Trucks | 11.8 | -0.4 |
According to these estimates, load-related pavement damage increased by about 12 percent on the Interstate System and decreased by less than half of one percent on non-Interstate highways. This translates into significant increases in both the pavement maintenance and repair costs in Vermont borne by the State and by highway users due to more frequent work zones and/or deteriorated pavement conditions. Even when miles traveled decreases, increased weights of the heavier trucks result in increased pavement damage potential.
Another way of evaluating the Pilot's impact is to look at how the average damage induced by a vehicle in each class compares to the damage induced by a single 34,000-pound tandem axle. Table 8-2 illustrates which trucks caused the greatest incremental damage during the Pilot.
| FHWA Vehicle Class | Interstate Base | Interstate Pilot | Percent change | Non-Interstate Base | Non-Interstate Pilot | Percent change |
|---|---|---|---|---|---|---|
| 7 | 0.98 | 1.98 | 101.2 | 2.29 | 2.74 | 19.8 |
| 8 | 0.33 | 0.33 | 0 | 0.34 | 0.34 | 0 |
| 9 | 0.88 | 0.88 | 0 | 0.92 | 0.92 | 0 |
| 10 | 1.17 | 1.95 | 66.5 | 1.96 | 2.57 | 31.2 |
| 11 | 0.64 | 0.64 | 0 | 0.43 | 0.43 | 0 |
| 12 | 0.74 | 0.94 | 27.6 | 1.75 | 2.65 | 51.7 |
| Other | 0.12 | 0.12 | 0 | 0.21 | 0.21 | 0 |
| All trucks | 0.55 | 0.6 | 9.9 | 0.44 | 0.44 | 1.2 |
| Note: percent change based on full precision of damage factors. | ||||||
If the Federal Government allows heavier trucks to operate in the future, then individual highway users, motor carriers and shippers will experience higher operating costs because of delays caused by more frequent work zones for pavement maintenance and repair and/or increased wear and tear on vehicles caused by pavement deterioration.
Although the study lacked sufficient Vermont expenditure information to derive a precise assessment of the pavement-related costs of truck travel in Vermont, national averages and the results of detailed analyses in other States were used to develop estimates. Applying Vermont truck weight data to the national average costs, it was determined that a fully loaded, 80,000-pound 5-axle combination truck incurs 21.5 cents of pavement costs per-mile on the Interstate System and 32.9 cents per mile on other highways. A typical 99,000-pound 6-axle Pilot vehicle requires pavement expenditures of 34.5 cents per mile of travel on the Interstate System and about 53.6 cents per mile of travel on non-Interstate roads. This is about 63 percent more per vehicle mile and about 32 percent more per ton-mile than a fully loaded 5-axle vehicle.
9.0 Bridge Durability Effects
There are several ways to assess bridge performance. For example, bridges can be assessed for their safety (e.g., their load carrying capacity), durability (e.g., how resistant they are to loads and weather, or what their expected service life may be), or their functional characteristics (e.g., maximum under clearance height). The impacts to bridge durability from the Pilot study trucks was a focus of this study. The study identified bridges that did not provide sufficient strength, and then predicted and quantified any loss in service life expected in bridges, if heavier trucks were allowed indefinitely on the Interstate System in Vermont. The impacts were monetized based on average bridge construction cost and assumed baseline performance. This analysis was based on field measurements of truck weight and classification but is purely theoretical in terms of assessment of bridge stresses and predicted performance. A 1-year study is not sufficient time to observe physical changes in bridge condition that could be used to quantify impacts.
9.1 Evaluation Methods
This study focused on primary bridge superstructure elements; i.e., stringers and floor beams, excluding truss members and decks. Although it is likely that bridge decks may experience increased cracking and deterioration when subjected to heavier loads, the bridge deck deterioration models currently available deal primarily with deterioration caused by roadway deicing agents. Thus, a definitive analytical assessment of bridge deck durability as a function of increased wheel or truckloads is not feasible at this time. Similarly, bridge substructures or foundations are not included as these bridge components are typically not rated for load-carrying capacity. The reasons for focusing on superstructure components are discussed here.
Although impacts to bridge decks are not addressed directly, impacts to the deck wearing surfaces are considered. Since Vermont uses a membrane plus an asphaltic wearing surface on all bridge decks, it was surmised that the impact to bridge performance will be similar to that of road pavement because the wearing surface is made from similar materials and has similar mechanisms of failure.
The analytical approach consisted of performing detailed structural analysis on the Interstate bridges to quantify changes in the stresses under the Pilot loads and then checking these stresses against the code-specified limits for various limit states. Limit states are conditions under which the bridge would cease to satisfy the provisions for acceptability as per national standards. Where limit states are violated, the bridge would require posting, strengthening, or replacement for it to carry the Pilot truck loading indefinitely. This produces what is known as a "load rating," which means a load that can safely be carried by the bridge.
The study used bridge-design criteria relating to load-carrying capacity, known as strength limit states, to understand the safety of the bridges with respect to an increase in GVW. Based upon limited resources, the bridges were rated only at the design-load level (using a truck load model known as HL-93) of the American Association of State Highway and Transportation Officials' (AASHTO) Load and Resistance Factor Design (LRFD) bridge design specifications, and at the legal-load level for the controlling Vermont Pilot load in accord with the load and resistance factor rating (LRFR) provisions of the AASHTO Manual for Bridge Evaluation (MBE). A rating factor equal to or greater than 1.0 indicates that the bridge can safely carry the load. A rating factor less than 1.0 indicates that some action is necessary, either posting or strengthening the bridge.
It should be noted that ratings for Vermont Interstate bridges, as currently reported in FHWA's National Bridge Inventory, were developed using the older load factor rating (LFR) provisions of the MBE. These LFR provisions were not used for this study as studies have shown that these provisions do not produce consistent ratings. In other words, the LFR ratings show little or no correlation to anticipated probabilities of failure. Thus, this study uses the ratings based upon the newer LRFR provisions for which the ratings correlate to probabilities of failure.
The set of bridge-design criteria relating to durability, the service limit states of the LRFD specifications and the MBE, are not calibrated but are based on historic bridge performance. As a result, these design criteria may not correlate well with anticipated performance. These uncalibrated service limit states, when exceeded (such as when a pre-stressed concrete beam cracks), do not provide a reliable measure regarding the potential loss of service life.
Another set of design criteria for steel bridges, known as the fatigue limit states, while not strictly calibrated are based upon probabilities of failure on the member resistance. Estimating remaining fatigue life with this limit state can provide a measure of the loss of service life. Since the majority of the Vermont Interstate highway bridges are steel bridges, the fatigue limit states can be used to estimate the effects of increased GVW on service life.
Fatigue lives of the steel bridges on Vermont Interstate highways were estimated for a baseline Control loading representing the year 2010 if the Pilot was not initiated and for the actual Pilot loading during the year 2010. To standardize the fatigue life estimates, AASHTO-specified category C detail, one of the most common fatigue details on steel highway bridges, was assumed to occur at the point of maximum stress. The category C fatigue criteria were used because this reflects a detail type that is frequently found on most steel bridges (typically at the welded connections of stiffeners and shear studs), and would provide a meaningful measure of the impact to the bridge inventory in a broad sense.
Loads
Table 9-1 shows the loads under consideration, including all the Pilot trucks as allowed by legislation plus a rating vehicle currently used by Vermont. The development of these detailed axle configurations required interpretation of legislated limits, as outlined in Table 5-2, and assumptions about practical worst-case scenarios. Based upon WIM observations, the study assumed the steering axle of Pilot trucks weighs 8,000 pounds (8 kips). The remainder of the legislated maximum GVW is equally distributed over the remaining axles. The shortest vehicle length allowed by the legislation is used to generate the greatest force effects on the bridges. It was also assumed that the distance between the steering axle and the first drive axle is 11 feet. All tandem and tridem axles are assumed to be 4 feet apart. What is particularly unique about these Pilot truck configurations is that they have short total lengths and may not be compliant with Federal Bridge Formula B.
| Name | Total Length (ft) |
GVW (kips) |
Axle Configuration (Loads in Kips, spacing in feet) |
|---|---|---|---|
| 3 Axle SU | 19 | 60 | 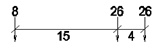 |
| 4 Axle SU | 23 | 69 |  |
| 5 Axle 90 kip | 51 | 90 | 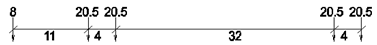 |
| 6 Axle 90 kip | 43 | 90 | |
| 6 Axle 99 kip | 51 | 99 | |
| 6 Axle 132 kip* | 54 | 132 | |
| *Vermont state rating vehicle, used for comparison | |||
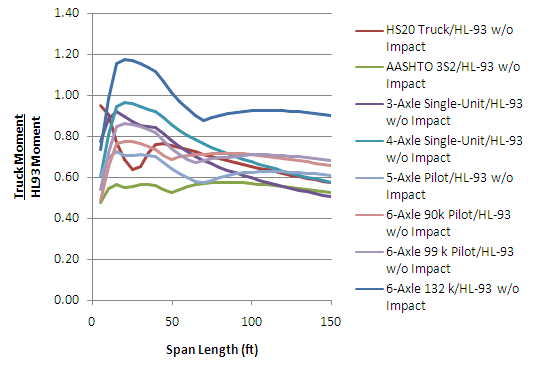
The effects of the trucks included in the study were assessed by comparing load-induced moments and shear stresses on simple-span and two-span continuous bridges of prismatic cross section for span lengths up to 150 feet. Moments are the force effects in a girder when it bends under load. Figure 9-1 shows a sample plot of simple-span moments for various trucks. It should be noted that the moments from the 99,000-pound (99 kip) 6-axle Pilot truck is less than the moments from the AASHTO HL-93 design vehicle and 6-axle 132,000-pound (132 kip) truck for the full range of span lengths. The 6-axle truck is a rating vehicle that is used in Vermont, as per its bridge design manual.
Figure 9-1a. Simple Span Bridge Moments for
Pilot Trucks and Other Rating Vehicles (Raw Moments
vs. Span Length)
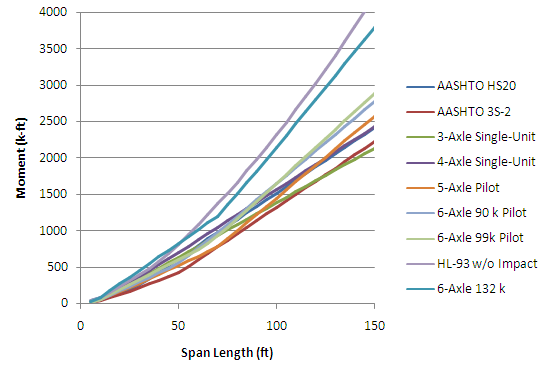
Figure 9-1b. Simple Span Bridge Moments for
Pilot Trucks and Other Rating Vehicles (Normalized to
AASHTO LRFD Design Loading HL-93)
Bridge Sampling
The study used a representative sample of bridges that reflects those typically found on the Vermont Interstate network to perform detailed rating analysis. The results of these analyses were then used to extrapolate and quantify total impacts to the overall Interstate inventory. Table 9-2 provides information on Vermont's Interstate bridge network of 265 bridges.
| Category | Description | Number of bridges* | Sample |
|---|---|---|---|
| I | Simple steel stringer bridge | 156 | 10 |
| II | Continuous steel stringer bridge | 85 | 6 |
| III | Simple pre-stressed concrete stringer bridge | 2 | 1 |
| IV | Continuous steel girder-floorbeam bridge | 12 | 3 |
| V | Simple concrete tee beam | 2 | 1 |
| VI | Continuous steel frame | 4 | 2 |
| VII | Simple steel deck truss | 2 | 1 |
| VIII | Continuous steel deck truss | 2 | 1 |
| Total | 265 | 25 | |
| * Category I is 87 pairs of twin bridges and 8 single bridges; Category II is 40 pairs of twin bridges plus 5 single bridges; remaining categories are pairs of bridges. | |||
Recognizing that the majority of the bridges are twin bridges reduces the number of bridges to consider to about 139 unique bridges.
The following strategy was adopted to build a sample from these bridges:
1. Select one of each of the twin bridges in categories III and V through VIII.
2. Select three bridges from category IV to capture a good distribution of age and average daily truck traffic (ADTT).
3. Select one bridge in category I built prior to 1985 (see Table 9-3); select 2 of 15 bridges built between 1976 and 1985 (one with ADTT less than 1,000, the other with ADTT greater than 1,000); finally select 6 of the 139 bridges built prior to 1975 (3 with ADTT less than 1,000, 3 with ADTT greater than 1,000).
4. Select two of eight bridges in category II built between 1976 and 1985 (see Tables 9-3a and 9-3b), one with ADTT less than 1,000, the other with ADTT greater than 1,000; finally select 4 of the 77 bridges built prior to 1976 (2 with ADTT less than 1,000, 2 with ADTT greater than 1,000).
5. Choose a reasonable distribution of span length where possible.
| Year Built | 1975 or Earlier | 1976 through 1985 | After 1985 |
|---|---|---|---|
| Number of bridges | 139 | 15 | 2 |
| Sample | 6 | 2 | 1 |
| Year Built | 1975 or Earlier | 1976 through 1985 | After 1985 |
|---|---|---|---|
| Number of bridges | 77 | 8 | 0 |
| Sample | 4 | 2 | 0 |
Based upon this approach, a preliminary sample of 25 bridges was identified, which is 18 percent of the Interstate inventory, considering twins. At a meeting with VTrans, the sample was further refined and finalized, based upon VTrans' knowledge of the bridges and the location of heavily traveled truck routes.
The final sample includes:
- 10 simple-span steel girder bridges,
- 6 continuous steel girder bridges,
- 1 simple-span prestressed-concrete girder bridge,
- 3 continuous steel girder-floorbeam bridges,
- 1 simple-span concrete tee-beam bridge,
- 2 continuous steel frames,
- 1 simple-span steel through truss, and
- 1 continuous steel deck truss.
9.2 Findings
Strength Limit States
The study evaluated all the sample bridges for strength limit states at the design-load and legal-load levels using the LRFR provisions of the MBE. The design load is the HL-93 load model of the AASHTO LRFD Specifications. The design load-level rating indicates the bridges' load-carrying capacity relative to today's national design and load capacity rating standard. (The majority of Vermont Interstate bridges were not designed using the newer design standard; newer bridge designs use and future designs will use the new design standard.) The legal load is the controlling Pilot-truck configuration for each bridge and load effect (moment or shear). The legal load level rating indicates the ability of the bridge to safely carry the Pilot trucks.
Conventional structural analysis techniques were used, based on existing bridge design plans provided by VTrans, to determine the bridge rating. Condition data (such as corrosion and section loss) from bridge inspection reports were not considered in the rating analysis, due to limited study resources. The analysis showed that 23 of the 25 bridges in the sample can carry the Pilot trucks with at least the minimum level of safety specified by the MBE. The two bridges that did not meet bridge safety requirements were two of the three continuous steel girder-floorbeam bridges. The ratings of both of these bridges were governed by the floorbeams with rating factors of 0.85 and 0.90, respectively. These two bridges would need to be posted or the floorbeams strengthened to provide the safety specified in the MBE. The other superstructure components of these bridges, the girders and stringers, rated adequately for the Pilot trucks at the legal load level. Thus, the costs associated with bridge strengthening to carry Pilot loads would be very small.
Fatigue Limit States
The fatigue lives of the 23 steel bridges in the sample were also evaluated. Fatigue life is characterized by two sets of design criteria, or limit states, in the AASHTO LRFD Specifications and the MBE: the "fatigue I" limit state and the "fatigue II" limit state. These two limit states represent two distinct regimes of fatigue behavior. The fatigue I limit state represents infinite fatigue life performance (i.e., the bridge can safely carry an infinite number of truck-load induced fatigue cycles). Thus, if this limit state is satisfied the bridge will not experience significant cracking during its 75-year design life no matter how many stress cycles are applied. This is typically referred to as "infinite life." The fatigue II limit state represents finite fatigue life performance. If the fatigue I limit state is not satisfied and cracking is expected, the fatigue II limit state can estimate the fatigue life as a function of applied stress cycles. Fatigue I and fatigue II limit states indicate the effect of the Pilot trucks on the service lives of Vermont Interstate bridges.
Fatigue load factors are multipliers that are applied to a standard design truck (HS20) to provide adequate safety against fatigue cracking for the design life of the bridge. Instead of applying the fatigue load factors of the AASHTO LRFD Specifications and the MBE which represent national values, the study derived Vermont Interstate System-specific load factors. Table 9-4 shows the load factor values as determined via AASHTO procedures.
| Limit State | Load Factors |
|---|---|
| Fatigue 1 | 1.50 |
| Fatigue 2 | 0.75 |
The AASHTO fatigue design load when factored by the fatigue I load factor represents the maximum load for considering fatigue effects. Similarly, the AASHTO fatigue design load when factored by the fatigue II load factor represents the effective load for considering fatigue effects. Thus, the effective load is a load that yields equal fatigue damage as the actual distribution of trucks. These factors are derived based on analysis of truck weight spectra and the moments that are generated as these are passed over bridges of varying span length.
Fatigue load factors specific to Vermont's Interstate Highway System were derived by using limited WIM data by vehicle class factored by percentage of each class according to VMT for the Control and the Pilot. The fatigue lives of the 23 steel bridges in the sample were then determined by applying the fatigue load factors specific to Vermont's Interstate Highways and are shown in Table 9-5.
| Limit State | Load Factors Control | Load Factors Pilot |
|---|---|---|
| Fatigue 1 | 2.07 | 2.07 |
| Fatigue 2 | 0.74 | 0.76 |
A comparison of these load factors suggests that the introduction of Pilot trucks onto Vermont Interstate highways will have little or no effect on the fatigue lives of the sample bridges, as load-factor values do not significantly change from the Control to the Pilot.
Of the 23 steel bridges rated for fatigue, 19 bridges were deemed to result in infinite fatigue life when the Control and the Pilot distributions are considered. The remaining four steel bridges were estimated to have fatigue lives both during the Control and the Pilot equal to or greater than the 75-year design life, as inherent in current AASHTO specifications. The results for the Control and the Pilot are essentially the same since the fatigue load factors for both, as shown in Table 9-5, are essentially the same. In other words, the difference in a fatigue II load factor of 0.74 and 0.76 is not significant, as the error in the fatigue-life calculations is much greater than this difference.
Deck Wearing Surfaces
The impacts to bridge deck wearing surfaces are assumed to be similar to roadway pavement since the materials and failure mechanisms are also similar. The pavement evaluation determined that the Pilot trucks will cause a loss of pavement service life of approximately 11 percent. The VTrans experience indicates that bridge wearing surfaces typically last 5 years and cost $2 per square foot to mill and replace. Thus, the annualized additional cost for this impact is calculated to be $100,000 per year to maintain all Interstate bridges (2.67 million square feet of deck area), based on a 4-percent real discount rate. This is a small increase in cost (0.3 percent) as compared to the cost of the overall Interstate bridge program in Vermont.
Discussion
In summary, the bridge analysis indicated that the change to Interstate truck size and weight, as considered in this Pilot Program, would have a negligible impact to the Vermont Interstate bridges. All of the bridges analyzed provide adequate load rating to safely support the Pilot loads (except for strengthening of secondary members of two bridges), and service life based on the steel fatigue will only be of marginal concern. This would require investment for a small, one-time upgrade of the two bridges. It was determined that future designs that meet current AASHTO LRFD Specifications will adequately support the Pilot loadings. There is the potential for minor impacts to the deck wearing surfaces, but these costs are likely to be very small in comparison to the overall bridge program. There may be impacts to other bridge components such as decks, joints, bearings, piers, and abutments, but these impacts cannot be adequately quantified with currently available analytical tools.
It is not surprising that the Vermont Interstate highway bridges for the most part adequately rate for the Pilot trucks. Truck volumes are relatively small, and 4.8 percent of the bridges on Vermont's Interstate highways are designed to carry a 28-foot long, 5-axle 90,000-pound vehicle called the HS25 truck. This design load exceeded the live load specified in prior AASHTO specifications by 25 percent at the time, and also exceeds the provisions of the Federal Bridge Formula B. Furthermore, Vermont ensures that new bridges can safely carry their 54-foot long, 6-axle 132,000-pound rating truck as a legal load, which allows them to permit these vehicles to operate on their highways.
Fatigue is the steady accumulation of damage due to repetitive loads. In highway bridges, it is not the occasional very heavy loads that contribute the most to fatigue but the vast majority of typical loads. During the Pilot, WIM data plus VMT data suggest that the increase in heavy trucks has little or no effect on the accumulating damage as these trucks are overshadowed by the vast majority of trucks, which have not changed. Fatigue damage is typically characterized by the calculation of an "effective stress." This effective stress remains virtually unchanged during the Pilot and even as projected into the future. The data suggest that the Pilot trucks only represent 3 percent of the total truck fleet, which is an insufficient number of Pilot trucks to make a difference in cumulative fatigue damage during the Pilot. If the Pilot were extended or made permanent and the distribution of traffic changed as the Pilot trucks became the norm, fatigue damage would likely increase.
The focus of this analysis and evaluation has been on Interstate bridges. Due to the shift in VMT and loads among vehicle types, there should not be any negative impacts on the non-Interstate bridges as a result of this Pilot.
10.0 Energy Effects
The Pilot Program was expected to produce changes to fuel consumption resulting from two factors. First, the shift of loads to heavier trucks increases the economies of scale of trucking operations, meaning that trucks move heavier but fewer loads. For example, 100,000-pound trucks will use more fuel per mile than 80,000-pound trucks but overall will use less fuel per ton mile because fewer trips are required to move the equivalent amount of cargo.
Second, trucks will shift from non-Interstate roadways to the Interstate System because of improved operating characteristics of the Interstate. Trucks operating on the Interstate will travel at a more consistent and higher average speed than trucks operating on State routes. Decreased stop-and-go traffic will increase fuel efficiency, but if trucks cruise at higher speeds on the Interstate than on State routes, some of the gains in efficiency may be lost.
While the study utilized the best available data and methods, there are some uncertainties in the calculation of energy benefits.
10.1 Evaluation Methods
In order to estimate the change in fuel consumption resulting from the Pilot period, the study analyzed changes in VMT and weight by truck configuration and facility type (Interstate versus non-Interstate). Because of the generally linear relationship between payload weight and fuel consumption (e.g. fuel consumption increases with weight), the change in fuel consumption for heavier payloads can be extrapolated from existing data. In this case, the study used DOT, Oak Ridge National Laboratory, and National Academy of Science data to develop a range of fuel consumption by weight class. In addition, the U.S. Environmental Protection Agency's MOBILE/MOVES mobile source emissions model was used to estimate the change in diesel fuel consumption. Table 10-1 presents fuel economy data.
| GVW (1,000 lbs) | DOT (2009) |
Oak Ridge National Laboratory (2008) |
National Academy of Sciences (2010) |
|---|---|---|---|
| 10 | 7.47 | 9.32 | 8.09 |
| 20 | 7.22 | 8.81 | 7.71 |
| 30 | 6.97 | 8.31 | 7.34 |
| 40 | 6.73 | 7.8 | 6.99 |
| 50 | 6.48 | 7.3 | 6.66 |
| 60 | 6.23 | 6.79 | 6.34 |
| 70 | 5.99 | 6.29 | 6.04 |
| 80 | 5.74 | 5.78 | 5.75 |
| 90 | 5.49 | 5.28 | 5.46 |
| 100 | 5.24 | 4.77 | 5.19 |
| 110 | 5 | 4.27 | 4.93 |
| 120 | 4.75 | 3.76 | 4.68 |
| 130 | 4.5 | 3.26 | 4.45 |
By using several data sets as a "sensitivity test," the study removed any biases within a single study toward a specific engine or fleet. Collectively, these three data sources provide the data needed to develop alternative trend lines for fuel consumption versus combined truck cab and payload GVW weight. The change in VMT by GVW resulting from the Pilot is divided by the average fuel economy by GVW weight class to estimate changes in diesel fuel consumption.
To estimate the improved fuel characteristics of trucks operating on Interstates at a more constant and higher speed than trucks operating on non-Interstate facilities, the study used the findings of two prior studies that examined simulated or measured the efficiency differences of trucks operating on Interstates versus State routes or other roadways:
- Estimating Truck Related Fuel Consumption and Emissions in Maine: A Comparative Analysis for 6-Axle, 100,000-Pound Vehicle Configuration (American Transportation Research Institute (ATRI), 2009).
- Modeling the Emissions of Heavy-Duty Vehicles on Interstate 89/189 and US Route 7 in the Burlington Area: Final Research Report (University of Vermont Transportation Research Center, 2009)
The ATRI study found a 15 to 20 percent improvement in average fuel efficiency from switching to an Interstate route. The University of Vermont (UVM) study found a considerably greater improvement, on the order of 60 percent. However, the UVM study compared a short (5 mile) stretch of Interstate to a parallel US route in an urban area with relatively high congestion. As a result this comparison was only applicable in urban settings in Vermont. For most highway sections, the study utilizes the ATRI values of 15-20 percent improvement.
While the research takes into account all available information, the findings could be strengthened with more complete information on the number of trucks that changed routing as a result of the Pilot versus those that were removed from the network completely as a result of increased economies of scale. In addition, the study did not have information on average fuel consumption of trucks on non-Interstate facilities in Vermont.
10.2 Findings
The change in diesel fuel consumption as a result of the Pilot Program is the key energy metric for the private sector. Table 10-2 presents the changes in diesel fuel consumption by facility type and in total based on fuel economy sensitivity tests presented in Section 10.1 and the truck volume results presented in Section 3.2.
| Facility Type | 2010 VMT Control (millions) |
2010 VMT Pilot (millions) |
Diesel Fuel Consumption Change (1,000 gallons) |
|---|---|---|---|
| Interstate | 205.24 | 208.76 | 631.0 – 634.6 |
| Non-Interstate | 411.08 | 404.79 | (979.0) – (1,000.3) |
| Total (Net) | 616.32 | 613.55 | (344.5) – (369.3) |
These results demonstrate that increased economies of scale will result in a reduction in diesel fuel consumption.
The net change in total Vermont truck VMT from the 2010 Control to Pilot is 2.7 million miles. The total change in VMT is a result of an overall decrease in the number of 80,000-pound and less trucks and an increase in the number of 100,000 pound and greater trucks on Vermont Interstate highways. Increased fuel consumption resulting from an increase in truck VMT on Interstates is offset by an overall reduction in VMT on non-Interstate facilities. The reduction in diesel fuel consumption ranges from 344.5 to 369.3 thousand gallons depending on the fuel economy approach used.
As noted above, the Pilot Program does not affect all truck classes. Based on an evaluation of Vermont WIM data from 2007 through 2009, compared to 2010 WIM data, FHWA Class 7, Class 10, and Class 12 trucks show the most statistically significant changes in average weight. Figure 10-1 presents the change in GVW by VMT for these three target truck classes. The two primary shifts between the Control (blue) and Pilot (red) curves are:
- Total VMT decreased for non-Interstate trucks (represented by dashed line), while average GVW slightly increased; and
- Total VMT and average GVW increased for Interstate truck travel (represented by the solid line).
Figure 10-1. GVW Shifts by Truck VMT (Vermont
2010 Control to 2010 Pilot)
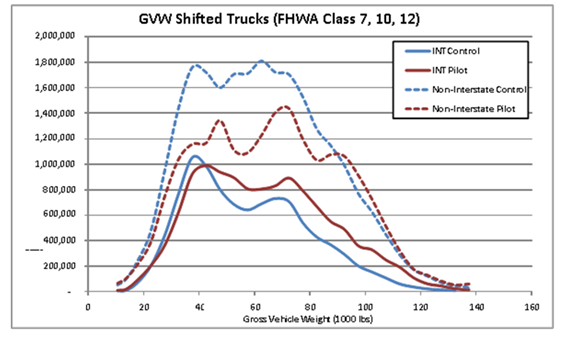
Some of the increases in VMT and average GVW are the result of shifts in VMT between truck classes. The FHWA Class 8, 9, and 11 trucks show notable shifts in VMT between the 2010 Control and 2010 Pilot. Class 8 and 9 trucks show an overall decrease in total VMT, while Class 11 trucks show an increase. Based on the WIM evaluation, however, none show statistically significant changes in weight distributions.
Figure 10-2 presents the total distribution of truck VMT by GVW for the 2010 Control and 2010 Pilot cases across Class 7 through Class 12 trucks. It was assumed that Class 5, 6, and 13 trucks were not affected by the Pilot and are thus excluded from the energy analysis).
Figure 10-2. 2010 Vermont Distributions of
Truck VMT by Gross Vehicle Weight
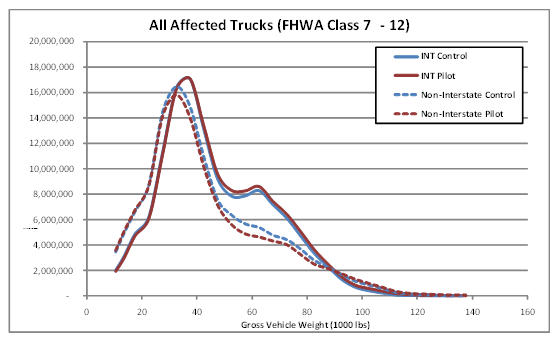
Table 10-3 summarizes the change in fuel consumption by vehicle class and facility type.
| Facility Type | Change in Fuel Consumption (1,000 gallons) |
Total Change in Diesel Fuel Consumption | |
|---|---|---|---|
| Class 7, 10, 12 | Class 8, 9, 11 | ||
| Interstate | 205.24 | 208.76 | 631.0 – 634.6 |
| Non-Interstate | 411.08 | 404.79 | (979.0) – (1,000.3) |
The results confirm the second hypothesis that the movement of truck VMT from non-Interstate facilities to Interstates will result in improved operating conditions and reductions in fuel consumption. Pilot Interstate VMT increases by 3.6 million truck-miles in 2010 compared to the 2010 Control VMT estimate across both single-unit and combination trucks.
The actual shift in VMT from non-Interstate facilities to Interstates cannot be determined directly from the available data. Based on insights from shipper surveys, route adjustments from non-Interstates to Interstates was a primary response to the Pilot Program, which is consistent with changes in performance from 2010 estimated Control to 2010 observed Pilot.
While the fuel economy on non-Interstate versus Interstates in Vermont cannot be determined, the analysis indicates that for the 2.5 million or more combination truck-miles that shift routes from non-Interstate to Interstate facilities, it is expected that per mile, each truck will consume 15-20 percent less fuel than it did on non-Interstates. For example, if the average fuel economy of 80,000-pound vehicles operating on non-Interstates is 5.6 miles per gallon (the current average for 80,000-pound vehicles irrespective of average speed), the change in fuel consumption from the shift of 2.5 million combination trucks to Interstates would range from 57,000 to 73,000 gallons of diesel fuel savings in 2010.
Fuel savings result in lower operating costs and reduced emissions as long as the cost savings do not stimulate an increase in demand for trucking or a shift from more energy-efficient modes to trucking. The Pilot period was too short to stimulate such potential offsets to fuel consumption and emissions.
11.0 Summary of Findings
The Vermont Pilot Program contributed to modest increases in Interstate truck VMT and a slight decrease in non-Interstate truck VMT. The safety effects of the Pilot are inconclusive due to the short duration of the Pilot. An analysis of bridge strength and fatigue concluded that Pilot trucks would not cause measurable damage to bridge structures and that Vermont's Interstate bridges are capable of supporting the heavier Pilot trucks. Pavements experienced the greatest magnitude cost impact during the Pilot as heavier axle loadings accelerated Interstate pavement damage by approximately 12 percent, while reductions in damage off the Interstate System were negligible due to continued loadings by heavy trucks. An examination of energy impacts indicated reductions in diesel consumption during the Pilot Program.
Limitations of the Pilot preclude conclusions on the likely consequences of permanent change in truck weight rules in Vermont or elsewhere.
- Many truck operators did not take advantage of the 1-year window in which motor carriers could utilize the Interstate System to move heavier loads. Required equipment investments were too high to make without assurances of long-term use.
- Safety findings from the Pilot are inconclusive because 1 year of relatively infrequent events such as fatal and injury crashes can be significantly affected by circumstances unrelated to long-term trends. Safety studies typically require a minimum of 3 years of data.
- The Pilot occurred during an atypical period of economic fluctuation for Vermont and the Nation. Long-term growth peaked in 2007, declined significantly in 2008 and 2009, and recovered slightly in 2010.
- Vermont, being small geographically with one of the smallest populations and economies in the country, will not be representative of other States with respect to tonnage of goods movement.
- Long-term infrastructure costs will be less than for other States, especially given the relatively small truck volumes on Vermont's bridges.