Comprehensive Truck Size and Weight Limits Study - Modal Shift Comparative Analysis Technical Report
Appendix G: VMT and Weight Distribution Estimates Methodology
The USDOT's Comprehensive Truck Size and Weight Study, 2014 (2014 CTSW Study) compiled all relevant data, including (1) vehicle classification and weigh-in-motion (WIM) data collected by the states and reported via the Vehicle Travel Information System (VTRIS) and Traffic Monitoring Analysis System (TMAS) data reporting systems, (2) tables of VMT published on the FHWA website, (3) a custom control-total spreadsheet that includes VMT totals by broad vehicle and highway types for ten groups of states, and (4) WIM data collected under the long-term pavement performance (LTPP) program. Most data covered years from 2010 through 2013, and all data were adjusted to control totals for 2011.
FHWA's process for estimating VMT data started with the 2012 control-total spreadsheet. We adjusted these control totals based on the 2011 VM1 table version that was included on FHWA's website on late January 2014. We factored the 2012 spreadsheet totals up or down so that we precisely matched the 2011 VM1 tables. Using vehicle classification data and the January 2014 website version of FHWA's VM-2 table, we split the control totals for the groups of States, broad classes of vehicle types, and groups of highway types into the 13 vehicle types estimated in the classification data, 12 functional highway classes, and 51 States, adjusting the auto estimates such that the 2011 VM2 tables were precisely matched. Using WIM data, we further split the 13 vehicle types into 28 detailed vehicle classes (VC) and 100 operating weight groups (OGW) needed for the CTSW Study, and developed detailed arrays of axle weights and types for each combination of VC and OGW.
The detailed breakdowns were aggregated to the levels of detail required for each phase of analysis of the 2014 CTSW Study. Bridge analysis, for example, required arrays of axle weights and types for two broad groups of States and with all vehicle classes and OGWs grouped together. Pavement analysis required grouping by the ten regions used earlier (groups of states chosen based on similar truck size and weight characteristics), and required aggregating the 24 truck classes into no more than 10. By starting with the full level of detail needed for all phases of the study, all the phases were able to use the same set of travel data, aggregating as needed to suit their purposes.
VMT Control Totals
The table below shows FHWA's estimated 2012 control totals (in millions of VMT) for broad classes of vehicles on six types of highways in each of ten groups of States (or regions).
|
Region/Hwy Type |
Auto /MC |
Light Trucks |
Bus |
Single Unit |
Combination |
Total VMT |
|---|---|---|---|---|---|---|
|
1 |
230,142.388 |
58,827.182 |
1,893.698 |
10,951.156 |
18,043.832 |
319,858.256 |
|
Rural Arterial |
18,048.666 |
5,891.008 |
160.022 |
1,138.271 |
2,638.827 |
27,876.795 |
|
Rural Interstate |
13,333.829 |
3,447.334 |
191.004 |
831.124 |
4,769.184 |
22,572.475 |
|
Rural Other |
32,291.238 |
12,172.477 |
238.690 |
2,123.543 |
1,469.261 |
48,295.209 |
|
Urban Arterial |
80,633.485 |
18,019.783 |
695.006 |
3,290.113 |
3,184.486 |
105,822.872 |
|
Urban Interstate |
38,372.192 |
7,265.506 |
346.003 |
1,572.613 |
5,188.615 |
52,744.929 |
|
Urban Other |
47,462.978 |
12,031.074 |
262.973 |
1,995.491 |
793.459 |
62,545.975 |
|
2 |
102,317.575 |
19,369.021 |
669.198 |
3,683.845 |
3,284.450 |
129,324.089 |
|
Rural Arterial |
7,309.897 |
1,806.959 |
72.505 |
495.503 |
372.679 |
10,057.542 |
|
Rural Interstate |
4,695.168 |
1,014.173 |
56.251 |
280.643 |
533.630 |
6,579.864 |
|
Rural Other |
8,599.914 |
2,446.979 |
76.038 |
603.400 |
298.473 |
12,024.805 |
|
Urban Arterial |
41,002.226 |
7,024.977 |
214.561 |
1,106.878 |
608.372 |
49,957.013 |
|
Urban Interstate |
24,294.251 |
3,568.661 |
185.803 |
702.945 |
1,347.966 |
30,099.626 |
|
Urban Other |
16,416.120 |
3,507.272 |
64.039 |
494.476 |
123.331 |
20,605.238 |
|
3 |
831,798.463 |
226,999.903 |
6,274.314 |
38,911.724 |
62,443.344 |
1,166,427.749 |
|
Rural Arterial |
99,045.487 |
33,847.309 |
853.946 |
6,020.198 |
9,954.758 |
149,721.698 |
|
Rural Interstate |
60,807.820 |
16,954.380 |
784.441 |
3,449.638 |
20,170.334 |
102,166.613 |
|
Rural Other |
104,195.560 |
38,837.777 |
922.285 |
6,881.630 |
4,778.102 |
155,615.355 |
|
Urban Arterial |
286,972.423 |
68,991.874 |
1,622.023 |
11,128.811 |
9,259.945 |
377,975.075 |
|
Urban Interstate |
128,970.507 |
30,297.857 |
1,016.417 |
5,226.790 |
14,737.913 |
180,249.485 |
|
Urban Other |
151,806.666 |
38,070.707 |
1,075.202 |
6,204.656 |
3,542.292 |
200,699.523 |
|
4 |
69,962.445 |
18,001.568 |
99.375 |
1,660.805 |
4,823.793 |
94,547.987 |
|
Rural Arterial |
9,394.728 |
2,931.631 |
20.265 |
247.230 |
915.966 |
13,509.819 |
|
Rural Interstate |
3,624.472 |
857.857 |
12.693 |
104.191 |
689.670 |
5,288.884 |
|
Rural Other |
7,512.484 |
3,107.282 |
4.546 |
252.310 |
488.709 |
11,365.331 |
|
Urban Arterial |
29,725.355 |
5,692.169 |
33.571 |
581.899 |
1,268.242 |
37,301.237 |
|
Urban Interstate |
11,398.468 |
2,601.995 |
28.300 |
267.274 |
1,425.988 |
15,722.025 |
|
Urban Other |
8,306.937 |
2,810.635 |
- |
207.901 |
35.218 |
11,360.691 |
|
5 |
187,276.324 |
40,164.319 |
1,585.871 |
8,858.397 |
14,365.355 |
252,250.265 |
|
Rural Arterial |
29,166.287 |
7,896.345 |
280.810 |
2,031.508 |
3,106.958 |
42,481.908 |
|
Rural Interstate |
14,100.153 |
2,980.894 |
194.054 |
919.745 |
4,758.350 |
22,953.198 |
|
Rural Other |
25,707.647 |
6,426.714 |
239.210 |
1,742.493 |
1,015.664 |
35,131.728 |
|
Urban Arterial |
63,167.416 |
11,524.719 |
478.089 |
2,527.600 |
2,065.579 |
79,763.404 |
|
Urban Interstate |
27,232.586 |
6,710.331 |
221.803 |
1,002.589 |
3,122.641 |
38,289.950 |
|
Urban Other |
27,902.235 |
4,625.315 |
171.904 |
634.462 |
296.162 |
33,630.077 |
|
6 |
55,933.755 |
27,815.150 |
462.544 |
2,797.015 |
7,502.814 |
94,511.279 |
|
Rural Arterial |
10,499.871 |
7,035.578 |
122.128 |
764.575 |
2,186.659 |
20,608.811 |
|
Rural Interstate |
6,606.522 |
3,026.633 |
54.393 |
351.011 |
3,018.520 |
13,057.079 |
|
Rural Other |
6,157.461 |
5,315.492 |
95.668 |
537.486 |
876.911 |
12,983.018 |
|
Urban Arterial |
18,840.905 |
7,427.276 |
109.021 |
580.893 |
603.087 |
27,561.182 |
|
Urban Interstate |
7,808.644 |
1,860.979 |
32.047 |
288.747 |
651.352 |
10,641.770 |
|
Urban Other |
6,020.352 |
3,149.191 |
49.287 |
274.303 |
166.286 |
9,659.419 |
|
7 |
39,203.433 |
16,268.682 |
163.380 |
3,263.318 |
2,655.273 |
61,554.084 |
|
Rural Arterial |
3,799.037 |
1,953.920 |
19.130 |
456.525 |
394.951 |
6,623.562 |
|
Rural Interstate |
3,302.918 |
1,381.109 |
17.362 |
308.120 |
591.747 |
5,601.255 |
|
Rural Other |
3,963.446 |
2,201.943 |
17.277 |
508.098 |
330.430 |
7,021.195 |
|
Urban Arterial |
15,509.561 |
5,674.335 |
58.761 |
1,083.654 |
604.165 |
22,930.476 |
|
Urban Interstate |
7,634.792 |
2,738.777 |
28.163 |
464.150 |
528.867 |
11,394.749 |
|
Urban Other |
4,993.679 |
2,318.598 |
22.687 |
442.771 |
205.113 |
7,982.847 |
|
8 |
68,639.914 |
26,488.572 |
761.506 |
6,869.749 |
9,289.014 |
112,048.756 |
|
Rural Arterial |
9,396.810 |
5,018.872 |
140.683 |
1,358.451 |
1,593.023 |
17,507.840 |
|
Rural Interstate |
6,487.680 |
3,155.938 |
74.891 |
748.073 |
3,545.053 |
14,011.634 |
|
Rural Other |
7,229.228 |
4,638.608 |
124.737 |
1,261.134 |
1,016.722 |
14,270.428 |
|
Urban Arterial |
21,745.139 |
6,551.912 |
194.217 |
1,467.093 |
995.912 |
30,954.273 |
|
Urban Interstate |
9,527.176 |
3,884.008 |
63.028 |
1,031.525 |
1,668.656 |
16,174.393 |
|
Urban Other |
14,253.881 |
3,239.235 |
163.950 |
1,003.473 |
469.650 |
19,130.188 |
|
9 |
260,482.111 |
104,720.560 |
1,615.655 |
17,133.808 |
28,068.647 |
412,020.781 |
|
Rural Arterial |
31,553.921 |
16,696.547 |
233.001 |
3,314.790 |
6,600.044 |
58,398.303 |
|
Rural Interstate |
18,920.528 |
7,625.758 |
225.897 |
1,444.271 |
7,812.748 |
36,029.202 |
|
Rural Other |
24,719.519 |
15,486.602 |
213.761 |
3,357.862 |
3,572.955 |
47,350.700 |
|
Urban Arterial |
110,004.623 |
36,168.935 |
507.190 |
5,199.245 |
4,839.161 |
156,719.154 |
|
Urban Interstate |
40,774.431 |
13,053.516 |
245.108 |
2,077.673 |
4,329.993 |
60,480.721 |
|
Urban Other |
34,509.089 |
15,689.201 |
190.698 |
1,739.968 |
913.746 |
53,042.701 |
|
10 |
238,897.915 |
62,432.858 |
1,229.024 |
10,830.288 |
12,881.574 |
326,271.659 |
|
Rural Arterial |
15,978.958 |
5,763.398 |
133.389 |
1,366.605 |
1,925.327 |
25,167.676 |
|
Rural Interstate |
10,489.477 |
3,444.831 |
63.402 |
811.895 |
2,802.008 |
17,611.613 |
|
Rural Other |
9,758.448 |
3,722.067 |
98.764 |
692.820 |
468.759 |
14,740.859 |
|
Urban Arterial |
123,835.992 |
29,261.720 |
538.559 |
5,189.753 |
4,373.754 |
163,199.779 |
|
Urban Interstate |
51,892.235 |
12,148.063 |
192.499 |
1,904.365 |
2,612.487 |
68,749.649 |
|
Urban Other |
26,942.805 |
8,092.778 |
202.411 |
864.849 |
699.240 |
36,802.083 |
|
Grand Total |
2,084,654.324 |
601,087.814 |
14,754.565 |
104,960.105 |
163,358.097 |
2,968,814.904 |
Splitting VMT among States, Highway Functional Classes, and 13 FHWA Vehicle Classes
The USDOT study team used available 2012 and 2013 classification data in the newer "TMAS" format, as well as some 2011 and 2012 classification data in the older "VTRIS" format. We processed all the files and summarized total counts by the 13 FHWA vehicle classes for each station. We obtained data from a total of 1,756 classification stations, although some of the stations had much less than the hoped for 24/7/365 data. We used station description files to assign a highway functional class to each station in each State and compiled tables of total vehicle counts for each functional class and State. After assembling this data, we found that the data covered about 40 percent of the functional class / state combination, so we opted to use older, more complete data to cover the gaps. Using the combination of new and old data as well as observed differences in truck percentages as we move to the lower functional classes, we derived a preliminary (unadjusted) estimate of vehicle class proportions for the 13 classes on each highway functional class in each State. FHWA publishes annual estimates of travel by highway type and state (VM-2 table). We applied the preliminary set of vehicle class proportions to the traffic volumes from the January 2014 FHWA website version of the 2012 VM-2 table to convert the vehicle class proportions into preliminary estimates of VMT. As described in the next section, we used WIM data to refine and expand these preliminary estimates. Splitting VMT into 28 Vehicle Classes Used in CTSW Study In FHWA's classification data, vehicles are classified based solely upon the measured number of vehicle axles and their axle spacings. The advantage WIM measurements offer is that the number of vehicle axles and their spacing are also measured along with the weight of each axle. On the other hand, virtually all the WIM data we obtained came from vehicles traveling in only one lane of a multilane facility, so was very likely biased in the population of vehicles observed. Further, light vehicles were usually filtered out of weight compilations, so we could not use WIM data to derive truck percentage estimates. The team assumed, however, that the right-lane / other-lanes biases were similar for subclasses of the 13 FHWA classes, thus allowing reasonably accurate splitting or reassignment of each class.
As with past studies that have evaluated the effects of truck size and weight policy, the 2014 CTSW Study needs to classify heavier trucks into more categories than are included in the 13-class scheme to allow evaluation of differential changes in travel patterns for particular vehicle configurations (seven-axle triples vs. nine-axle triples, for example). Further, the axle weight distributions for subsets of some of the 13 classes are apt to vary substantially among themselves. Better differentiation among the subsets allows a higher degree of precision in the analysis.
The 2014 CTSW Study used 28 vehicle classes, listed in the table below.
|
Class |
Name |
Description |
|---|---|---|
|
1 |
Auto / MC |
Auto and motorcycle |
|
2 |
LT4 |
Light truck with 4 tires |
|
3 |
SU2 |
Single-unit truck with 6 tires |
|
4 |
SU3 |
Single-unit truck with 3 axles |
|
5 |
SU4+ |
Single-unit truck with 4 or more axles |
|
6 |
CS3 |
Tractor-semitrailer with 3 axles |
|
7 |
CS4 |
Tractor-semitrailer with 4 axles |
|
8 |
3S2 |
3-axle tractor, 2-axle tandem-axle semitrailer |
|
9 |
Oth CS5 |
Other tractor semitrailer with 5 axles |
|
10 |
3S3 |
3-axle tractor, 3-axle tridem-axle semitrailer |
|
11 |
Oth CS6 |
Other tractor semitrailer with 6 axles |
|
12 |
CS7+ |
Tractor-semitrailer with 7 or more axles |
|
13 |
CT3/4 |
Truck-trailer with 3 or 4 axles |
|
14 |
CT5 |
Truck-trailer with 5 axles |
|
15 |
CT6 |
Truck-trailer with 6 axles |
|
16 |
CT7 |
Truck-trailer with 7 axles |
|
17 |
CT8 |
Truck-trailer with 8 axles |
|
18 |
CT9+ |
Truck-trailer with 9 or more axles |
|
19 |
DS5 |
Double trailer truck with 5 axles |
|
20 |
DS6 |
Double trailer truck with 6 axles |
|
21 |
DS7 |
Double trailer truck with 7 axles |
|
22 |
DS8 |
Double trailer truck with 8 axles |
|
23 |
DS9+ |
Double trailer truck with 9 or more axles |
|
24 |
TS7 |
Triple trailer truck with 7 axles |
|
25 |
TS8 |
Triple trailer truck with 8 axles |
|
26 |
TS9+ |
Triple trailer truck with 9 or more axles |
|
27 |
Bus2 |
Bus with 2 axles |
|
28 |
Bus3 |
Bus with 3 axles |
The team constructed a detailed vehicle classification algorithm that built upon the weight/spacing algorithm used for compiling the LTPP WIM data. By using a combination of axle weights and spacings, we could much more accurately assign vehicles to the correct class.
The team drew upon two sources of WIM data: (1) data submitted to FHWA by each State as part of its traffic monitoring program, and (2) data collected at each LTPP WIM site and compiled by FHWA. The state-supplied data came from 451 WIM stations and included nearly 400 million vehicle observations; the LTPP data included about 250 million weight observations from 19 sites. Most WIM data were from 2010 to 2013.
The team applied the classification algorithm to all the truck weight observations and cross-tabulated the axle-spacing-only, initial 13 classes with the assignment of the same vehicles based on the 28-class, weight-and-spacing algorithm. We developed a cross-tabulation array for each State that allowed us to reassign the 13-class VMT estimates into more accurate 28-class estimates for each State and functional class. Three States, Alaska, North Carolina, and North Dakota, did not have sufficient WIM data to develop their own reassignment arrays, so we used substitute reassignment arrays from the nearby states of Washington, South Carolina, and South Dakota, respectively.
The team proportionally adjusted each of the 28 vehicle class VMTs in each State and functional class such that we precisely matched the FHWA control totals for each region and highway type.
Adjusting VMT to 2011 Published Control Totals
In addition to the VM-2 table described in the previous section, FHWA publishes annual estimates of travel by broad type of vehicle in the VM-1 table. Since the 2014 CTSW Study had settled upon 2011 as the year of analysis, the study team adjusted the 2012 control total estimates to match the published control totals for 2011. Because the year-to-year changes were relatively small, and because we had relatively little interest in travel estimates for the predominant two broad classes (auto/motorcycle and light truck), the team opted for an easily-replicable, three-step adjustment approach rather than a more complicated iterative-proportional-splitting technique.
FHWA first multiplied the VMT estimates for all vehicles in each state and functional class by the ratio of the corresponding 2011 to 2012 VM-2 table estimates. We then calculated ratios of VMT from the 2011 VM1 table (the version posted on the FHWA website on January 22, 2014) to the grand totals for all the vehicles in each broad type of vehicle. Finally, we adjusted auto / motorcycle VMT as needed so that total VMT for all vehicles in each FHWA calibration cell (region / highway type combination) remained unchanged.
Operating Weight and Axle Weight Distributions
The study team used the same WIM data described in a previous section to derive operating gross weight (OGW) and axle weight distributions for use in various phases of the 2014 CTSW Study. The OGW distributions consist of estimates of proportions of VMT in each 2,000-lb. OGW increment with upper bounds from 2,000 to 198,000 lbs., as well as a final increment of 198,001 lbs. and up. There is a unique OGW distribution for each of the 10 regions. For individual vehicle classes, OGW distributions are assumed to be the same on all highway functional classes within a region. This assumption was necessary because there was insufficient WIM data to develop separate OGW distributions by highway class. The two graphs below provide a good overview of the overall distribution of vehicle classes and operating weights considering all highway travel in the base year. The first graph excludes travel by light vehicles and two-axle trucks to highlight the larger truck classes. Note the dominance of the common 3-S2 configuration when considering all travel on all highways.
Figure G3. VMT by OGW and Truck Class, All Highways
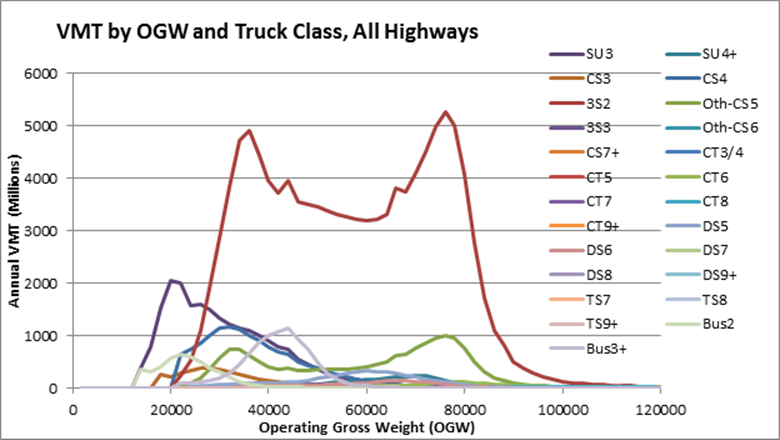
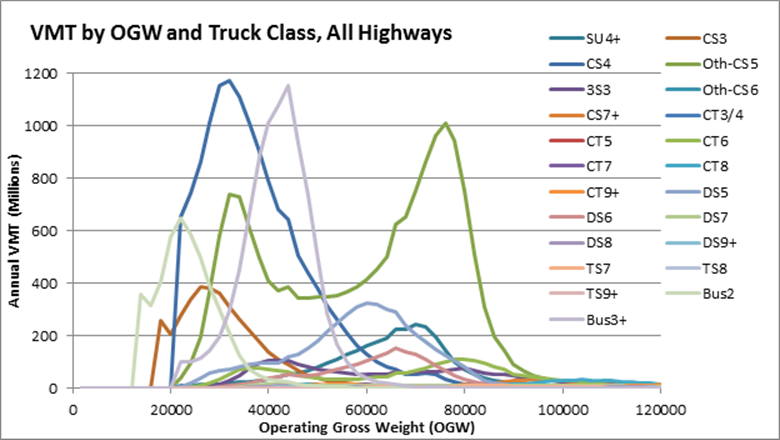
The next graph removes the two most common classes (SU3 and 3S2) to show the relative importance of the remaining truck classes.
Figure G4. VMT by OGW and Truck Class, All Highways without SU3 and 3S2
Axle weight distributions consist of numbers of axle per vehicle falling into each of four axle types (steering axle, single load axle, tandem load axle, and tridem load axle) and 40 weight groups for each type of axle (centered on 1,000-lb. categories for single axles, 2,000-lb. categories for tandem axles, and 3,000-lb. categories for tridem axles). For example, weight group 1 for single axles covers axles from 1 to 1,500 lbs.; group 2 includes axles from 1,501 to 2,500 lbs., and so on. Group 40 includes single axles operating at 39,501 lbs. and above. Tandem axle group 1 includes axles from 1 to 3,000 lbs., group 2 axles from 3,001 to 5,000 lbs., etc.
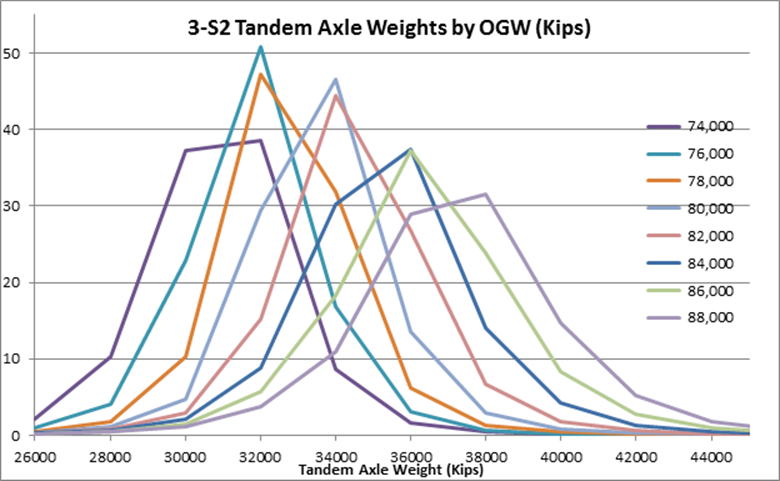
Each OGW of each vehicle class in each region has a unique axle weight and type distribution. The figure below illustrates a sample of tandem axle weight distributions for selected 3-S2 vehicles in one traffic region. Note the range of prevalent axle weights within a given operating weight group-an important factor to consider when evaluating the relative impacts of a particular configuration operating a particular gross vehicle weight.
Figure G5. 3-S2 Tandem Axle Weights by OGW (Kips)
For the bridge analysis, all axle weights and types for all vehicle classes are grouped together, and the 12 functional classes are grouped into three highway types for each of two regions. For the pavement analysis, the 28 vehicle classes are grouped into 8 classes, all OGWs in each class are grouped together, and the 12 functional classes are grouped into 3 highway types. Other phases of analysis require other groupings of the data.
previous | next