Office of Operations Freight Management and Operations

Comprehensive Truck Size and Weight Limits Study - Highway Safety and Truck Crash Comparative Analysis Technical Report

Appendix E: Results of the Vehicle Stability and Control Analysis

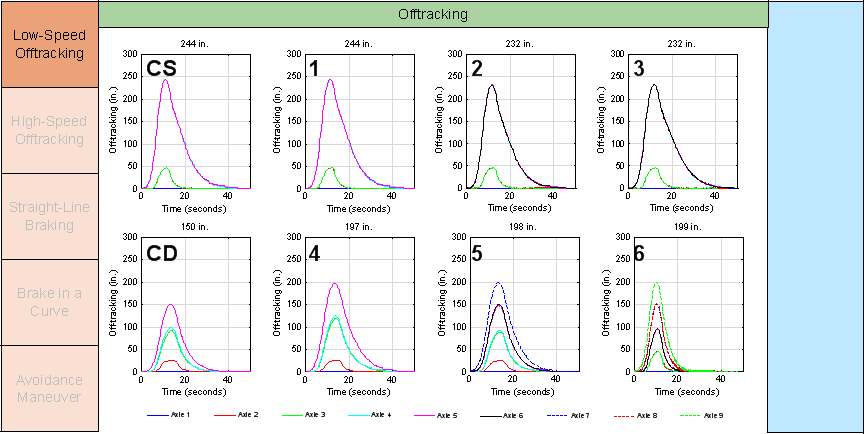
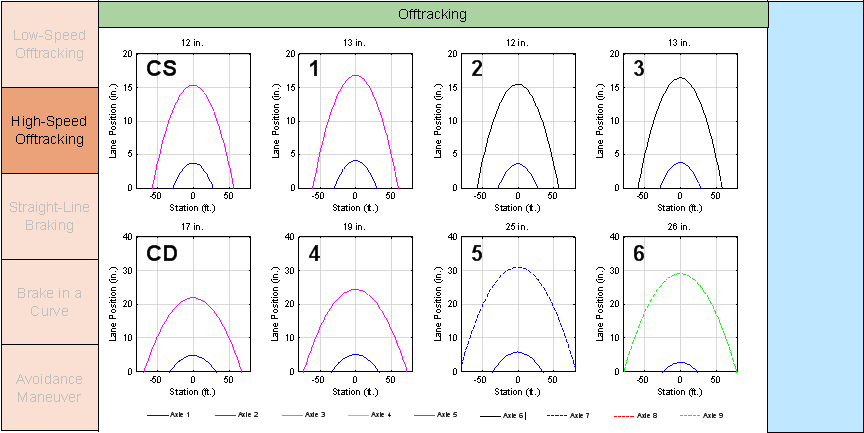
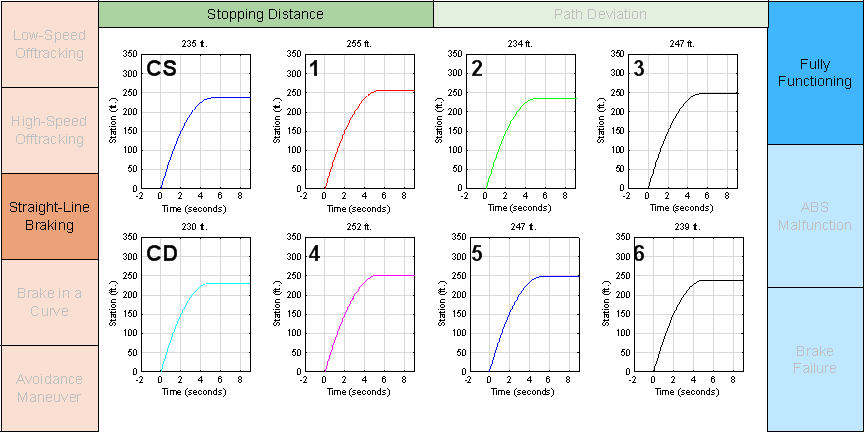
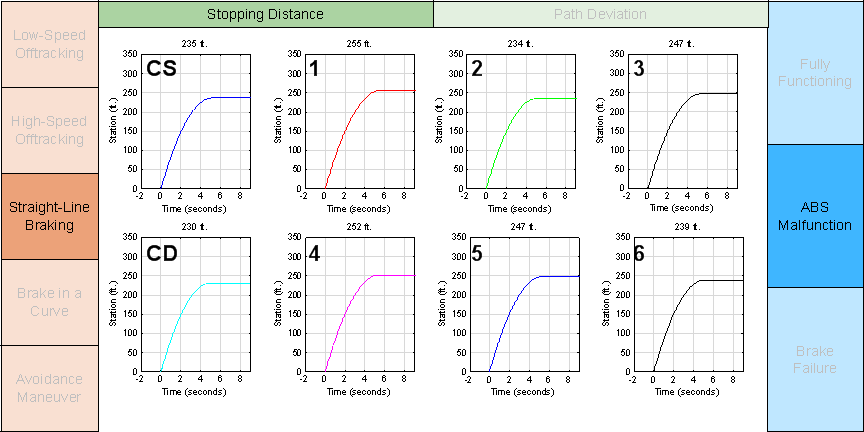
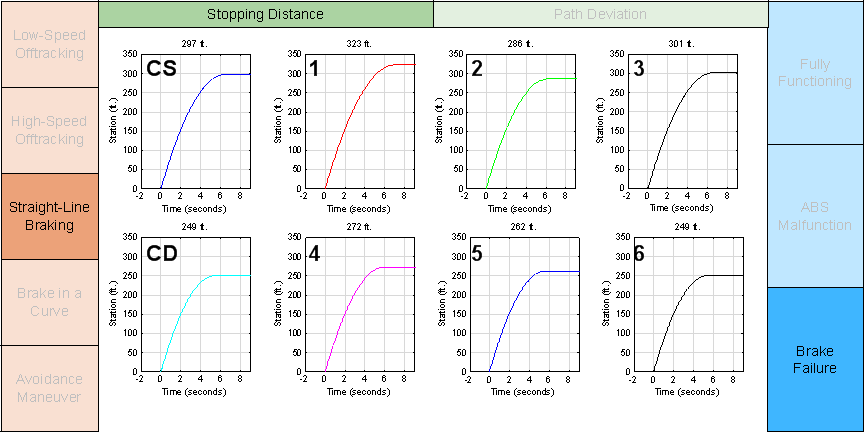
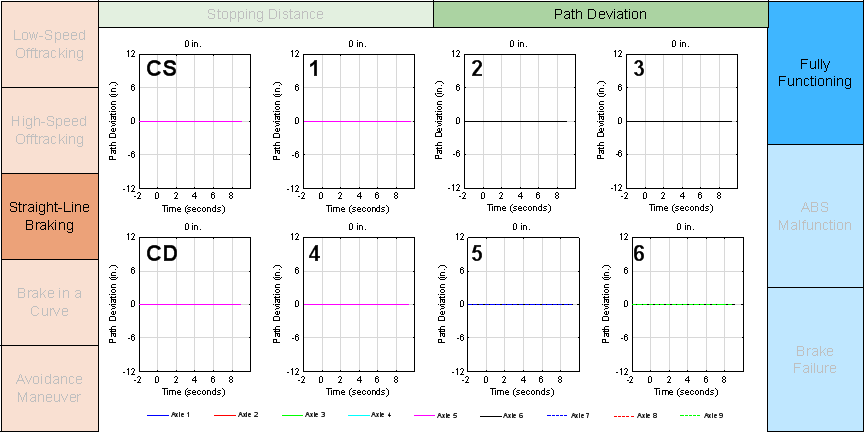
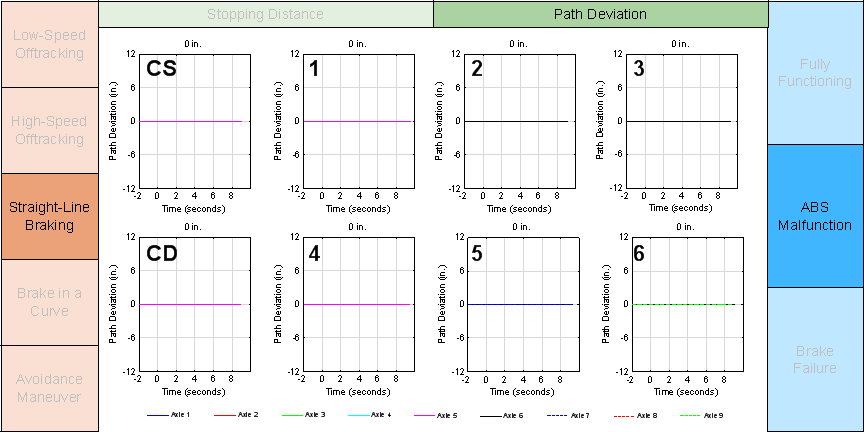
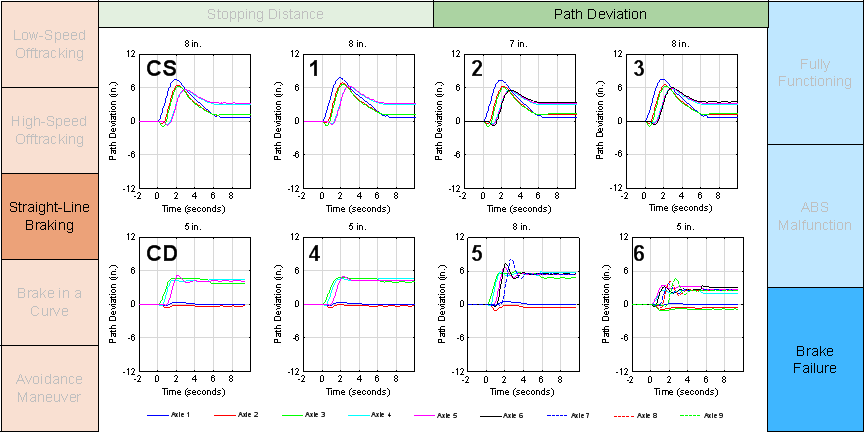
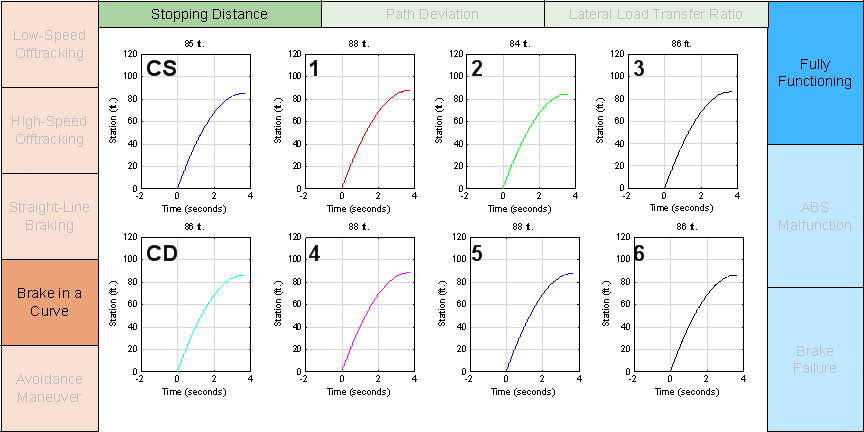
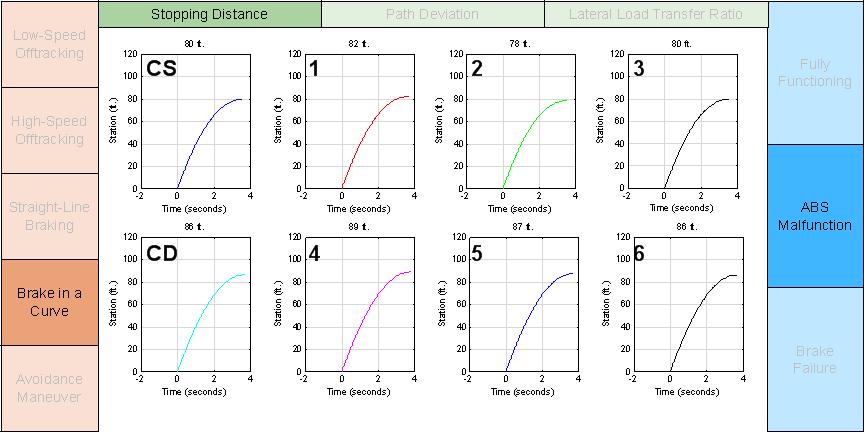
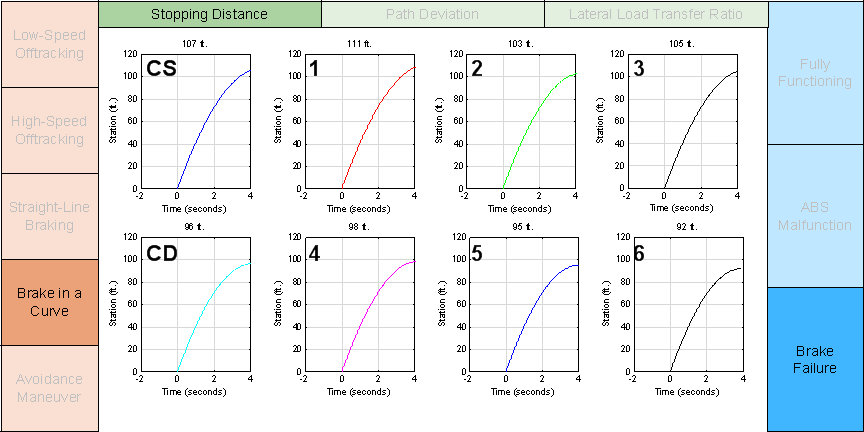
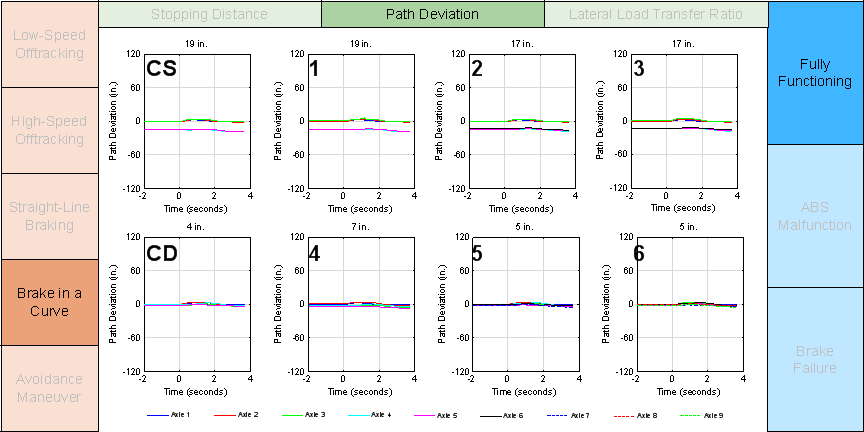
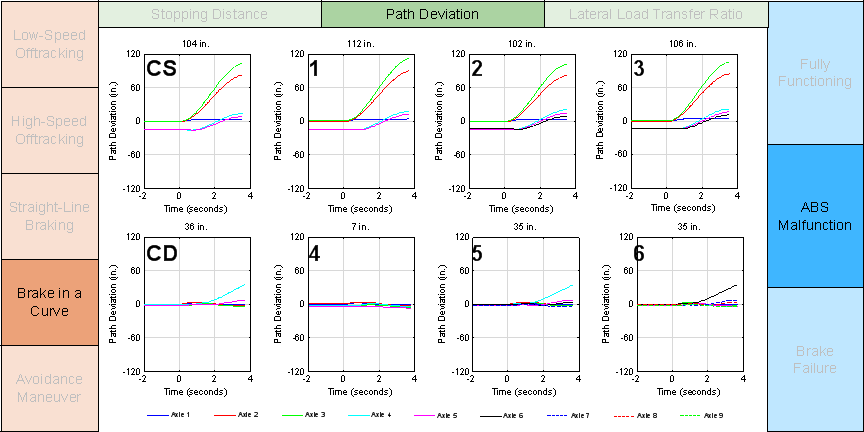
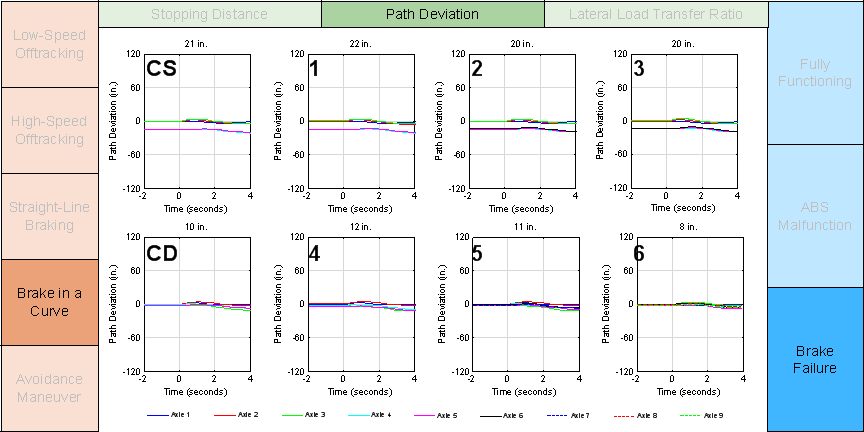
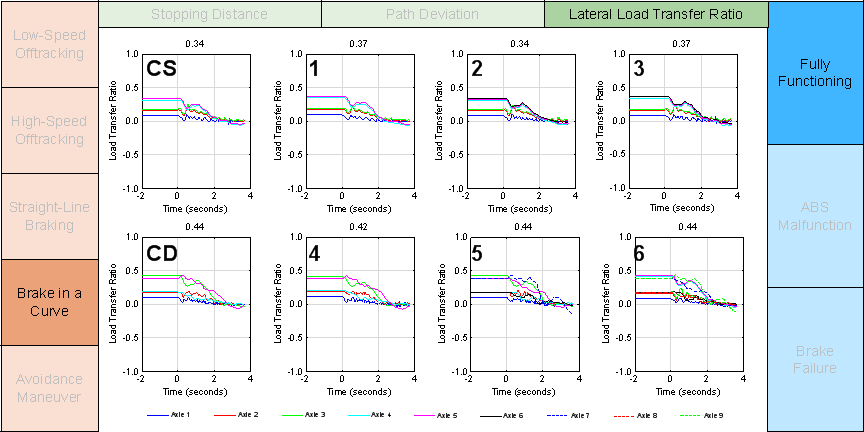
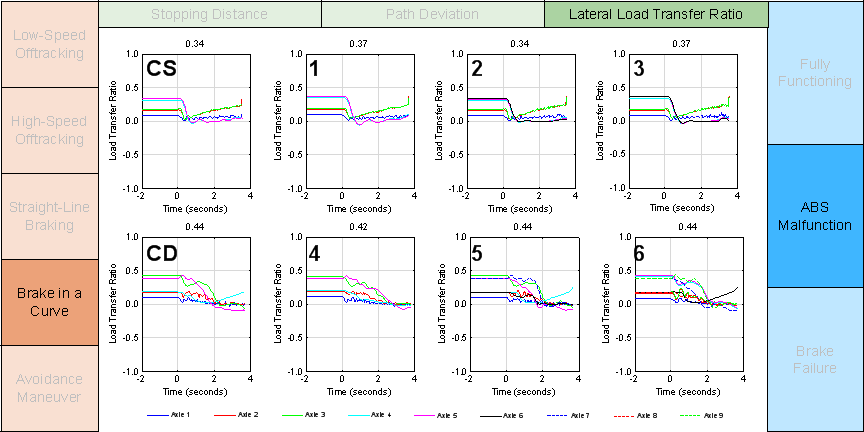
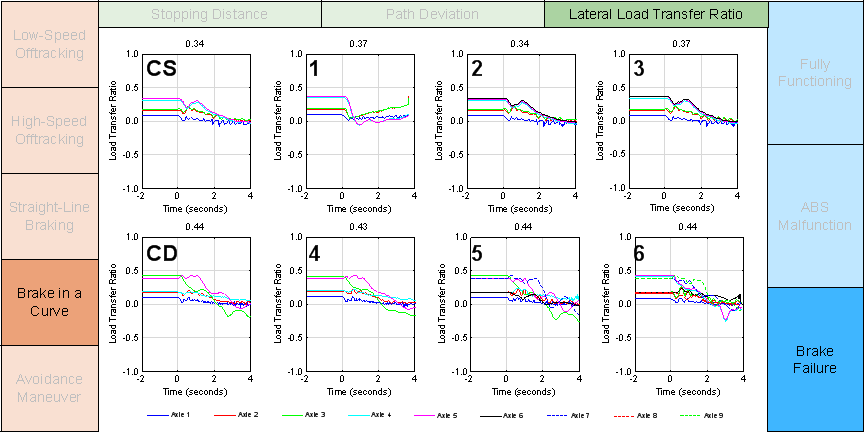
This appendix documents the performance metrics used to study vehicle stability and control for five maneuvers that were simulated in TruckSim®. Each run of TruckSim® produced an output data file. These files were analyzed with Matlab to calculate the desired performance parameters. Table 24 in Section 3.2 of the main text lists the performance metrics that were extracted from each of the five maneuvers and the peril that each is intended to assess. Appendix C documents how these performance metrics were calculated.

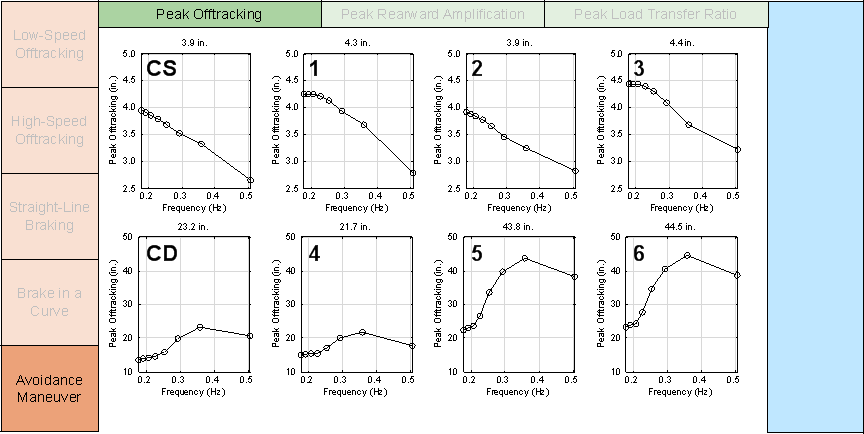
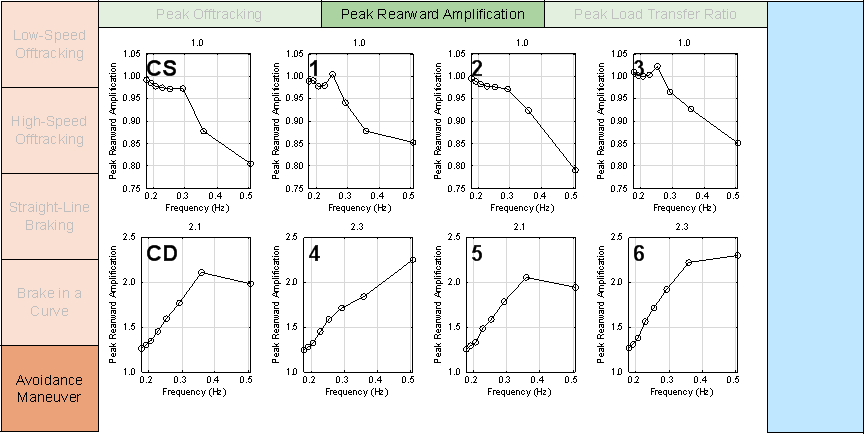
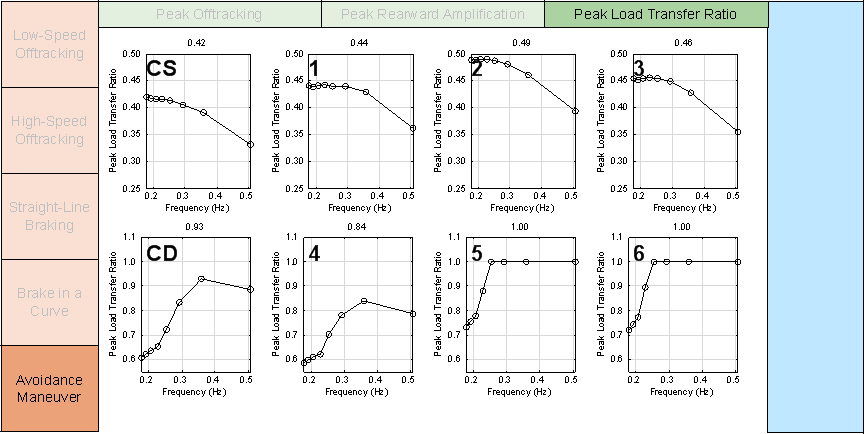
The following pages are graphs of various performance metrics for each simulated test maneuver. On each page, the test maneuver is indicated on the left, the performance metric is indicated on the top, and additional test parameters such as brake failure is indicated on the right. The eight plots on every page correspond to the eight vehicle configurations under investigation.

The value above the plot is the result of the simulation. It is the number in the corresponding table of results in Section 3.3 of the main text.

The avoidance maneuver required a family of similar paths. Specifically, eight lane change widths (3, 6, 9, 12, 15, 18, 21, and 24 ft.) were simulated. These eight lane changes correspond to eight excitation frequencies, as shown in Table C1 in Appendix C. From these eight excitation frequencies, the highest responses (i.e. peak off-tracking, peak rearward amplification, and peak load transfer ratio) are reported in this appendix and in Table 29 of the main text.

Figure E-1

Figure E-1 is a graph of a performance metric for a simulated test maneuver. This graph matrix is low-speed offtracking by offtracking by nothing for other test parameters.

Figure E-2

Figure E-2 is a graph of a performance metric for a simulated test maneuver. This graph matrix is high-speed offtracking by offtracking by nothing for other test parameters.

Figure E-3

Figure E-3 is a graph of a performance metric for a simulated test maneuver. This graph matrix is straight-line braking by stopping distance by fully functioning.

Figure E-4

Figure E-4 is a graph of a performance metric for a simulated test maneuver. This graph matrix is straight-line braking by stopping distance by ABS malfunction.

Figure E-5

Figure E-5 is a graph of a performance metric for a simulated test maneuver. This graph matrix is straight-line braking by stopping distance by brake failure.

Figure E-6

Figure E-6 is a graph of a performance metric for a simulated test maneuver. This graph matrix is straight-line braking by path deviation by fully functioning.

Figure E-7

Figure E-7 is a graph of a performance metric for a simulated test maneuver. This graph matrix is straight-line braking by path deviation by ABS malfunction.

Figure E-8

Figure E-8 is a graph of a performance metric for a simulated test maneuver. This graph matrix is straight-line braking by path deviation by brake failure.

Figure E-9

Figure E-9 is a graph of a performance metric for a simulated test maneuver. This graph matrix is brake in a curve by stopping distance by fully function.

Figure E-10

Figure E-10 is a graph of a performance metric for a simulated test maneuver. This graph matrix is brake in a curve by stopping distance by ABS malfunction.

Figure E-11

Figure E-11 is a graph of a performance metric for a simulated test maneuver. This graph matrix is brake in a curve by stopping distance by brake failure.

Figure E-12

Figure E-12 is a graph of a performance metric for a simulated test maneuver. This graph matrix is brake in a curve by path deviation by fully function.

Figure E-13

Figure E-13 is a graph of a performance metric for a simulated test maneuver. This graph matrix is brake in a curve by path deviation by ABS malfunction.

Figure E-14

Figure E-14 is a graph of a performance metric for a simulated test maneuver. This graph matrix is brake in a curve by path deviation by brake failure.

Figure E-15

Figure E-15 is a graph of a performance metric for a simulated test maneuver. This graph matrix is brake in a curve by lateral load transfer ratio by fully function.

Figure E-16

Figure E-16 is a graph of a performance metric for a simulated test maneuver. This graph matrix is brake in a curve by lateral load transfer ratio by ABS malfunction.

Figure E-17

Figure E-17 is a graph of a performance metric for a simulated test maneuver. This graph matrix is brake in a curve by lateral load transfer ratio by brake failure.

Figure E-18

Figure E-18 is a graph of a performance metric for a simulated test maneuver. This graph matrix is avoidance maneuver by peak offtracking by nothing for other test parameters.

Figure E-19

Figure E-19 is a graph of a performance metric for a simulated test maneuver. This graph matrix is avoidance maneuver by peak rearward amplification by nothing for other test parameters.

Figure E-20

Figure E-20 is a graph of a performance metric for a simulated test maneuver. This graph matrix is avoidance maneuver by peak load transfer ratio by nothing for other test parameters.

previous | next
Office of Operations