Comprehensive Truck Size and Weight Limits Study - Bridge Structure Comparative Analysis Technical Report
Appendix C: Load Ratings and Analysis
LOAD RATING RESULTS
| 3-S2 | Scenario #1 | Scenario #2 | Scenario #3 | 2-S1-2 | Scenario #4 | Scenario #5 | Scenario #6 | ||
|---|---|---|---|---|---|---|---|---|---|
| ALL BRIDGES | AVERAGE | 3.816 | 3.442 | 3.228 | 2.984 | 4.591 | 3.862 | 4.094 | 3.133 |
| MAX | 19.86 | 18.06 | 17.38 | 16.06 | 28.07 | 22.55 | 26.26 | 20.10 | |
| MIN | 0.707 | 0.626 | 0.591 | 0.541 | 0.806 | 0.728 | 0.660 | 0.516 | |
| TOTAL | 463 | 463 | 463 | 463 | 463 | 463 | 463 | 463 | |
| # RF < 1.0 | 4 | 7 | 8 | 10 | 1 | 2 | 3 | 8 | |
| IHS BRIDGES | AVERAGE | 3.679 | 3.319 | 3.106 | 2.876 | 4.330 | 3.697 | 3.806 | 2.911 |
| MAX | 13.58 | 12.27 | 11.73 | 10.99 | 15.40 | 13.70 | 13.12 | 9.35 | |
| MIN | 0.997 | 0.896 | 0.837 | 0.781 | 1.136 | 1.014 | 0.922 | 0.723 | |
| TOTAL | 150 | 150 | 150 | 150 | 150 | 150 | 150 | 150 | |
| # RF < 1.0 | 1 | 1 | 1 | 2 | 0 | 0 | 1 | 3 | |
| OTHER BRIDGES ON THE NHS | AVERAGE | 3.881 | 3.501 | 3.286 | 3.036 | 4.715 | 3.941 | 4.232 | 3.240 |
| MAX | 19.86 | 18.06 | 17.38 | 16.06 | 28.07 | 22.55 | 26.26 | 20.10 | |
| MIN | 0.707 | 0.626 | 0.591 | 0.541 | 0.806 | 0.728 | 0.660 | 0.516 | |
| TOTAL | 313 | 313 | 313 | 313 | 313 | 313 | 313 | 313 | |
| # RF < 1.0 | 3 | 6 | 7 | 8 | 1 | 2 | 2 | 5 | |
Figure STR-1: Comparison of average flexural rating factors for different truck types.
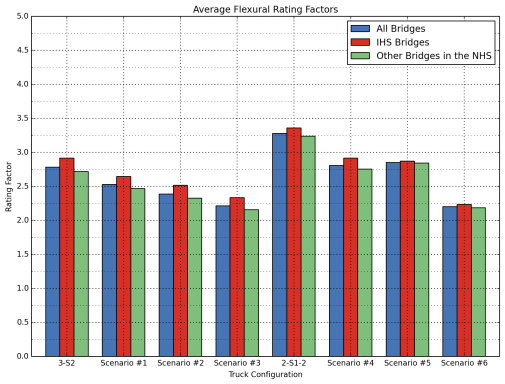
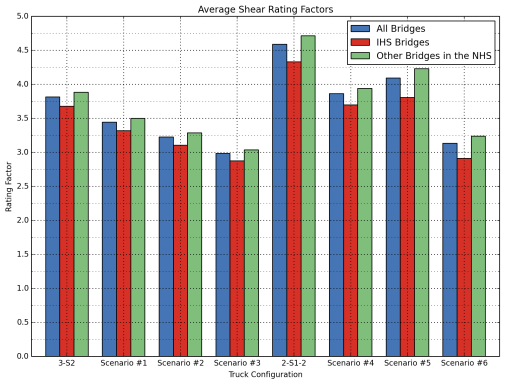
Figure STR-2: Comparison of average shear rating factors for different truck types.
COMPARISONS OF BASELINE TRUCKS WITH OTHER VEHICLES (FLEXURAL)
Figure STR-3: Comparison of flexural rating factors for all bridges (compared with 3-S2)
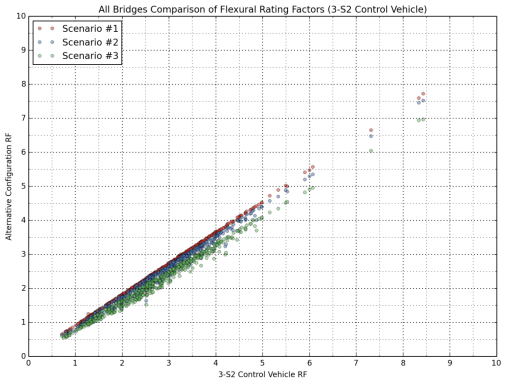
Figure STR-4: Comparison of flexural rating factors for all bridges (compared with 2-S1-2)
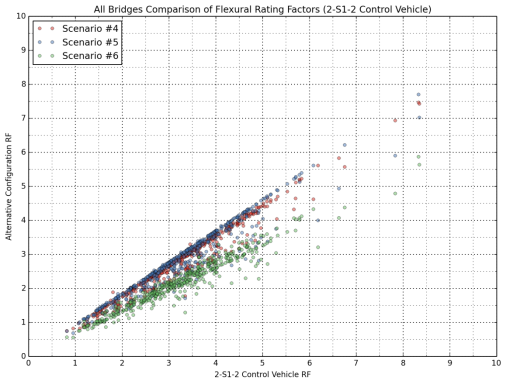
Figure STR-5: Comparison of flexural rating factors for IHS bridges (compared with 3-S2)
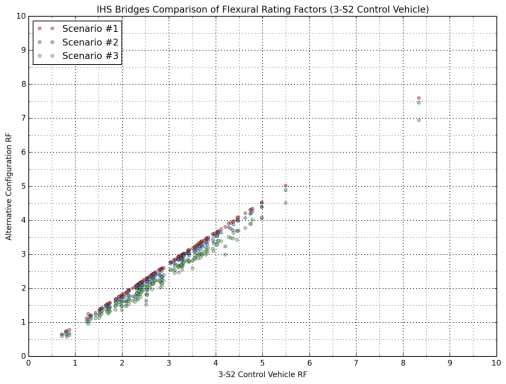
Figure STR-6: Comparison of flexural rating factors for IHS bridges (compared with 2-S1-2)
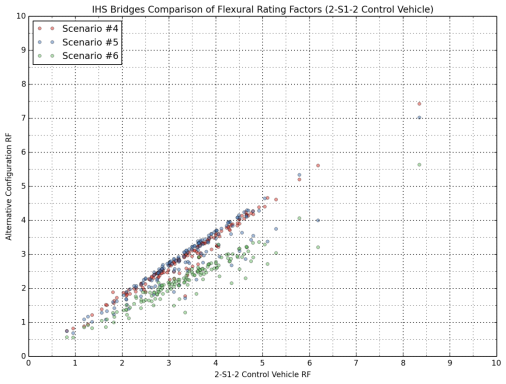
Figure STR-7: Comparison of flexural rating factors for other bridges on the NHS (compared with 3-S2)
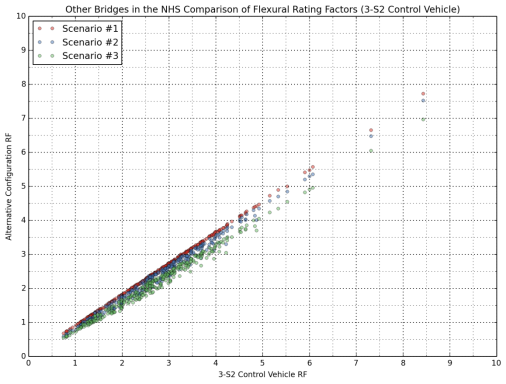
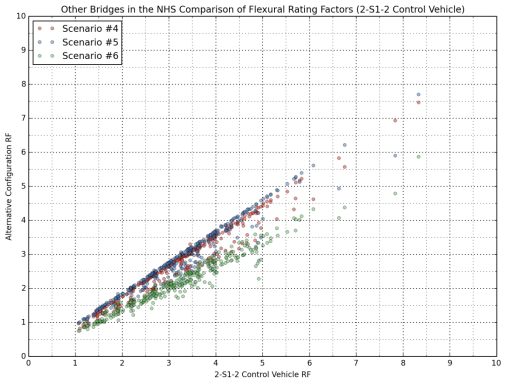
Figure STR-8: Comparison of flexural rating factors for other bridges on the NHS (compared with 2-S1-2)
COMPARISONS OF BASELINE TRUCKS WITH OTHER VEHICLES (SHEAR)
Figure STR-9: Comparison of shear rating factors for all bridges (compared with 3-S2)
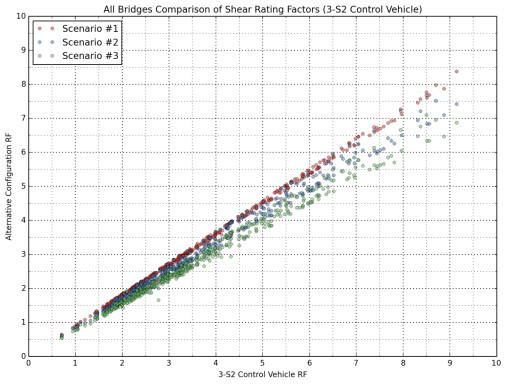
Figure STR-10: Comparison of shear rating factors for all bridges (compared with 2-S1-2)
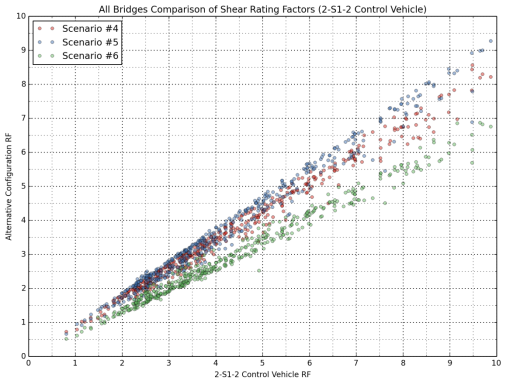
Figure STR-11: Comparison of shear rating factors for IHS bridges (compared with 3-S2)
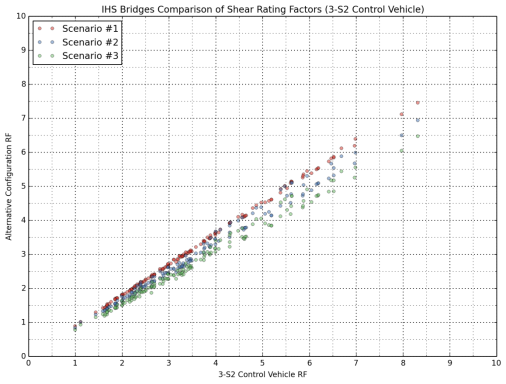
Figure STR-12: Comparison of shear rating factors for IHS bridges (compared with 2-S1-2)
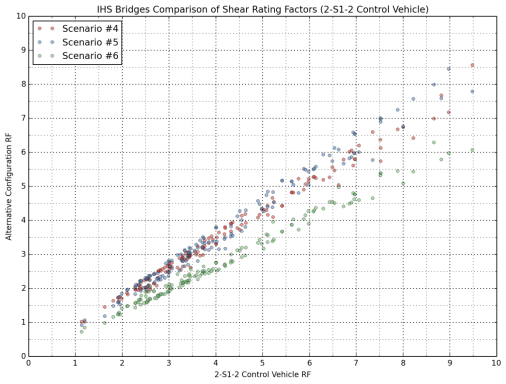
Figure STR-13: Comparison of shear rating factors for other bridges on the NHS (compared with 3-S2)
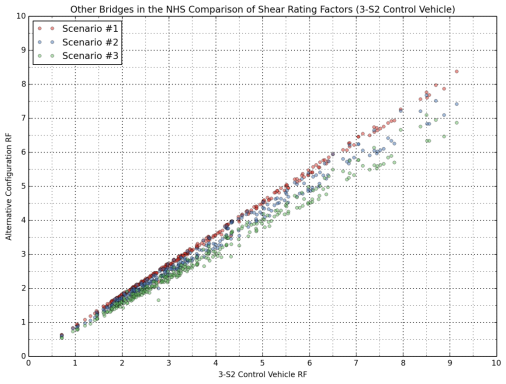
Figure STR-14: Comparison of shear rating factors for other bridges on the NHS (compared with 2-S1-2)
CUMULATIVE FREQUENCY DISTRIBUTION FUNCTIONS FOR RATING RESULTS (ALL BRIDGES)
Figure STR-15: Cumulative distribution of flexural rating factors of all bridges (3-S2, Scenarios 1-3).
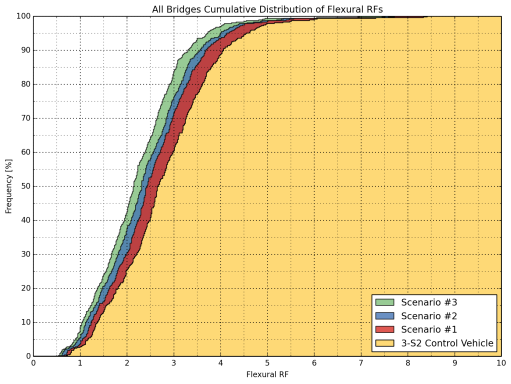
Figure STR-16: Cumulative distribution of flexural rating factors of all bridges (2-S1-2, Scenarios 4-6)
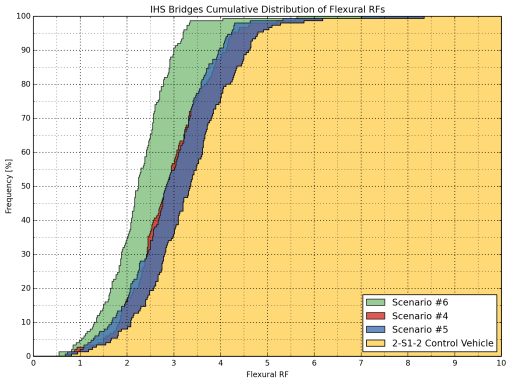
Figure STR-17: Cumulative distribution of shear rating factors of all bridges (3-S2, Scenarios 1 - 3)
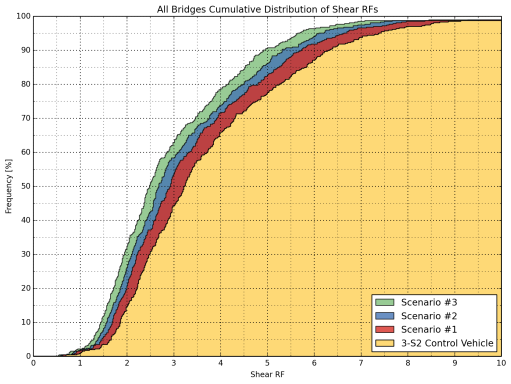
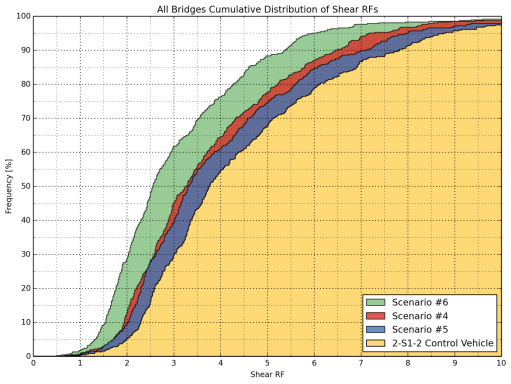
Figure STR-18: Cumulative distribution of shear rating factors of all bridges (2-S1-2, Scenarios 4 - 6).
CUMULATIVE FREQUENCY DISTRIBUTION FUNCTIONS FOR RATING RESULTS (INTERSTATE BRIDGES)
Figure STR-19: Cumulative distribution of flexural rating factors of IHS bridges (3-S2, Scenarios 1 - 3)
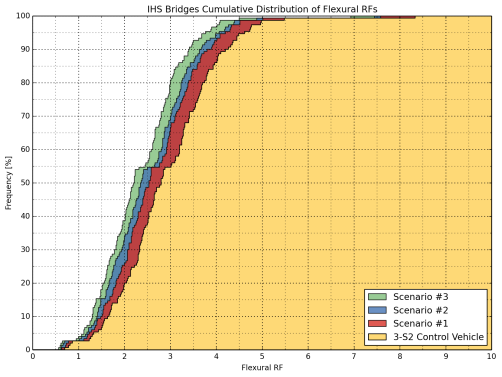
Figure STR-20: Cumulative distribution of flexural rating factors of IHS bridges (2-S1-2, Scenarios 4 - 6)
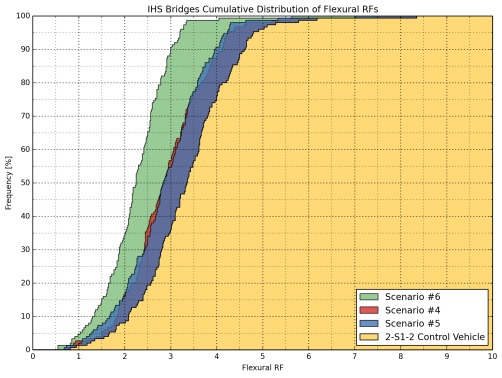
Figure STR-21: Cumulative distribution of shear rating factors of IHS bridges (3-S2, Scenarios 1 - 3)

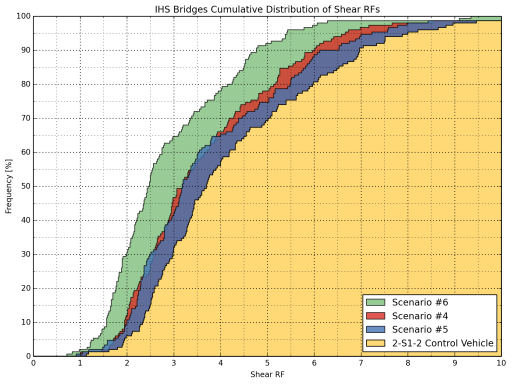
Figure STR-22: Cumulative distribution of shear rating factors of IHS bridges (2-S1-2, Scenarios 4 - 6)
CUMULATIVE FREQUENCY DISTRIBUTION FUNCTIONS FOR RATING RESULTS (OTHER BRIDGES ON THE NHS)
Figure STR-23: Cumulative distribution of flexural rating factors of other bridges on the NHS (3-S2, Scenarios 1-3)
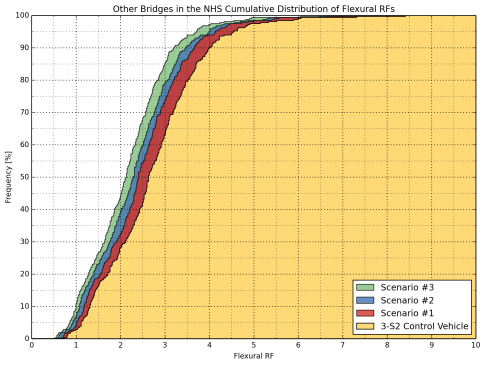
Figure STR-24: Cumulative distribution of flexural rating factors of other bridges on the NHS (2-S1-2, Scenarios 4 - 6)
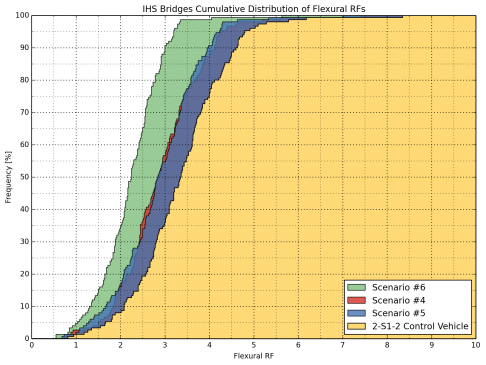
Figure STR-25: Cumulative distribution of shear rating factors of other bridges on the NHS (3-S2, Scenarios 1 - 3)
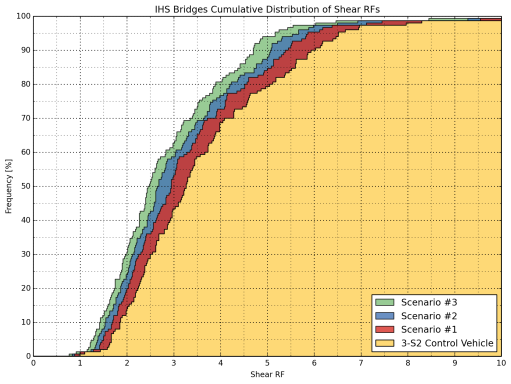
Figure STR-26: Cumulative distribution of shear rating factors of other bridges on the NHS (2-S1-2, Scenarios 4 - 6)

DISTRIBUTION OF NORMALIZED RATING RESULTS (ALL BRIDGES)
Figure STR-27: Distribution of normalized flexural rating factors for all bridges (3-S2, Scenario #1, #2 and #3)
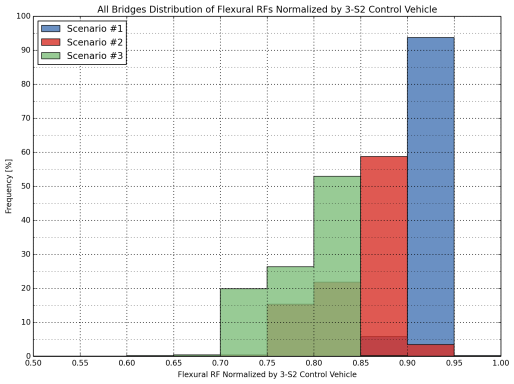
Figure STR-28: Distribution of normalized flexural rating factors for all bridges (2-S1-2, Scenario #4, #5 and #6)
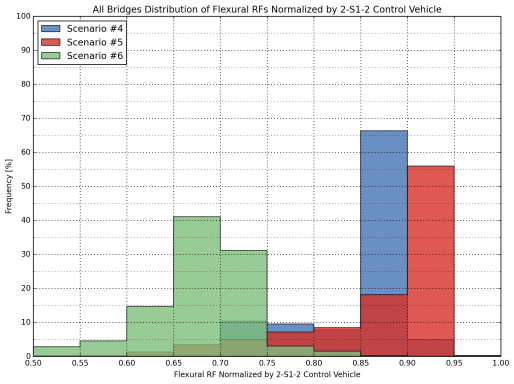
Figure STR-29: Distribution of normalized shear rating factors for all bridges (3-S2, Scenario #1, #2 and #3)
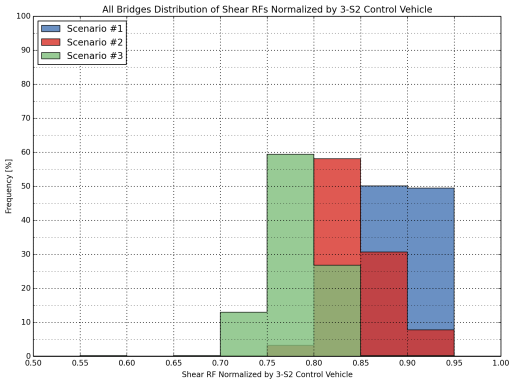
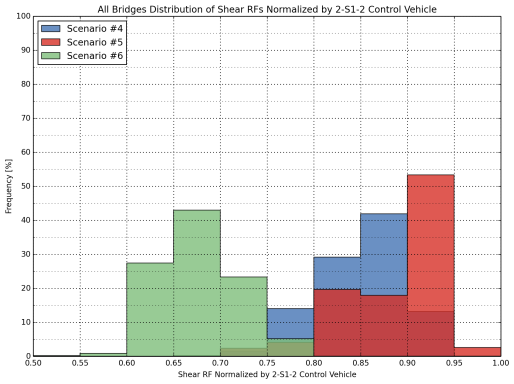
Figure STR-30: Distribution of normalized shear rating factors for all bridges (2-S1-2, Scenario #4, #5 and #6)
DISTRIBUTION OF NORMALIZED RATING RESULTS (IHS BRIDGES)
Figure STR-31: Distribution of normalized flexural rating factors for IHS Bridges (3-S2, Scenario #1, #2 and #3)
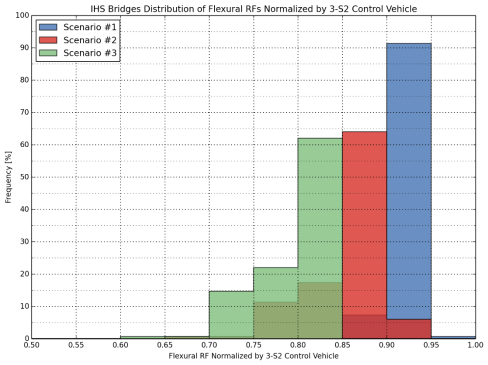
Figure STR-32: Distribution of normalized flexural rating factors for IHS bridges (2-S1-2, Scenario #4, #5 and #6).
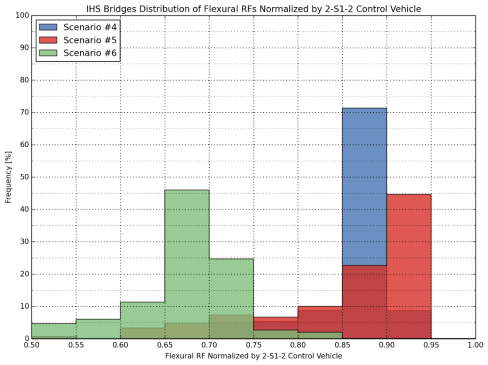
Figure STR-33: Distribution of normalized shear rating factors for IHS Bridges (3-S2, Scenario #1, #2 and #3)
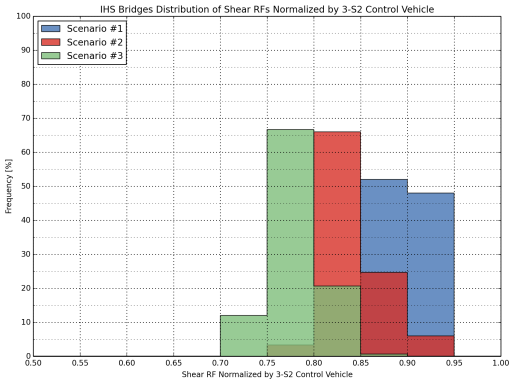
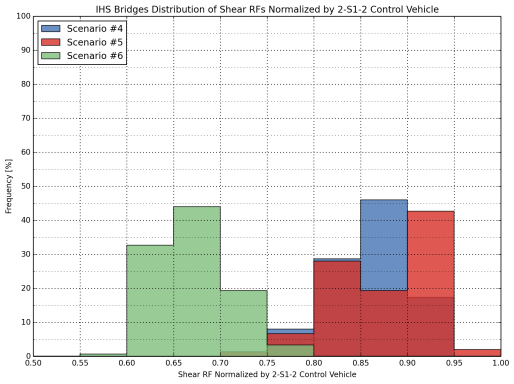
Figure STR-34: Distribution of normalized shear rating factors for IHS bridges (2-S1-2, Scenario #4, #5 and #6)
DISTRIBUTION OF NORMALIZED RATING RESULTS (OTHER BRIDGES
ON THE NHS)
Figure STR-35: Distribution of normalized flexural rating factors for other bridges on the NHS (3-S2, Scenario #1, #2 and #3)
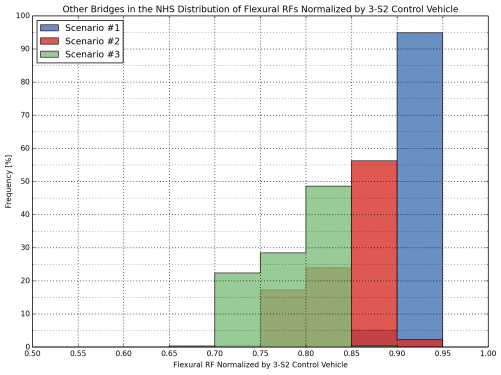
Figure STR-36: Distribution of normalized flexural rating factors for other bridges on the NHS (2-S1-2, Scenario #4, #5 and #6)
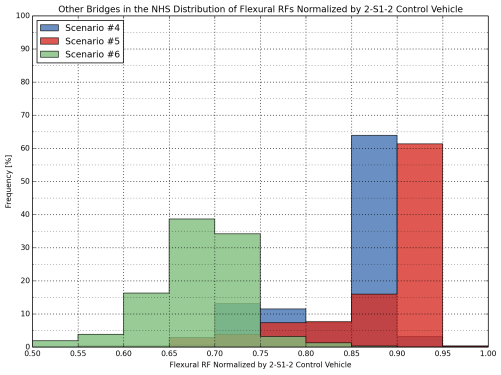
Figure STR-37: Distribution of normalized shear rating factors for other bridges on the NHS (3-S2, Scenario #1, #2 and #3)

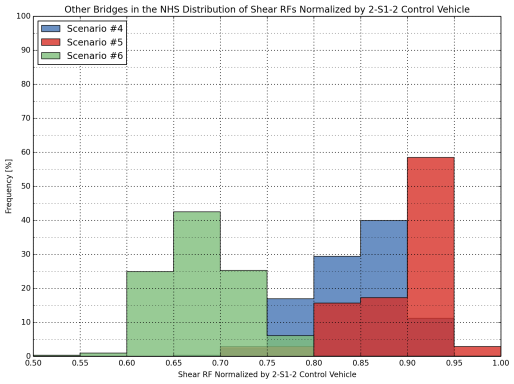
Figure STR-38: Distribution of normalized shear rating factors for other bridges on the NHS (2-S1-2, Scenario #4, #5 and #6)
LOAD RATING RESULTS FOR BRIDGE TYPES
| 3-S2 | Scenario #1 | Scenario #2 | Scenario #3 | 2-S1-2 | Scenario #4 | Scenario #5 | Scenario #6 | ||
|---|---|---|---|---|---|---|---|---|---|
| ALL BRIDGES | AVERAGE | 1.999 | 1.798 | 1.611 | 1.489 | 2.903 | 2.231 | 2.618 | 2.141 |
| MAX | 3.044 | 2.747 | 2.620 | 2.423 | 4.839 | 3.415 | 4.284 | 3.591 | |
| MIN | 0.804 | 0.730 | 0.631 | 0.583 | 1.186 | 0.888 | 1.092 | 0.852 | |
| TOTAL | 58 | 58 | 58 | 58 | 58 | 58 | 58 | 58 | |
| # RF < 1.0 | 4 | 5 | 8 | 10 | 0 | 3 | 0 | 4 | |
| IHS BRIDGES | AVERAGE | 1.974 | 1.770 | 1.615 | 1.493 | 2.824 | 2.277 | 2.538 | 2.098 |
| MAX | 2.634 | 2.372 | 2.138 | 1.975 | 4.055 | 3.219 | 3.591 | 3.292 | |
| MIN | 0.821 | 0.739 | 0.631 | 0.583 | 1.187 | 0.888 | 1.092 | 0.852 | |
| TOTAL | 18 | 18 | 18 | 18 | 18 | 18 | 18 | 18 | |
| # RF < 1.0 | 2 | 2 | 2 | 2 | 0 | 2 | 0 | 2 | |
| OTHER BRIDGES ON THE NHS | AVERAGE | 2.011 | 1.811 | 1.610 | 1.487 | 2.939 | 2.211 | 2.654 | 2.161 |
| MAX | 3.044 | 2.747 | 2.620 | 2.423 | 4.839 | 3.415 | 4.284 | 3.591 | |
| MIN | 0.804 | 0.730 | 0.659 | 0.608 | 1.186 | 0.953 | 1.093 | 0.860 | |
| TOTAL | 40 | 40 | 40 | 40 | 40 | 40 | 40 | 40 | |
| # RF < 1.0 | 2 | 3 | 6 | 8 | 0 | 1 | 0 | 2 | |
| 3-S2 | Scenario #1 | Scenario #2 | Scenario #3 | 2-S1-2 | Scenario #4 | Scenario #5 | Scenario #6 | ||
|---|---|---|---|---|---|---|---|---|---|
| ALL BRIDGES | AVERAGE | 3.969 | 3.565 | 3.339 | 3.060 | 5.517 | 4.302 | 5.094 | 4.029 |
| MAX | 18.57 | 16.74 | 15.42 | 14.25 | 25.68 | 19.75 | 23.68 | 20.10 | |
| MIN | 1.619 | 1.425 | 1.335 | 1.190 | 2.254 | 1.855 | 2.089 | 1.606 | |
| TOTAL | 58 | 58 | 58 | 58 | 58 | 58 | 58 | 58 | |
| # RF < 1.0 | 0 | 0 | 0 | 0 | 0 | 0 | 0 | 0 | |
| IHS BRIDGES | AVERAGE | 3.555 | 3.204 | 3.018 | 2.761 | 4.834 | 3.856 | 4.475 | 3.413 |
| MAX | 6.52 | 5.85 | 5.67 | 5.18 | 8.98 | 7.18 | 8.45 | 6.29 | |
| MIN | 1.619 | 1.425 | 1.335 | 1.190 | 2.407 | 1.911 | 2.229 | 1.606 | |
| TOTAL | 18 | 18 | 18 | 18 | 18 | 18 | 18 | 18 | |
| # RF < 1.0 | 0 | 0 | 0 | 0 | 0 | 0 | 0 | 0 | |
| OTHER BRIDGES ON THE NHS | AVERAGE | 4.155 | 3.728 | 3.484 | 3.194 | 5.824 | 4.503 | 5.372 | 4.307 |
| MAX | 18.57 | 16.74 | 15.42 | 14.25 | 25.68 | 19.75 | 23.68 | 20.10 | |
| MIN | 1.769 | 1.609 | 1.485 | 1.372 | 2.254 | 1.855 | 2.089 | 1.667 | |
| TOTAL | 40 | 40 | 40 | 40 | 40 | 40 | 40 | 40 | |
| # RF < 1.0 | 0 | 0 | 0 | 0 | 0 | 0 | 0 | 0 | |
| 3-S2 | Scenario #1 | Scenario #2 | Scenario #3 | 2-S1-2 | Scenario #4 | Scenario #5 | Scenario #6 | ||
|---|---|---|---|---|---|---|---|---|---|
| ALL BRIDGES | AVERAGE | 3.280 | 2.989 | 2.861 | 2.651 | 3.561 | 3.143 | 3.177 | 2.416 |
| MAX | 4.835 | 4.407 | 4.191 | 3.892 | 5.172 | 4.543 | 4.749 | 3.553 | |
| MIN | 0.793 | 0.730 | 0.716 | 0.661 | 0.817 | 0.751 | 0.741 | 0.561 | |
| TOTAL | 69 | 69 | 69 | 69 | 69 | 69 | 69 | 69 | |
| # RF < 1.0 | 1 | 1 | 1 | 2 | 1 | 1 | 1 | 2 | |
| IHS BRIDGES | AVERAGE | 3.257 | 2.968 | 2.836 | 2.628 | 3.534 | 3.136 | 3.136 | 2.390 |
| MAX | 4.739 | 4.303 | 4.191 | 3.892 | 4.803 | 4.178 | 4.294 | 3.211 | |
| MIN | 0.793 | 0.730 | 0.716 | 0.661 | 0.817 | 0.751 | 0.741 | 0.561 | |
| TOTAL | 30 | 30 | 30 | 30 | 30 | 30 | 30 | 30 | |
| # RF < 1.0 | 1 | 1 | 1 | 2 | 1 | 1 | 1 | 2 | |
| OTHER BRIDGES ON THE NHS | AVERAGE | 3.298 | 3.005 | 2.881 | 2.668 | 3.581 | 3.149 | 3.209 | 2.437 |
| MAX | 4.835 | 4.407 | 4.175 | 3.857 | 5.172 | 4.543 | 4.749 | 3.553 | |
| MIN | 1.984 | 1.802 | 1.780 | 1.668 | 2.473 | 2.199 | 1.758 | 1.408 | |
| TOTAL | 39 | 39 | 39 | 39 | 39 | 39 | 39 | 39 | |
| # RF < 1.0 | 0 | 0 | 0 | 0 | 0 | 0 | 0 | 0 | |
| 3-S2 | Scenario #1 | Scenario #2 | Scenario #3 | 2-S1-2 | Scenario #4 | Scenario #5 | Scenario #6 | ||
|---|---|---|---|---|---|---|---|---|---|
| ALL BRIDGES | AVERAGE | 3.434 | 3.098 | 2.868 | 2.659 | 3.905 | 3.363 | 3.458 | 2.623 |
| MAX | 7.44 | 6.72 | 5.97 | 5.53 | 8.00 | 6.74 | 7.29 | 5.48 | |
| MIN | 1.721 | 1.549 | 1.459 | 1.342 | 1.934 | 1.625 | 1.526 | 1.231 | |
| TOTAL | 69 | 69 | 69 | 69 | 69 | 69 | 69 | 69 | |
| # RF < 1.0 | 0 | 0 | 0 | 0 | 0 | 0 | 0 | 0 | |
| IHS BRIDGES | AVERAGE | 3.179 | 2.868 | 2.665 | 2.469 | 3.597 | 3.101 | 3.171 | 2.412 |
| MAX | 6.96 | 6.20 | 5.67 | 5.26 | 8.00 | 6.74 | 6.76 | 5.09 | |
| MIN | 1.721 | 1.549 | 1.459 | 1.342 | 1.934 | 1.625 | 1.526 | 1.231 | |
| TOTAL | 30 | 30 | 30 | 30 | 30 | 30 | 30 | 30 | |
| # RF < 1.0 | 0 | 0 | 0 | 0 | 0 | 0 | 0 | 0 | |
| OTHER BRIDGES ON THE NHS | AVERAGE | 3.630 | 3.275 | 3.023 | 2.805 | 4.142 | 3.565 | 3.678 | 2.786 |
| MAX | 7.44 | 6.72 | 5.97 | 5.53 | 7.82 | 6.71 | 7.29 | 5.48 | |
| MIN | 1.877 | 1.714 | 1.538 | 1.424 | 2.005 | 1.714 | 1.862 | 1.414 | |
| TOTAL | 39 | 39 | 39 | 39 | 39 | 39 | 39 | 39 | |
| # RF < 1.0 | 0 | 0 | 0 | 0 | 0 | 0 | 0 | 0 | |
| 3-S2 | Scenario #1 | Scenario #2 | Scenario #3 | 2-S1-2 | Scenario #4 | Scenario #5 | Scenario #6 | ||
|---|---|---|---|---|---|---|---|---|---|
| ALL BRIDGES | AVERAGE | 2.907 | 2.641 | 2.543 | 2.371 | 3.456 | 3.040 | 2.699 | 2.115 |
| MAX | 4.781 | 4.344 | 4.273 | 4.017 | 6.185 | 5.610 | 4.323 | 3.213 | |
| MIN | 0.715 | 0.649 | 0.642 | 0.600 | 0.953 | 0.822 | 0.684 | 0.554 | |
| TOTAL | 48 | 48 | 48 | 48 | 48 | 48 | 48 | 48 | |
| # RF < 1.0 | 1 | 1 | 2 | 2 | 1 | 2 | 2 | 2 | |
| IHS BRIDGES | AVERAGE | 2.978 | 2.706 | 2.616 | 2.444 | 3.733 | 3.313 | 2.754 | 2.168 |
| MAX | 4.781 | 4.344 | 4.273 | 4.017 | 6.185 | 5.610 | 3.997 | 3.213 | |
| MIN | 0.715 | 0.649 | 0.642 | 0.600 | 0.953 | 0.822 | 0.684 | 0.554 | |
| TOTAL | 16 | 16 | 16 | 16 | 16 | 16 | 16 | 16 | |
| # RF < 1.0 | 1 | 1 | 1 | 1 | 1 | 1 | 1 | 1 | |
| OTHER BRIDGES ON THE NHS | AVERAGE | 2.872 | 2.608 | 2.506 | 2.335 | 3.317 | 2.903 | 2.672 | 2.088 |
| MAX | 4.636 | 4.195 | 4.007 | 3.749 | 4.918 | 4.378 | 4.323 | 3.192 | |
| MIN | 1.124 | 1.019 | 0.934 | 0.868 | 1.068 | 0.983 | 0.971 | 0.750 | |
| TOTAL | 32 | 32 | 32 | 32 | 32 | 32 | 32 | 32 | |
| # RF < 1.0 | 0 | 0 | 1 | 1 | 0 | 1 | 1 | 1 | |
| 3-S2 | Scenario #1 | Scenario #2 | Scenario #3 | 2-S1-2 | Scenario #4 | Scenario #5 | Scenario #6 | ||
|---|---|---|---|---|---|---|---|---|---|
| ALL BRIDGES | AVERAGE | 3.382 | 3.059 | 2.872 | 2.663 | 3.850 | 3.321 | 3.370 | 2.598 |
| MAX | 6.19 | 5.54 | 5.31 | 4.91 | 6.90 | 6.06 | 6.16 | 4.56 | |
| MIN | 1.435 | 1.295 | 1.234 | 1.155 | 1.628 | 1.451 | 1.189 | 0.984 | |
| TOTAL | 48 | 48 | 48 | 48 | 48 | 48 | 48 | 48 | |
| # RF < 1.0 | 0 | 0 | 0 | 0 | 0 | 0 | 0 | 1 | |
| IHS BRIDGES | AVERAGE | 3.261 | 2.948 | 2.735 | 2.535 | 3.609 | 3.116 | 3.150 | 2.435 |
| MAX | 6.19 | 5.54 | 5.31 | 4.91 | 6.90 | 6.06 | 5.86 | 4.55 | |
| MIN | 1.435 | 1.295 | 1.234 | 1.155 | 1.628 | 1.451 | 1.189 | 0.984 | |
| TOTAL | 16 | 16 | 16 | 16 | 16 | 16 | 16 | 16 | |
| # RF < 1.0 | 0 | 0 | 0 | 0 | 0 | 0 | 0 | 1 | |
| OTHER BRIDGES ON THE NHS | AVERAGE | 3.443 | 3.115 | 2.940 | 2.726 | 3.970 | 3.424 | 3.481 | 2.680 |
| MAX | 5.35 | 4.82 | 4.51 | 4.22 | 6.60 | 5.48 | 6.16 | 4.56 | |
| MIN | 1.689 | 1.549 | 1.423 | 1.317 | 1.841 | 1.568 | 1.673 | 1.304 | |
| TOTAL | 32 | 32 | 32 | 32 | 32 | 32 | 32 | 32 | |
| # RF < 1.0 | 0 | 0 | 0 | 0 | 0 | 0 | 0 | 0 | |
| 3-S2 | Scenario #1 | Scenario #2 | Scenario #3 | 2-S1-2 | Scenario #4 | Scenario #5 | Scenario #6 | ||
|---|---|---|---|---|---|---|---|---|---|
| ALL BRIDGES | AVERAGE | 2.888 | 2.629 | 2.446 | 2.261 | 3.456 | 2.954 | 3.178 | 2.347 |
| MAX | 5.491 | 5.028 | 4.888 | 4.516 | 6.753 | 5.569 | 6.219 | 4.383 | |
| MIN | 0.820 | 0.738 | 0.631 | 0.583 | 1.187 | 0.888 | 1.092 | 0.852 | |
| TOTAL | 52 | 52 | 52 | 52 | 52 | 52 | 52 | 52 | |
| # RF < 1.0 | 2 | 2 | 4 | 4 | 0 | 2 | 0 | 2 | |
| IHS BRIDGES | AVERAGE | 3.360 | 3.057 | 2.847 | 2.633 | 3.854 | 3.337 | 3.538 | 2.633 |
| MAX | 5.491 | 5.028 | 4.888 | 4.516 | 5.786 | 5.202 | 5.340 | 4.065 | |
| MIN | 2.332 | 2.109 | 1.852 | 1.711 | 2.407 | 2.146 | 2.124 | 1.662 | |
| TOTAL | 14 | 14 | 14 | 14 | 14 | 14 | 14 | 14 | |
| # RF < 1.0 | 0 | 0 | 0 | 0 | 0 | 0 | 0 | 0 | |
| OTHER BRIDGES ON THE NHS | AVERAGE | 2.715 | 2.472 | 2.298 | 2.124 | 3.309 | 2.812 | 3.045 | 2.242 |
| MAX | 4.871 | 4.422 | 4.030 | 3.723 | 6.753 | 5.569 | 6.219 | 4.383 | |
| MIN | 0.820 | 0.738 | 0.631 | 0.583 | 1.187 | 0.888 | 1.092 | 0.852 | |
| TOTAL | 38 | 38 | 38 | 38 | 38 | 38 | 38 | 38 | |
| # RF < 1.0 | 2 | 2 | 4 | 4 | 0 | 2 | 0 | 2 | |
| 3-S2 | Scenario #1 | Scenario #2 | Scenario #3 | 2-S1-2 | Scenario #4 | Scenario #5 | Scenario #6 | ||
|---|---|---|---|---|---|---|---|---|---|
| ALL BRIDGES | AVERAGE | 5.296 | 4.796 | 4.499 | 4.165 | 6.169 | 5.222 | 5.642 | 4.239 |
| MAX | 15.66 | 14.10 | 12.54 | 11.61 | 16.45 | 14.10 | 15.26 | 11.52 | |
| MIN | 1.619 | 1.425 | 1.335 | 1.190 | 2.063 | 1.785 | 1.789 | 1.356 | |
| TOTAL | 52 | 52 | 52 | 52 | 52 | 52 | 52 | 52 | |
| # RF < 1.0 | 0 | 0 | 0 | 0 | 0 | 0 | 0 | 0 | |
| IHS BRIDGES | AVERAGE | 4.741 | 4.300 | 4.060 | 3.763 | 5.591 | 4.757 | 5.075 | 3.810 |
| MAX | 6.98 | 6.40 | 5.99 | 5.56 | 7.89 | 6.68 | 7.25 | 5.45 | |
| MIN | 2.641 | 2.370 | 2.206 | 2.057 | 3.011 | 2.721 | 2.476 | 1.931 | |
| TOTAL | 14 | 14 | 14 | 14 | 14 | 14 | 14 | 14 | |
| # RF < 1.0 | 0 | 0 | 0 | 0 | 0 | 0 | 0 | 0 | |
| OTHER BRIDGES ON THE NHS | AVERAGE | 5.500 | 4.980 | 4.661 | 4.313 | 6.382 | 5.393 | 5.851 | 4.398 |
| MAX | 15.66 | 14.10 | 12.54 | 11.61 | 16.45 | 14.10 | 15.26 | 11.52 | |
| MIN | 1.619 | 1.425 | 1.335 | 1.190 | 2.063 | 1.785 | 1.789 | 1.356 | |
| TOTAL | 38 | 38 | 38 | 38 | 38 | 38 | 38 | 38 | |
| # RF < 1.0 | 0 | 0 | 0 | 0 | 0 | 0 | 0 | 0 | |
| 3-S2 | Scenario #1 | Scenario #2 | Scenario #3 | 2-S1-2 | Scenario #4 | Scenario #5 | Scenario #6 | ||
|---|---|---|---|---|---|---|---|---|---|
| ALL BRIDGES | AVERAGE | 3.135 | 2.847 | 2.737 | 2.546 | 3.309 | 2.928 | 2.791 | 2.203 |
| MAX | 4.982 | 4.523 | 4.403 | 4.092 | 4.922 | 4.385 | 4.341 | 3.365 | |
| MIN | 1.291 | 1.172 | 1.121 | 1.041 | 1.387 | 1.241 | 1.215 | 0.945 | |
| TOTAL | 36 | 36 | 36 | 36 | 36 | 36 | 36 | 36 | |
| # RF < 1.0 | 0 | 0 | 0 | 0 | 0 | 0 | 0 | 3 | |
| IHS BRIDGES | AVERAGE | 3.253 | 2.955 | 2.854 | 2.655 | 3.382 | 2.998 | 2.853 | 2.255 |
| MAX | 4.982 | 4.523 | 4.403 | 4.092 | 4.922 | 4.385 | 4.284 | 3.365 | |
| MIN | 1.335 | 1.211 | 1.196 | 1.120 | 1.819 | 1.563 | 1.237 | 0.996 | |
| TOTAL | 19 | 19 | 19 | 19 | 19 | 19 | 19 | 19 | |
| # RF < 1.0 | 0 | 0 | 0 | 0 | 0 | 0 | 0 | 1 | |
| OTHER BRIDGES ON THE NHS | AVERAGE | 3.004 | 2.726 | 2.607 | 2.425 | 3.229 | 2.851 | 2.722 | 2.145 |
| MAX | 4.923 | 4.470 | 4.350 | 4.045 | 4.910 | 4.373 | 4.341 | 3.342 | |
| MIN | 1.291 | 1.172 | 1.121 | 1.041 | 1.387 | 1.241 | 1.215 | 0.945 | |
| TOTAL | 17 | 17 | 17 | 17 | 17 | 17 | 17 | 17 | |
| # RF < 1.0 | 0 | 0 | 0 | 0 | 0 | 0 | 0 | 2 | |
| 3-S2 | Scenario #1 | Scenario #2 | Scenario #3 | 2-S1-2 | Scenario #4 | Scenario #5 | Scenario #6 | ||
|---|---|---|---|---|---|---|---|---|---|
| ALL BRIDGES | AVERAGE | 4.014 | 3.613 | 3.393 | 3.159 | 4.634 | 4.085 | 3.794 | 2.968 |
| MAX | 13.58 | 12.27 | 11.73 | 10.99 | 15.40 | 13.70 | 13.12 | 9.35 | |
| MIN | 0.707 | 0.635 | 0.591 | 0.552 | 0.806 | 0.728 | 0.660 | 0.516 | |
| TOTAL | 36 | 36 | 36 | 36 | 36 | 36 | 36 | 36 | |
| # RF < 1.0 | 2 | 2 | 2 | 2 | 1 | 1 | 2 | 2 | |
| IHS BRIDGES | AVERAGE | 4.342 | 3.901 | 3.654 | 3.398 | 4.996 | 4.393 | 4.117 | 3.199 |
| MAX | 13.58 | 12.27 | 11.73 | 10.99 | 15.40 | 13.70 | 13.12 | 9.35 | |
| MIN | 0.997 | 0.896 | 0.837 | 0.781 | 1.136 | 1.024 | 0.922 | 0.723 | |
| TOTAL | 19 | 19 | 19 | 19 | 19 | 19 | 19 | 19 | |
| # RF < 1.0 | 1 | 1 | 1 | 1 | 0 | 0 | 1 | 1 | |
| OTHER BRIDGES ON THE NHS | AVERAGE | 3.648 | 3.290 | 3.102 | 2.892 | 4.229 | 3.742 | 3.433 | 2.710 |
| MAX | 6.86 | 6.17 | 5.81 | 5.44 | 7.81 | 7.04 | 6.61 | 4.96 | |
| MIN | 0.707 | 0.635 | 0.591 | 0.552 | 0.806 | 0.728 | 0.660 | 0.516 | |
| TOTAL | 17 | 17 | 17 | 17 | 17 | 17 | 17 | 17 | |
| # RF < 1.0 | 1 | 1 | 1 | 1 | 1 | 1 | 1 | 1 | |
| 3-S2 | Scenario #1 | Scenario #2 | Scenario #3 | 2-S1-2 | Scenario #4 | Scenario #5 | Scenario #6 | ||
|---|---|---|---|---|---|---|---|---|---|
| ALL BRIDGES | AVERAGE | 2.751 | 2.486 | 2.383 | 2.217 | 3.316 | 2.867 | 2.693 | 2.123 |
| MAX | 5.528 | 5.002 | 4.850 | 4.550 | 6.631 | 5.833 | 4.937 | 4.071 | |
| MIN | 1.163 | 1.056 | 1.022 | 0.951 | 1.266 | 1.112 | 1.000 | 0.801 | |
| TOTAL | 49 | 49 | 49 | 49 | 49 | 49 | 49 | 49 | |
| # RF < 1.0 | 0 | 0 | 0 | 1 | 0 | 0 | 0 | 1 | |
| IHS BRIDGES | AVERAGE | 2.486 | 2.238 | 2.133 | 1.983 | 3.025 | 2.544 | 2.460 | 1.910 |
| MAX | 3.586 | 3.259 | 3.178 | 2.958 | 4.077 | 3.536 | 3.702 | 2.607 | |
| MIN | 1.570 | 1.423 | 1.421 | 1.330 | 1.832 | 1.640 | 1.422 | 1.163 | |
| TOTAL | 21 | 21 | 21 | 21 | 21 | 21 | 21 | 21 | |
| # RF < 1.0 | 0 | 0 | 0 | 0 | 0 | 0 | 0 | 0 | |
| OTHER BRIDGES ON THE NHS | AVERAGE | 2.950 | 2.672 | 2.570 | 2.393 | 3.535 | 3.110 | 2.868 | 2.282 |
| MAX | 5.528 | 5.002 | 4.850 | 4.550 | 6.631 | 5.833 | 4.937 | 4.071 | |
| MIN | 1.163 | 1.056 | 1.022 | 0.951 | 1.266 | 1.112 | 1.000 | 0.801 | |
| TOTAL | 28 | 28 | 28 | 28 | 28 | 28 | 28 | 28 | |
| # RF < 1.0 | 0 | 0 | 0 | 1 | 0 | 0 | 0 | 1 | |
| 3-S2 | Scenario #1 | Scenario #2 | Scenario #3 | 2-S1-2 | Scenario #4 | Scenario #5 | Scenario #6 | ||
|---|---|---|---|---|---|---|---|---|---|
| ALL BRIDGES | AVERAGE | 4.599 | 4.161 | 3.884 | 3.599 | 5.140 | 4.414 | 4.607 | 3.543 |
| MAX | 7.97 | 7.12 | 6.50 | 6.05 | 8.82 | 7.68 | 7.59 | 5.79 | |
| MIN | 1.417 | 1.265 | 1.142 | 1.061 | 1.703 | 1.398 | 1.448 | 1.094 | |
| TOTAL | 49 | 49 | 49 | 49 | 49 | 49 | 49 | 49 | |
| # RF < 1.0 | 0 | 0 | 0 | 0 | 0 | 0 | 0 | 0 | |
| IHS BRIDGES | AVERAGE | 4.614 | 4.167 | 3.888 | 3.605 | 5.266 | 4.517 | 4.671 | 3.580 |
| MAX | 7.97 | 7.12 | 6.50 | 6.05 | 8.82 | 7.68 | 7.59 | 5.79 | |
| MIN | 1.588 | 1.426 | 1.328 | 1.239 | 1.811 | 1.636 | 1.486 | 1.160 | |
| TOTAL | 21 | 21 | 21 | 21 | 21 | 21 | 21 | 21 | |
| # RF < 1.0 | 0 | 0 | 0 | 0 | 0 | 0 | 0 | 0 | |
| OTHER BRIDGES ON THE NHS | AVERAGE | 4.587 | 4.157 | 3.880 | 3.595 | 5.045 | 4.337 | 4.558 | 3.515 |
| MAX | 7.59 | 6.76 | 6.24 | 5.77 | 8.30 | 7.14 | 7.42 | 5.63 | |
| MIN | 1.417 | 1.265 | 1.142 | 1.061 | 1.703 | 1.398 | 1.448 | 1.094 | |
| TOTAL | 28 | 28 | 28 | 28 | 28 | 28 | 28 | 28 | |
| # RF < 1.0 | 0 | 0 | 0 | 0 | 0 | 0 | 0 | 0 | |
| 3-S2 | Scenario #1 | Scenario #2 | Scenario #3 | 2-S1-2 | Scenario #4 | Scenario #5 | Scenario #6 | ||
|---|---|---|---|---|---|---|---|---|---|
| ALL BRIDGES | AVERAGE | 2.890 | 2.625 | 2.516 | 2.342 | 3.120 | 2.754 | 2.551 | 2.034 |
| MAX | 7.318 | 6.651 | 6.477 | 6.050 | 7.835 | 6.936 | 5.903 | 4.794 | |
| MIN | 1.245 | 1.127 | 1.075 | 1.006 | 1.358 | 1.215 | 1.015 | 0.827 | |
| TOTAL | 44 | 44 | 44 | 44 | 44 | 44 | 44 | 44 | |
| # RF < 1.0 | 0 | 0 | 0 | 0 | 0 | 0 | 0 | 1 | |
| IHS BRIDGES | AVERAGE | 2.739 | 2.483 | 2.349 | 2.191 | 2.945 | 2.598 | 2.403 | 1.938 |
| MAX | 4.366 | 3.957 | 3.713 | 3.468 | 4.560 | 4.134 | 3.638 | 2.922 | |
| MIN | 1.245 | 1.127 | 1.075 | 1.006 | 1.358 | 1.215 | 1.015 | 0.827 | |
| TOTAL | 11 | 11 | 11 | 11 | 11 | 11 | 11 | 11 | |
| # RF < 1.0 | 0 | 0 | 0 | 0 | 0 | 0 | 0 | 1 | |
| OTHER BRIDGES ON THE NHS | AVERAGE | 2.941 | 2.672 | 2.571 | 2.393 | 3.179 | 2.806 | 2.600 | 2.066 |
| MAX | 7.318 | 6.651 | 6.477 | 6.050 | 7.835 | 6.936 | 5.903 | 4.794 | |
| MIN | 1.260 | 1.151 | 1.094 | 1.010 | 1.524 | 1.319 | 1.243 | 1.007 | |
| TOTAL | 33 | 33 | 33 | 33 | 33 | 33 | 33 | 33 | |
| # RF < 1.0 | 0 | 0 | 0 | 0 | 0 | 0 | 0 | 0 | |
| 3-S2 | Scenario #1 | Scenario #2 | Scenario #3 | 2-S1-2 | Scenario #4 | Scenario #5 | Scenario #6 | ||
|---|---|---|---|---|---|---|---|---|---|
| ALL BRIDGES | AVERAGE | 3.351 | 3.020 | 2.835 | 2.640 | 3.847 | 3.392 | 3.178 | 2.495 |
| MAX | 8.37 | 7.56 | 7.21 | 6.76 | 9.47 | 8.44 | 7.82 | 5.72 | |
| MIN | 1.609 | 1.444 | 1.343 | 1.253 | 1.822 | 1.579 | 1.509 | 1.176 | |
| TOTAL | 44 | 44 | 44 | 44 | 44 | 44 | 44 | 44 | |
| # RF < 1.0 | 0 | 0 | 0 | 0 | 0 | 0 | 0 | 0 | |
| IHS BRIDGES | AVERAGE | 2.916 | 2.617 | 2.441 | 2.274 | 3.345 | 2.957 | 2.764 | 2.152 |
| MAX | 3.90 | 3.50 | 3.27 | 3.05 | 4.36 | 3.95 | 3.56 | 2.79 | |
| MIN | 2.023 | 1.819 | 1.705 | 1.593 | 2.279 | 2.054 | 1.829 | 1.438 | |
| TOTAL | 11 | 11 | 11 | 11 | 11 | 11 | 11 | 11 | |
| # RF < 1.0 | 0 | 0 | 0 | 0 | 0 | 0 | 0 | 0 | |
| OTHER BRIDGES ON THE NHS | AVERAGE | 3.496 | 3.154 | 2.966 | 2.762 | 4.014 | 3.537 | 3.317 | 2.610 |
| MAX | 8.37 | 7.56 | 7.21 | 6.76 | 9.47 | 8.44 | 7.82 | 5.72 | |
| MIN | 1.609 | 1.444 | 1.343 | 1.253 | 1.822 | 1.579 | 1.509 | 1.176 | |
| TOTAL | 33 | 33 | 33 | 33 | 33 | 33 | 33 | 33 | |
| # RF < 1.0 | 0 | 0 | 0 | 0 | 0 | 0 | 0 | 0 | |
| 3-S2 | Scenario #1 | Scenario #2 | Scenario #3 | 2-S1-2 | Scenario #4 | Scenario #5 | Scenario #6 | ||
|---|---|---|---|---|---|---|---|---|---|
| ALL BRIDGES | AVERAGE | 2.376 | 2.138 | 2.024 | 1.875 | 3.039 | 2.560 | 2.633 | 2.117 |
| MAX | 4.561 | 4.093 | 3.809 | 3.552 | 5.200 | 4.699 | 4.275 | 3.335 | |
| MIN | 1.446 | 1.303 | 1.284 | 1.186 | 2.163 | 1.685 | 1.745 | 1.406 | |
| TOTAL | 11 | 11 | 11 | 11 | 11 | 11 | 11 | 11 | |
| # RF < 1.0 | 0 | 0 | 0 | 0 | 0 | 0 | 0 | 0 | |
| IHS BRIDGES | AVERAGE | 2.057 | 1.855 | 1.957 | 1.808 | 2.823 | 2.385 | 2.450 | 2.066 |
| MAX | 2.667 | 2.406 | 2.630 | 2.430 | 3.410 | 3.084 | 3.155 | 2.725 | |
| MIN | 1.446 | 1.303 | 1.284 | 1.186 | 2.236 | 1.685 | 1.745 | 1.406 | |
| TOTAL | 2 | 2 | 2 | 2 | 2 | 2 | 2 | 2 | |
| # RF < 1.0 | 0 | 0 | 0 | 0 | 0 | 0 | 0 | 0 | |
| OTHER BRIDGES ON THE NHS | AVERAGE | 2.447 | 2.201 | 2.039 | 1.890 | 3.087 | 2.599 | 2.673 | 2.129 |
| MAX | 4.561 | 4.093 | 3.809 | 3.552 | 5.200 | 4.699 | 4.275 | 3.335 | |
| MIN | 1.538 | 1.384 | 1.404 | 1.298 | 2.163 | 1.914 | 1.790 | 1.441 | |
| TOTAL | 9 | 9 | 9 | 9 | 9 | 9 | 9 | 9 | |
| # RF < 1.0 | 0 | 0 | 0 | 0 | 0 | 0 | 0 | 0 | |
NOTE: Rating factors determined based on the LFR methodology. Separate flexural/shear rating factors unavailable
| 3-S2 | Scenario #1 | Scenario #2 | Scenario #3 | 2-S1-2 | Scenario #4 | Scenario #5 | Scenario #6 | ||
|---|---|---|---|---|---|---|---|---|---|
| ALL BRIDGES | AVERAGE | 1.879 | 1.704 | 1.551 | 1.434 | 2.528 | 2.055 | 2.313 | 1.737 |
| MAX | 3.708 | 3.387 | 3.228 | 2.982 | 4.609 | 4.046 | 4.243 | 3.022 | |
| MIN | 0.748 | 0.675 | 0.589 | 0.545 | 1.095 | 0.824 | 1.006 | 0.755 | |
| TOTAL | 53 | 53 | 53 | 53 | 53 | 53 | 53 | 53 | |
| # RF < 1.0 | 4 | 7 | 10 | 13 | 0 | 4 | 0 | 7 | |
| IHS BRIDGES | AVERAGE | 2.418 | 2.195 | 2.049 | 1.898 | 3.055 | 2.586 | 2.753 | 2.079 |
| MAX | 3.708 | 3.387 | 3.228 | 2.982 | 4.609 | 4.046 | 4.243 | 3.007 | |
| MIN | 1.508 | 1.364 | 1.230 | 1.136 | 1.886 | 1.726 | 1.625 | 1.308 | |
| TOTAL | 11 | 11 | 11 | 11 | 11 | 11 | 11 | 11 | |
| # RF < 1.0 | 0 | 0 | 0 | 0 | 0 | 0 | 0 | 0 | |
| OTHER BRIDGES ON THE NHS | AVERAGE | 1.738 | 1.575 | 1.420 | 1.312 | 2.390 | 1.916 | 2.198 | 1.647 |
| MAX | 3.097 | 2.811 | 2.526 | 2.334 | 4.282 | 3.616 | 3.740 | 3.022 | |
| MIN | 0.748 | 0.675 | 0.589 | 0.545 | 1.095 | 0.824 | 1.006 | 0.755 | |
| TOTAL | 42 | 42 | 42 | 42 | 42 | 42 | 42 | 42 | |
| # RF < 1.0 | 4 | 7 | 10 | 13 | 0 | 4 | 0 | 7 | |
| 3-S2 | Scenario #1 | Scenario #2 | Scenario #3 | 2-S1-2 | Scenario #4 | Scenario #5 | Scenario #6 | ||
|---|---|---|---|---|---|---|---|---|---|
| ALL BRIDGES | AVERAGE | 2.843 | 2.552 | 2.435 | 2.228 | 3.902 | 3.100 | 3.583 | 2.641 |
| MAX | 19.86 | 18.06 | 17.38 | 16.06 | 28.07 | 22.55 | 26.26 | 19.55 | |
| MIN | 0.715 | 0.626 | 0.610 | 0.541 | 1.033 | 0.790 | 0.954 | 0.610 | |
| TOTAL | 53 | 53 | 53 | 53 | 53 | 53 | 53 | 53 | |
| # RF < 1.0 | 2 | 5 | 6 | 8 | 0 | 1 | 1 | 5 | |
| IHS BRIDGES | AVERAGE | 2.770 | 2.496 | 2.359 | 2.169 | 3.507 | 2.893 | 3.144 | 2.360 |
| MAX | 4.57 | 4.17 | 4.08 | 3.77 | 5.88 | 4.91 | 5.52 | 4.04 | |
| MIN | 1.111 | 1.015 | 1.008 | 0.932 | 1.198 | 1.014 | 1.065 | 0.844 | |
| TOTAL | 11 | 11 | 11 | 11 | 11 | 11 | 11 | 11 | |
| # RF < 1.0 | 0 | 0 | 0 | 1 | 0 | 0 | 0 | 1 | |
| OTHER BRIDGES ON THE NHS | AVERAGE | 2.862 | 2.567 | 2.455 | 2.244 | 4.005 | 3.155 | 3.698 | 2.715 |
| MAX | 19.86 | 18.06 | 17.38 | 16.06 | 28.07 | 22.55 | 26.26 | 19.55 | |
| MIN | 0.715 | 0.626 | 0.610 | 0.541 | 1.033 | 0.790 | 0.954 | 0.610 | |
| TOTAL | 42 | 42 | 42 | 42 | 42 | 42 | 42 | 42 | |
| # RF < 1.0 | 2 | 5 | 6 | 7 | 0 | 1 | 1 | 4 | |
| 3-S2 | Scenario #1 | Scenario #2 | Scenario #3 | 2-S1-2 | Scenario #4 | Scenario #5 | Scenario #6 | ||
|---|---|---|---|---|---|---|---|---|---|
| ALL BRIDGES | AVERAGE | 3.362 | 3.066 | 2.902 | 2.686 | 3.805 | 3.280 | 3.462 | 2.596 |
| MAX | 8.429 | 7.725 | 7.526 | 6.969 | 8.350 | 7.465 | 7.698 | 5.871 | |
| MIN | 1.254 | 1.144 | 1.078 | 0.996 | 1.459 | 1.308 | 1.285 | 1.015 | |
| TOTAL | 54 | 54 | 54 | 54 | 54 | 54 | 54 | 54 | |
| # RF < 1.0 | 0 | 0 | 0 | 1 | 0 | 0 | 0 | 0 | |
| IHS BRIDGES | AVERAGE | 3.869 | 3.519 | 3.400 | 3.157 | 3.983 | 3.530 | 3.460 | 2.714 |
| MAX | 8.337 | 7.598 | 7.461 | 6.943 | 8.350 | 7.430 | 7.023 | 5.641 | |
| MIN | 1.542 | 1.405 | 1.392 | 1.293 | 1.563 | 1.390 | 1.285 | 1.047 | |
| TOTAL | 10 | 10 | 10 | 10 | 10 | 10 | 10 | 10 | |
| # RF < 1.0 | 0 | 0 | 0 | 0 | 0 | 0 | 0 | 0 | |
| OTHER BRIDGES ON THE NHS | AVERAGE | 3.247 | 2.963 | 2.789 | 2.579 | 3.765 | 3.223 | 3.463 | 2.569 |
| MAX | 8.429 | 7.725 | 7.526 | 6.969 | 8.329 | 7.465 | 7.698 | 5.871 | |
| MIN | 1.254 | 1.144 | 1.078 | 0.996 | 1.459 | 1.308 | 1.349 | 1.015 | |
| TOTAL | 44 | 44 | 44 | 44 | 44 | 44 | 44 | 44 | |
| # RF < 1.0 | 0 | 0 | 0 | 1 | 0 | 0 | 0 | 0 | |
| 3-S2 | Scenario #1 | Scenario #2 | Scenario #3 | 2-S1-2 | Scenario #4 | Scenario #5 | Scenario #6 | ||
|---|---|---|---|---|---|---|---|---|---|
| ALL BRIDGES | AVERAGE | 3.592 | 3.236 | 3.053 | 2.815 | 4.364 | 3.678 | 3.966 | 2.973 |
| MAX | 17.69 | 16.04 | 15.17 | 14.01 | 24.86 | 19.69 | 23.04 | 18.16 | |
| MIN | 1.450 | 1.340 | 1.301 | 1.211 | 1.669 | 1.479 | 1.544 | 1.163 | |
| TOTAL | 54 | 54 | 54 | 54 | 54 | 54 | 54 | 54 | |
| # RF < 1.0 | 0 | 0 | 0 | 0 | 0 | 0 | 0 | 0 | |
| IHS BRIDGES | AVERAGE | 3.207 | 2.887 | 2.717 | 2.523 | 3.769 | 3.295 | 3.243 | 2.490 |
| MAX | 4.79 | 4.36 | 4.21 | 3.89 | 6.43 | 5.27 | 5.91 | 4.54 | |
| MIN | 2.106 | 1.893 | 1.773 | 1.656 | 2.398 | 2.158 | 1.929 | 1.521 | |
| TOTAL | 10 | 10 | 10 | 10 | 10 | 10 | 10 | 10 | |
| # RF < 1.0 | 0 | 0 | 0 | 0 | 0 | 0 | 0 | 0 | |
| OTHER BRIDGES ON THE NHS | AVERAGE | 3.680 | 3.316 | 3.129 | 2.881 | 4.499 | 3.765 | 4.130 | 3.082 |
| MAX | 17.69 | 16.04 | 15.17 | 14.01 | 24.86 | 19.69 | 23.04 | 18.16 | |
| MIN | 1.450 | 1.340 | 1.301 | 1.211 | 1.669 | 1.479 | 1.544 | 1.163 | |
| TOTAL | 44 | 44 | 44 | 44 | 44 | 44 | 44 | 44 | |
| # RF < 1.0 | 0 | 0 | 0 | 0 | 0 | 0 | 0 | 0 | |
| 3-S2 | Scenario #1 | Scenario #2 | Scenario #3 | 2-S1-2 | Scenario #4 | Scenario #5 | Scenario #6 | ||
|---|---|---|---|---|---|---|---|---|---|
| ALL BRIDGES | AVERAGE | 2.982 | 2.696 | 2.552 | 2.381 | 3.339 | 2.981 | 2.570 | 2.100 |
| MAX | 6.849 | 6.181 | 5.875 | 5.499 | 7.777 | 6.937 | 5.738 | 4.761 | |
| MIN | 1.745 | 1.571 | 1.485 | 1.371 | 1.932 | 1.710 | 1.511 | 1.236 | |
| TOTAL | 16 | 16 | 16 | 16 | 16 | 16 | 16 | 16 | |
| # RF < 1.0 | 0 | 0 | 0 | 0 | 0 | 0 | 0 | 0 | |
| IHS BRIDGES | AVERAGE | 3.313 | 3.023 | 2.842 | 2.625 | 3.993 | 3.557 | 2.924 | 2.401 |
| MAX | 3.313 | 3.023 | 2.842 | 2.625 | 3.993 | 3.557 | 2.924 | 2.401 | |
| MIN | 3.313 | 3.023 | 2.842 | 2.625 | 3.993 | 3.557 | 2.924 | 2.401 | |
| TOTAL | 1 | 1 | 1 | 1 | 1 | 1 | 1 | 1 | |
| # RF < 1.0 | 0 | 0 | 0 | 0 | 0 | 0 | 0 | 0 | |
| OTHER BRIDGES ON THE NHS | AVERAGE | 2.960 | 2.674 | 2.532 | 2.364 | 3.296 | 2.942 | 2.547 | 2.080 |
| MAX | 6.849 | 6.181 | 5.875 | 5.499 | 7.777 | 6.937 | 5.738 | 4.761 | |
| MIN | 1.745 | 1.571 | 1.485 | 1.371 | 1.932 | 1.710 | 1.511 | 1.236 | |
| TOTAL | 15 | 15 | 15 | 15 | 15 | 15 | 15 | 15 | |
| # RF < 1.0 | 0 | 0 | 0 | 0 | 0 | 0 | 0 | 0 | |
NOTE: Rating factors determined based on the LFR methodology.
NORMALIZED LOAD RATING RESULTS FOR BRIDGE TYPES
| NORMALIZED BY 3-S2 | NORMALIZED BY 2-S1-2 | ||||||
|---|---|---|---|---|---|---|---|
| Scenario #1 | Scenario #2 | Scenario #3 | Scenario #4 | Scenario #5 | Scenario #6 | ||
| ALL BRIDGES | AVERAGE | 0.904 | 0.825 | 0.764 | 0.823 | 0.890 | 0.694 |
| MAX | 0.918 | 0.895 | 0.838 | 0.915 | 0.928 | 0.759 | |
| MIN | 0.879 | 0.743 | 0.686 | 0.702 | 0.665 | 0.546 | |
| COV [%] | 0.8% | 5.2% | 5.5% | 8.2% | 6.2% | 6.5% | |
| IHS BRIDGES | AVERAGE | 0.904 | 0.814 | 0.752 | 0.811 | 0.914 | 0.696 |
| MAX | 0.913 | 0.885 | 0.820 | 0.893 | 0.927 | 0.752 | |
| MIN | 0.884 | 0.743 | 0.686 | 0.702 | 0.887 | 0.648 | |
| COV [%] | 0.7% | 5.4% | 5.5% | 8.0% | 1.2% | 5.1% | |
| OTHER BRIDGES ON THE NHS | AVERAGE | 0.904 | 0.830 | 0.769 | 0.829 | 0.879 | 0.693 |
| MAX | 0.918 | 0.895 | 0.838 | 0.915 | 0.928 | 0.759 | |
| MIN | 0.879 | 0.768 | 0.710 | 0.710 | 0.665 | 0.546 | |
| COV [%] | 0.8% | 5.2% | 5.6% | 8.5% | 7.0% | 7.0% | |
| NORMALIZED BY 3-S2 | NORMALIZED BY 2-S1-2 | ||||||
|---|---|---|---|---|---|---|---|
| Scenario #1 | Scenario #2 | Scenario #3 | Scenario #4 | Scenario #5 | Scenario #6 | ||
| ALL BRIDGES | AVERAGE | 0.901 | 0.846 | 0.780 | 0.821 | 0.903 | 0.696 |
| MAX | 0.917 | 0.919 | 0.912 | 0.906 | 0.950 | 0.779 | |
| MIN | 0.880 | 0.790 | 0.728 | 0.726 | 0.809 | 0.612 | |
| COV [%] | 1.2% | 3.7% | 4.5% | 6.1% | 4.2% | 6.2% | |
| IHS BRIDGES | AVERAGE | 0.897 | 0.847 | 0.774 | 0.804 | 0.916 | 0.682 |
| MAX | 0.917 | 0.907 | 0.838 | 0.906 | 0.950 | 0.761 | |
| MIN | 0.880 | 0.819 | 0.747 | 0.760 | 0.828 | 0.612 | |
| COV [%] | 1.2% | 2.6% | 2.9% | 5.7% | 3.5% | 6.9% | |
| OTHER BRIDGES ON THE NHS | AVERAGE | 0.902 | 0.846 | 0.782 | 0.829 | 0.898 | 0.703 |
| MAX | 0.917 | 0.919 | 0.912 | 0.904 | 0.946 | 0.779 | |
| MIN | 0.884 | 0.790 | 0.728 | 0.726 | 0.809 | 0.633 | |
| COV [%] | 1.2% | 4.2% | 5.1% | 6.3% | 4.3% | 5.9% | |
| NORMALIZED BY 3-S2 | NORMALIZED BY 2-S1-2 | ||||||
|---|---|---|---|---|---|---|---|
| Scenario #1 | Scenario #2 | Scenario #3 | Scenario #4 | Scenario #5 | Scenario #6 | ||
| ALL BRIDGES | AVERAGE | 0.903 | 0.833 | 0.772 | 0.824 | 0.880 | 0.690 |
| MAX | 0.917 | 0.903 | 0.845 | 0.956 | 0.927 | 0.801 | |
| MIN | 0.725 | 0.652 | 0.605 | 0.530 | 0.512 | 0.387 | |
| COV [%] | 2.5% | 5.5% | 5.6% | 9.7% | 8.3% | 9.3% | |
| IHS BRIDGES | AVERAGE | 0.899 | 0.825 | 0.765 | 0.819 | 0.863 | 0.685 |
| MAX | 0.916 | 0.891 | 0.830 | 0.907 | 0.923 | 0.801 | |
| MIN | 0.725 | 0.652 | 0.605 | 0.530 | 0.512 | 0.387 | |
| COV [%] | 3.7% | 6.2% | 6.5% | 10.9% | 10.0% | 10.9% | |
| OTHER BRIDGES ON THE NHS | AVERAGE | 0.906 | 0.840 | 0.777 | 0.827 | 0.893 | 0.694 |
| MAX | 0.917 | 0.903 | 0.845 | 0.956 | 0.927 | 0.782 | |
| MIN | 0.885 | 0.769 | 0.710 | 0.706 | 0.672 | 0.543 | |
| COV [%] | 0.9% | 4.8% | 5.0% | 8.8% | 6.9% | 8.0% | |
| NORMALIZED BY 3-S2 | NORMALIZED BY 2-S1-2 | ||||||
|---|---|---|---|---|---|---|---|
| Scenario #1 | Scenario #2 | Scenario #3 | Scenario #4 | Scenario #5 | Scenario #6 | ||
| ALL BRIDGES | AVERAGE | 0.900 | 0.847 | 0.780 | 0.821 | 0.904 | 0.698 |
| MAX | 0.917 | 0.914 | 0.846 | 0.906 | 0.956 | 0.800 | |
| MIN | 0.868 | 0.780 | 0.706 | 0.688 | 0.753 | 0.628 | |
| COV [%] | 1.3% | 4.1% | 4.4% | 6.8% | 4.5% | 7.5% | |
| IHS BRIDGES | AVERAGE | 0.900 | 0.849 | 0.783 | 0.828 | 0.896 | 0.693 |
| MAX | 0.916 | 0.914 | 0.845 | 0.906 | 0.948 | 0.800 | |
| MIN | 0.868 | 0.780 | 0.707 | 0.703 | 0.753 | 0.630 | |
| COV [%] | 1.4% | 4.2% | 4.7% | 7.4% | 5.8% | 7.3% | |
| OTHER BRIDGES ON THE NHS | AVERAGE | 0.899 | 0.845 | 0.778 | 0.816 | 0.911 | 0.701 |
| MAX | 0.917 | 0.914 | 0.846 | 0.906 | 0.956 | 0.799 | |
| MIN | 0.877 | 0.784 | 0.706 | 0.688 | 0.834 | 0.628 | |
| COV [%] | 1.3% | 4.1% | 4.2% | 6.3% | 3.3% | 7.8% | |
| NORMALIZED BY 3-S2 | NORMALIZED BY 2-S1-2 | ||||||
|---|---|---|---|---|---|---|---|
| Scenario #1 | Scenario #2 | Scenario #3 | Scenario #4 | Scenario #5 | Scenario #6 | ||
| ALL BRIDGES | AVERAGE | 0.907 | 0.859 | 0.797 | 0.851 | 0.855 | 0.677 |
| MAX | 0.917 | 0.905 | 0.849 | 0.900 | 0.964 | 0.874 | |
| MIN | 0.887 | 0.785 | 0.725 | 0.695 | 0.650 | 0.524 | |
| COV [%] | 0.7% | 4.2% | 4.5% | 6.0% | 9.5% | 10.8% | |
| IHS BRIDGES | AVERAGE | 0.908 | 0.853 | 0.791 | 0.854 | 0.875 | 0.672 |
| MAX | 0.917 | 0.903 | 0.849 | 0.896 | 0.925 | 0.735 | |
| MIN | 0.887 | 0.785 | 0.725 | 0.695 | 0.650 | 0.524 | |
| COV [%] | 0.8% | 4.6% | 4.9% | 7.0% | 9.4% | 8.2% | |
| OTHER BRIDGES ON THE NHS | AVERAGE | 0.906 | 0.861 | 0.800 | 0.850 | 0.845 | 0.680 |
| MAX | 0.917 | 0.905 | 0.848 | 0.900 | 0.964 | 0.874 | |
| MIN | 0.896 | 0.792 | 0.732 | 0.719 | 0.682 | 0.558 | |
| COV [%] | 0.6% | 4.0% | 4.4% | 5.5% | 9.2% | 12.0% | |
| NORMALIZED BY 3-S2 | NORMALIZED BY 2-S1-2 | ||||||
|---|---|---|---|---|---|---|---|
| Scenario #1 | Scenario #2 | Scenario #3 | Scenario #4 | Scenario #5 | Scenario #6 | ||
| ALL BRIDGES | AVERAGE | 0.904 | 0.847 | 0.786 | 0.854 | 0.884 | 0.685 |
| MAX | 0.924 | 0.914 | 0.844 | 0.909 | 0.986 | 0.792 | |
| MIN | 0.892 | 0.799 | 0.740 | 0.758 | 0.727 | 0.601 | |
| COV [%] | 1.0% | 3.4% | 3.3% | 4.5% | 7.6% | 6.7% | |
| IHS BRIDGES | AVERAGE | 0.904 | 0.848 | 0.787 | 0.851 | 0.879 | 0.676 |
| MAX | 0.924 | 0.914 | 0.844 | 0.900 | 0.954 | 0.792 | |
| MIN | 0.892 | 0.811 | 0.753 | 0.758 | 0.727 | 0.601 | |
| COV [%] | 1.2% | 3.7% | 3.7% | 5.1% | 7.9% | 6.9% | |
| OTHER BRIDGES ON THE NHS | AVERAGE | 0.904 | 0.847 | 0.785 | 0.855 | 0.887 | 0.689 |
| MAX | 0.917 | 0.911 | 0.840 | 0.909 | 0.986 | 0.759 | |
| MIN | 0.892 | 0.799 | 0.740 | 0.781 | 0.756 | 0.624 | |
| COV [%] | 0.8% | 3.3% | 3.1% | 4.3% | 7.7% | 6.7% | |
| NORMALIZED BY 3-S2 | NORMALIZED BY 2-S1-2 | ||||||
|---|---|---|---|---|---|---|---|
| Scenario #1 | Scenario #2 | Scenario #3 | Scenario #4 | Scenario #5 | Scenario #6 | ||
| ALL BRIDGES | AVERAGE | 0.907 | 0.844 | 0.783 | 0.859 | 0.887 | 0.687 |
| MAX | 0.917 | 0.901 | 0.837 | 0.922 | 0.947 | 0.812 | |
| MIN | 0.880 | 0.740 | 0.683 | 0.717 | 0.742 | 0.598 | |
| COV [%] | 0.7% | 5.3% | 5.5% | 6.5% | 5.6% | 5.2% | |
| IHS BRIDGES | AVERAGE | 0.907 | 0.839 | 0.777 | 0.866 | 0.887 | 0.690 |
| MAX | 0.916 | 0.895 | 0.834 | 0.922 | 0.925 | 0.812 | |
| MIN | 0.895 | 0.768 | 0.709 | 0.755 | 0.772 | 0.626 | |
| COV [%] | 0.6% | 5.3% | 5.5% | 6.3% | 6.0% | 6.5% | |
| OTHER BRIDGES ON THE NHS | AVERAGE | 0.907 | 0.846 | 0.785 | 0.857 | 0.886 | 0.686 |
| MAX | 0.917 | 0.901 | 0.837 | 0.911 | 0.947 | 0.752 | |
| MIN | 0.880 | 0.740 | 0.683 | 0.717 | 0.742 | 0.598 | |
| COV [%] | 0.7% | 5.4% | 5.6% | 6.5% | 5.5% | 4.7% | |
| NORMALIZED BY 3-S2 | NORMALIZED BY 2-S1-2 | ||||||
|---|---|---|---|---|---|---|---|
| Scenario #1 | Scenario #2 | Scenario #3 | Scenario #4 | Scenario #5 | Scenario #6 | ||
| ALL BRIDGES | AVERAGE | 0.899 | 0.841 | 0.778 | 0.849 | 0.872 | 0.663 |
| MAX | 0.918 | 0.911 | 0.842 | 0.906 | 0.946 | 0.751 | |
| MIN | 0.879 | 0.786 | 0.726 | 0.739 | 0.730 | 0.604 | |
| COV [%] | 1.0% | 3.5% | 3.5% | 5.7% | 7.2% | 5.0% | |
| IHS BRIDGES | AVERAGE | 0.896 | 0.837 | 0.772 | 0.843 | 0.872 | 0.657 |
| MAX | 0.904 | 0.893 | 0.815 | 0.901 | 0.941 | 0.726 | |
| MIN | 0.879 | 0.786 | 0.726 | 0.760 | 0.749 | 0.622 | |
| COV [%] | 0.7% | 3.9% | 3.7% | 5.7% | 7.6% | 4.4% | |
| OTHER BRIDGES ON THE NHS | AVERAGE | 0.900 | 0.843 | 0.780 | 0.852 | 0.873 | 0.666 |
| MAX | 0.918 | 0.911 | 0.842 | 0.906 | 0.946 | 0.751 | |
| MIN | 0.881 | 0.797 | 0.736 | 0.739 | 0.730 | 0.604 | |
| COV [%] | 1.0% | 3.5% | 3.4% | 5.8% | 7.2% | 5.2% | |
| NORMALIZED BY 3-S2 | NORMALIZED BY 2-S1-2 | ||||||
|---|---|---|---|---|---|---|---|
| Scenario #1 | Scenario #2 | Scenario #3 | Scenario #4 | Scenario #5 | Scenario #6 | ||
| ALL BRIDGES | AVERAGE | 0.909 | 0.872 | 0.809 | 0.879 | 0.868 | 0.671 |
| MAX | 0.917 | 0.913 | 0.844 | 0.930 | 0.936 | 0.751 | |
| MIN | 0.893 | 0.775 | 0.716 | 0.760 | 0.685 | 0.552 | |
| COV [%] | 0.6% | 3.5% | 3.6% | 3.7% | 8.0% | 6.0% | |
| IHS BRIDGES | AVERAGE | 0.910 | 0.874 | 0.810 | 0.878 | 0.872 | 0.671 |
| MAX | 0.916 | 0.913 | 0.843 | 0.902 | 0.936 | 0.751 | |
| MIN | 0.893 | 0.794 | 0.734 | 0.768 | 0.685 | 0.552 | |
| COV [%] | 0.6% | 3.4% | 3.4% | 3.6% | 8.1% | 6.5% | |
| OTHER BRIDGES ON THE NHS | AVERAGE | 0.909 | 0.869 | 0.807 | 0.881 | 0.863 | 0.670 |
| MAX | 0.917 | 0.907 | 0.844 | 0.930 | 0.925 | 0.729 | |
| MIN | 0.899 | 0.775 | 0.716 | 0.760 | 0.745 | 0.614 | |
| COV [%] | 0.5% | 3.6% | 3.8% | 3.9% | 7.9% | 5.5% | |
| NORMALIZED BY 3-S2 | NORMALIZED BY 2-S1-2 | ||||||
|---|---|---|---|---|---|---|---|
| Scenario #1 | Scenario #2 | Scenario #3 | Scenario #4 | Scenario #5 | Scenario #6 | ||
| ALL BRIDGES | AVERAGE | 0.905 | 0.846 | 0.785 | 0.864 | 0.878 | 0.676 |
| MAX | 0.917 | 0.908 | 0.839 | 0.904 | 0.946 | 0.729 | |
| MIN | 0.890 | 0.800 | 0.742 | 0.802 | 0.740 | 0.614 | |
| COV [%] | 1.1% | 3.9% | 3.8% | 3.0% | 7.4% | 5.2% | |
| IHS BRIDGES | AVERAGE | 0.905 | 0.842 | 0.782 | 0.866 | 0.884 | 0.681 |
| MAX | 0.917 | 0.904 | 0.834 | 0.904 | 0.943 | 0.725 | |
| MIN | 0.890 | 0.800 | 0.742 | 0.825 | 0.740 | 0.614 | |
| COV [%] | 1.2% | 4.0% | 3.9% | 2.6% | 7.1% | 5.1% | |
| OTHER BRIDGES ON THE NHS | AVERAGE | 0.905 | 0.850 | 0.789 | 0.863 | 0.871 | 0.671 |
| MAX | 0.917 | 0.908 | 0.839 | 0.902 | 0.946 | 0.729 | |
| MIN | 0.893 | 0.805 | 0.746 | 0.802 | 0.743 | 0.617 | |
| COV [%] | 1.0% | 3.9% | 3.7% | 3.5% | 7.8% | 5.3% | |
| NORMALIZED BY 3-S2 | NORMALIZED BY 2-S1-2 | ||||||
|---|---|---|---|---|---|---|---|
| Scenario #1 | Scenario #2 | Scenario #3 | Scenario #4 | Scenario #5 | Scenario #6 | ||
| ALL BRIDGES | AVERAGE | 0.909 | 0.858 | 0.795 | 0.861 | 0.876 | 0.667 |
| MAX | 0.917 | 0.902 | 0.846 | 0.900 | 0.944 | 0.736 | |
| MIN | 0.898 | 0.769 | 0.710 | 0.735 | 0.610 | 0.480 | |
| COV [%] | 0.5% | 4.4% | 4.6% | 5.4% | 9.0% | 7.5% | |
| IHS BRIDGES | AVERAGE | 0.910 | 0.858 | 0.795 | 0.866 | 0.898 | 0.676 |
| MAX | 0.917 | 0.899 | 0.830 | 0.900 | 0.938 | 0.710 | |
| MIN | 0.901 | 0.769 | 0.710 | 0.740 | 0.755 | 0.617 | |
| COV [%] | 0.5% | 4.7% | 4.7% | 5.7% | 5.3% | 4.3% | |
| OTHER BRIDGES ON THE NHS | AVERAGE | 0.908 | 0.857 | 0.796 | 0.857 | 0.859 | 0.661 |
| MAX | 0.914 | 0.902 | 0.846 | 0.895 | 0.944 | 0.736 | |
| MIN | 0.898 | 0.771 | 0.712 | 0.735 | 0.610 | 0.480 | |
| COV [%] | 0.5% | 4.2% | 4.6% | 5.2% | 10.5% | 9.0% | |
| NORMALIZED BY 3-S2 | NORMALIZED BY 2-S1-2 | ||||||
|---|---|---|---|---|---|---|---|
| Scenario #1 | Scenario #2 | Scenario #3 | Scenario #4 | Scenario #5 | Scenario #6 | ||
| ALL BRIDGES | AVERAGE | 0.901 | 0.845 | 0.780 | 0.848 | 0.891 | 0.668 |
| MAX | 0.918 | 0.907 | 0.838 | 0.909 | 0.950 | 0.732 | |
| MIN | 0.876 | 0.787 | 0.723 | 0.765 | 0.716 | 0.591 | |
| COV [%] | 1.2% | 3.7% | 3.6% | 4.2% | 5.7% | 5.1% | |
| IHS BRIDGES | AVERAGE | 0.897 | 0.830 | 0.766 | 0.849 | 0.889 | 0.661 |
| MAX | 0.918 | 0.883 | 0.816 | 0.906 | 0.950 | 0.732 | |
| MIN | 0.876 | 0.787 | 0.723 | 0.765 | 0.803 | 0.591 | |
| COV [%] | 1.3% | 3.2% | 2.9% | 4.8% | 5.1% | 5.1% | |
| OTHER BRIDGES ON THE NHS | AVERAGE | 0.905 | 0.855 | 0.790 | 0.848 | 0.893 | 0.674 |
| MAX | 0.917 | 0.907 | 0.838 | 0.909 | 0.947 | 0.728 | |
| MIN | 0.886 | 0.809 | 0.747 | 0.783 | 0.716 | 0.592 | |
| COV [%] | 1.0% | 3.7% | 3.5% | 3.8% | 6.3% | 5.2% | |
| NORMALIZED BY 3-S2 | NORMALIZED BY 2-S1-2 | ||||||
|---|---|---|---|---|---|---|---|
| Scenario #1 | Scenario #2 | Scenario #3 | Scenario #4 | Scenario #5 | Scenario #6 | ||
| ALL BRIDGES | AVERAGE | 0.910 | 0.852 | 0.790 | 0.861 | 0.864 | 0.665 |
| MAX | 0.976 | 0.903 | 0.838 | 1.045 | 0.929 | 0.729 | |
| MIN | 0.900 | 0.768 | 0.710 | 0.740 | 0.572 | 0.465 | |
| COV [%] | 1.2% | 5.0% | 5.2% | 7.3% | 9.2% | 7.3% | |
| IHS BRIDGES | AVERAGE | 0.908 | 0.858 | 0.796 | 0.881 | 0.879 | 0.674 |
| MAX | 0.915 | 0.886 | 0.821 | 0.900 | 0.922 | 0.696 | |
| MIN | 0.904 | 0.801 | 0.740 | 0.814 | 0.808 | 0.649 | |
| COV [%] | 0.4% | 3.3% | 3.4% | 2.8% | 4.6% | 2.5% | |
| OTHER BRIDGES ON THE NHS | AVERAGE | 0.910 | 0.850 | 0.788 | 0.854 | 0.859 | 0.662 |
| MAX | 0.976 | 0.903 | 0.838 | 1.045 | 0.929 | 0.729 | |
| MIN | 0.900 | 0.768 | 0.710 | 0.740 | 0.572 | 0.465 | |
| COV [%] | 1.4% | 5.4% | 5.7% | 8.0% | 10.1% | 8.2% | |
| NORMALIZED BY 3-S2 | NORMALIZED BY 2-S1-2 | ||||||
|---|---|---|---|---|---|---|---|
| Scenario #1 | Scenario #2 | Scenario #3 | Scenario #4 | Scenario #5 | Scenario #6 | ||
| ALL BRIDGES | AVERAGE | 0.901 | 0.844 | 0.782 | 0.859 | 0.871 | 0.668 |
| MAX | 0.917 | 0.900 | 0.832 | 0.907 | 0.945 | 0.747 | |
| MIN | 0.881 | 0.795 | 0.732 | 0.752 | 0.716 | 0.592 | |
| COV [%] | 1.0% | 3.4% | 3.5% | 5.0% | 7.0% | 5.1% | |
| IHS BRIDGES | AVERAGE | 0.902 | 0.845 | 0.786 | 0.880 | 0.855 | 0.660 |
| MAX | 0.917 | 0.900 | 0.832 | 0.903 | 0.942 | 0.708 | |
| MIN | 0.893 | 0.802 | 0.743 | 0.826 | 0.775 | 0.628 | |
| COV [%] | 0.9% | 3.5% | 3.3% | 3.2% | 7.4% | 4.7% | |
| OTHER BRIDGES ON THE NHS | AVERAGE | 0.901 | 0.844 | 0.781 | 0.852 | 0.876 | 0.670 |
| MAX | 0.917 | 0.896 | 0.828 | 0.907 | 0.945 | 0.747 | |
| MIN | 0.881 | 0.795 | 0.732 | 0.752 | 0.716 | 0.592 | |
| COV [%] | 1.0% | 3.5% | 3.6% | 5.1% | 7.1% | 5.4% | |
| NORMALIZED BY 3-S2 | NORMALIZED BY 2-S1-2 | ||||||
|---|---|---|---|---|---|---|---|
| Scenario #1 | Scenario #2 | Scenario #3 | Scenario #4 | Scenario #5 | Scenario #6 | ||
| ALL BRIDGES | AVERAGE | 0.906 | 0.854 | 0.794 | 0.889 | 0.804 | 0.640 |
| MAX | 0.915 | 0.891 | 0.823 | 0.912 | 0.923 | 0.704 | |
| MIN | 0.898 | 0.811 | 0.755 | 0.836 | 0.699 | 0.575 | |
| COV [%] | 0.7% | 2.8% | 2.9% | 2.2% | 11.4% | 8.0% | |
| IHS BRIDGES | AVERAGE | 0.904 | 0.862 | 0.808 | 0.889 | 0.716 | 0.588 |
| MAX | 0.905 | 0.869 | 0.815 | 0.891 | 0.733 | 0.600 | |
| MIN | 0.902 | 0.855 | 0.800 | 0.887 | 0.699 | 0.575 | |
| COV [%] | 0.3% | 1.1% | 1.3% | 0.4% | 3.4% | 3.0% | |
| OTHER BRIDGES ON THE NHS | AVERAGE | 0.907 | 0.853 | 0.792 | 0.889 | 0.823 | 0.652 |
| MAX | 0.915 | 0.891 | 0.823 | 0.912 | 0.923 | 0.704 | |
| MIN | 0.898 | 0.811 | 0.755 | 0.836 | 0.714 | 0.590 | |
| COV [%] | 0.8% | 3.1% | 3.0% | 2.5% | 12.5% | 8.4% | |
NOTE: Rating factors determined based on the LFR methodology. Separate flexural/shear rating factors unavailable
| NORMALIZED BY 3-S2 | NORMALIZED BY 2-S1-2 | ||||||
|---|---|---|---|---|---|---|---|
| Scenario #1 | Scenario #2 | Scenario #3 | Scenario #4 | Scenario #5 | Scenario #6 | ||
| ALL BRIDGES | AVERAGE | 0.909 | 0.869 | 0.806 | 0.867 | 0.869 | 0.673 |
| MAX | 0.916 | 1.075 | 1.008 | 0.925 | 0.941 | 0.844 | |
| MIN | 0.895 | 0.768 | 0.710 | 0.737 | 0.646 | 0.519 | |
| COV [%] | 0.6% | 5.9% | 6.2% | 5.8% | 8.9% | 9.6% | |
| IHS BRIDGES | AVERAGE | 0.912 | 0.864 | 0.800 | 0.877 | 0.900 | 0.675 |
| MAX | 0.916 | 0.921 | 0.860 | 0.920 | 0.924 | 0.722 | |
| MIN | 0.900 | 0.768 | 0.710 | 0.748 | 0.766 | 0.562 | |
| COV [%] | 0.4% | 4.4% | 4.6% | 5.1% | 5.1% | 6.4% | |
| OTHER BRIDGES ON THE NHS | AVERAGE | 0.908 | 0.870 | 0.808 | 0.864 | 0.860 | 0.672 |
| MAX | 0.916 | 1.075 | 1.008 | 0.925 | 0.941 | 0.844 | |
| MIN | 0.895 | 0.769 | 0.711 | 0.737 | 0.646 | 0.519 | |
| COV [%] | 0.6% | 6.3% | 6.6% | 5.9% | 9.1% | 10.3% | |
| NORMALIZED BY 3-S2 | NORMALIZED BY 2-S1-2 | ||||||
|---|---|---|---|---|---|---|---|
| Scenario #1 | Scenario #2 | Scenario #3 | Scenario #4 | Scenario #5 | Scenario #6 | ||
| ALL BRIDGES | AVERAGE | 0.903 | 0.852 | 0.790 | 0.854 | 0.880 | 0.677 |
| MAX | 0.917 | 1.075 | 1.008 | 0.906 | 0.950 | 0.844 | |
| MIN | 0.891 | 0.770 | 0.711 | 0.754 | 0.717 | 0.592 | |
| COV [%] | 1.0% | 5.9% | 5.9% | 4.5% | 5.8% | 6.4% | |
| IHS BRIDGES | AVERAGE | 0.901 | 0.837 | 0.776 | 0.863 | 0.885 | 0.671 |
| MAX | 0.916 | 0.899 | 0.831 | 0.904 | 0.950 | 0.705 | |
| MIN | 0.894 | 0.801 | 0.742 | 0.810 | 0.822 | 0.641 | |
| COV [%] | 0.9% | 3.6% | 3.4% | 3.2% | 5.3% | 3.7% | |
| OTHER BRIDGES ON THE NHS | AVERAGE | 0.903 | 0.856 | 0.793 | 0.852 | 0.879 | 0.679 |
| MAX | 0.917 | 1.075 | 1.008 | 0.906 | 0.945 | 0.844 | |
| MIN | 0.891 | 0.770 | 0.711 | 0.754 | 0.717 | 0.592 | |
| COV [%] | 1.0% | 6.5% | 6.5% | 4.7% | 6.0% | 7.1% | |
| NORMALIZED BY 3-S2 | NORMALIZED BY 2-S1-2 | ||||||
|---|---|---|---|---|---|---|---|
| Scenario #1 | Scenario #2 | Scenario #3 | Scenario #4 | Scenario #5 | Scenario #6 | ||
| ALL BRIDGES | AVERAGE | 0.909 | 0.867 | 0.807 | 0.871 | 0.834 | 0.640 |
| MAX | 0.923 | 0.903 | 0.843 | 0.938 | 0.930 | 0.724 | |
| MIN | 0.900 | 0.768 | 0.709 | 0.721 | 0.616 | 0.496 | |
| COV [%] | 0.4% | 3.5% | 3.8% | 4.8% | 12.0% | 8.9% | |
| IHS BRIDGES | AVERAGE | 0.910 | 0.876 | 0.814 | 0.877 | 0.836 | 0.639 |
| MAX | 0.917 | 0.898 | 0.839 | 0.900 | 0.924 | 0.706 | |
| MIN | 0.905 | 0.847 | 0.783 | 0.858 | 0.629 | 0.513 | |
| COV [%] | 0.4% | 1.8% | 2.3% | 1.8% | 13.7% | 10.1% | |
| OTHER BRIDGES ON THE NHS | AVERAGE | 0.909 | 0.865 | 0.805 | 0.870 | 0.834 | 0.640 |
| MAX | 0.923 | 0.903 | 0.843 | 0.938 | 0.930 | 0.724 | |
| MIN | 0.900 | 0.768 | 0.709 | 0.721 | 0.616 | 0.496 | |
| COV [%] | 0.4% | 3.7% | 4.0% | 5.3% | 11.8% | 8.7% | |
| NORMALIZED BY 3-S2 | NORMALIZED BY 2-S1-2 | ||||||
|---|---|---|---|---|---|---|---|
| Scenario #1 | Scenario #2 | Scenario #3 | Scenario #4 | Scenario #5 | Scenario #6 | ||
| ALL BRIDGES | AVERAGE | 0.900 | 0.845 | 0.780 | 0.863 | 0.874 | 0.665 |
| MAX | 0.917 | 0.914 | 0.845 | 0.905 | 0.950 | 0.719 | |
| MIN | 0.789 | 0.719 | 0.596 | 0.788 | 0.736 | 0.512 | |
| COV [%] | 2.4% | 4.5% | 5.5% | 3.6% | 6.0% | 5.4% | |
| IHS BRIDGES | AVERAGE | 0.906 | 0.834 | 0.771 | 0.861 | 0.884 | 0.673 |
| MAX | 0.917 | 0.886 | 0.819 | 0.901 | 0.932 | 0.711 | |
| MIN | 0.890 | 0.784 | 0.713 | 0.837 | 0.810 | 0.636 | |
| COV [%] | 1.2% | 3.8% | 4.3% | 2.7% | 5.2% | 4.4% | |
| OTHER BRIDGES ON THE NHS | AVERAGE | 0.899 | 0.847 | 0.782 | 0.863 | 0.871 | 0.664 |
| MAX | 0.917 | 0.914 | 0.845 | 0.905 | 0.950 | 0.719 | |
| MIN | 0.789 | 0.719 | 0.596 | 0.788 | 0.736 | 0.512 | |
| COV [%] | 2.5% | 4.7% | 5.8% | 3.8% | 6.2% | 5.5% | |
| NORMALIZED BY 3-S2 | NORMALIZED BY 2-S1-2 | ||||||
|---|---|---|---|---|---|---|---|
| Scenario #1 | Scenario #2 | Scenario #3 | Scenario #4 | Scenario #5 | Scenario #6 | ||
| ALL BRIDGES | AVERAGE | 0.908 | 0.858 | 0.797 | 0.873 | 0.860 | 0.663 |
| MAX | 0.916 | 0.898 | 0.830 | 0.908 | 0.924 | 0.731 | |
| MIN | 0.898 | 0.776 | 0.717 | 0.735 | 0.738 | 0.612 | |
| COV [%] | 0.7% | 3.8% | 3.8% | 5.0% | 8.4% | 4.9% | |
| IHS BRIDGES | AVERAGE | 0.902 | 0.855 | 0.799 | 0.894 | 0.744 | 0.618 |
| MAX | 0.902 | 0.855 | 0.799 | 0.894 | 0.744 | 0.618 | |
| MIN | 0.902 | 0.855 | 0.799 | 0.894 | 0.744 | 0.618 | |
| COV [%] | N/A | N/A | N/A | N/A | N/A | N/A | |
| OTHER BRIDGES ON THE NHS | AVERAGE | 0.908 | 0.858 | 0.797 | 0.872 | 0.868 | 0.666 |
| MAX | 0.916 | 0.898 | 0.830 | 0.908 | 0.924 | 0.731 | |
| MIN | 0.898 | 0.776 | 0.717 | 0.735 | 0.738 | 0.612 | |
| COV [%] | 0.7% | 4.0% | 4.0% | 5.0% | 9.0% | 5.1% | |
NOTE: Rating factors determined based on the LFR methodology. N/A: Statistically not applicable (only 1 bridge).
POSTING ANALYSIS
| Bridge Type | #. of IHS Bridges Rated | # of Other NHS Bridges Rated | Vehicle Configuration | RF < 1.0 Flexure Controls |
RF < 1.0 Shear Controls |
Flex or Shear RF < 1.0 | # of IHS Bridges w/ RF < 1.0 | # of Other NHS Bridges w/ RF < 1.0 | % of IHS Bridges Rated w/ RF < 1.0 | % of Other NHS Bridges Rated w/ RF < 1.0 | |
|---|---|---|---|---|---|---|---|---|---|---|---|
| 1 | Concrete Slab | 18 | 40 | 3-S2 | 4 | 0 | 4 | 2 | 2 | 11.1% | 5.0% |
| 18 | 40 | Scenario #1 | 5 | 0 | 5 | 2 | 3 | 11.1% | 7.5% | ||
| 18 | 40 | Scenario #2 | 8 | 0 | 8 | 2 | 6 | 11.1% | 15.0% | ||
| 18 | 40 | Scenario #3 | 10 | 0 | 10 | 2 | 8 | 11.1% | 20.0% | ||
| 18 | 40 | 2-S1-2 | 0 | 0 | 0 | 0 | 0 | 0.0% | 0.0% | ||
| 18 | 40 | Scenario #4 | 3 | 0 | 3 | 2 | 1 | 11.1% | 2.5% | ||
| 18 | 40 | Scenario #5 | 0 | 0 | 0 | 0 | 0 | 0.0% | 0.0% | ||
| 18 | 40 | Scenario #6 | 4 | 0 | 4 | 2 | 2 | 11.1% | 5.0% | ||
| 2 | Concrete Girder / Simple span | 30 | 39 | 3-S2 | 1 | 0 | 1 | 1 | 0 | 3.3% | 0.0% |
| 30 | 39 | Scenario #1 | 1 | 0 | 1 | 1 | 0 | 3.3% | 0.0% | ||
| 30 | 39 | Scenario #2 | 1 | 0 | 1 | 1 | 0 | 3.3% | 0.0% | ||
| 30 | 39 | Scenario #3 | 2 | 0 | 2 | 2 | 0 | 6.7% | 0.0% | ||
| 30 | 39 | 2-S1-2 | 1 | 0 | 1 | 1 | 0 | 3.3% | 0.0% | ||
| 30 | 39 | Scenario #4 | 1 | 0 | 1 | 1 | 0 | 3.3% | 0.0% | ||
| 30 | 39 | Scenario #5 | 1 | 0 | 1 | 1 | 0 | 3.3% | 0.0% | ||
| 30 | 39 | Scenario #6 | 2 | 0 | 2 | 2 | 0 | 6.7% | 0.0% | ||
| 3 | Concrete Girder / Cont. spans | 16 | 32 | 3-S2 | 1 | 0 | 1 | 1 | 0 | 6.3% | 0.0% |
| 16 | 32 | Scenario #1 | 1 | 0 | 1 | 1 | 0 | 6.3% | 0.0% | ||
| 16 | 32 | Scenario #2 | 2 | 0 | 2 | 1 | 1 | 6.3% | 3.1% | ||
| 16 | 32 | Scenario #3 | 2 | 0 | 2 | 1 | 1 | 6.3% | 3.1% | ||
| 16 | 32 | 2-S1-2 | 1 | 0 | 1 | 1 | 0 | 6.3% | 0.0% | ||
| 16 | 32 | Scenario #4 | 2 | 0 | 2 | 1 | 1 | 6.3% | 3.1% | ||
| 16 | 32 | Scenario #5 | 2 | 0 | 2 | 1 | 1 | 6.3% | 3.1% | ||
| 16 | 32 | Scenario #6 | 2 | 1 | 3 | 2 | 1 | 12.5% | 3.1% | ||
| 4 | Steel Girder / Simple span, L < 100 | 14 | 38 | 3-S2 | 2 | 0 | 2 | 0 | 2 | 0.0% | 5.3% |
| 14 | 38 | Scenario #1 | 2 | 0 | 2 | 0 | 2 | 0.0% | 5.3% | ||
| 14 | 38 | Scenario #2 | 4 | 0 | 4 | 0 | 4 | 0.0% | 10.5% | ||
| 14 | 38 | Scenario #3 | 4 | 0 | 4 | 0 | 4 | 0.0% | 10.5% | ||
| 14 | 38 | 2-S1-2 | 0 | 0 | 0 | 0 | 0 | 0.0% | 0.0% | ||
| 14 | 38 | Scenario #4 | 2 | 0 | 2 | 0 | 2 | 0.0% | 5.3% | ||
| 14 | 38 | Scenario #5 | 0 | 0 | 0 | 0 | 0 | 0.0% | 0.0% | ||
| 14 | 38 | Scenario #6 | 2 | 0 | 2 | 0 | 2 | 0.0% | 5.3% | ||
| 5 | Steel Girder / Simple span, L > 100 | 19 | 17 | 3-S2 | 0 | 2 | 2 | 1 | 1 | 5.3% | 5.9% |
| 19 | 17 | Scenario #1 | 0 | 2 | 2 | 1 | 1 | 5.3% | 5.9% | ||
| 19 | 17 | Scenario #2 | 0 | 2 | 2 | 1 | 1 | 5.3% | 5.9% | ||
| 19 | 17 | Scenario #3 | 0 | 2 | 2 | 1 | 1 | 5.3% | 5.9% | ||
| 19 | 17 | 2-S1-2 | 0 | 1 | 1 | 0 | 1 | 0.0% | 5.9% | ||
| 19 | 17 | Scenario #4 | 0 | 1 | 1 | 0 | 1 | 0.0% | 5.9% | ||
| 19 | 17 | Scenario #5 | 0 | 2 | 2 | 1 | 1 | 5.3% | 5.9% | ||
| 19 | 17 | Scenario #6 | 2 | 2 | 4 | 2 | 2 | 10.5% | 11.8% | ||
| 6 | Steel Girder / Cont. spans, L < 100 | 21 | 28 | 3-S2 | 0 | 0 | 0 | 0 | 0 | 0.0% | 0.0% |
| 21 | 28 | Scenario #1 | 0 | 0 | 0 | 0 | 0 | 0.0% | 0.0% | ||
| 21 | 28 | Scenario #2 | 0 | 0 | 0 | 0 | 0 | 0.0% | 0.0% | ||
| 21 | 28 | Scenario #3 | 1 | 0 | 1 | 0 | 1 | 0.0% | 3.6% | ||
| 21 | 28 | 2-S1-2 | 0 | 0 | 0 | 0 | 0 | 0.0% | 0.0% | ||
| 21 | 28 | Scenario #4 | 0 | 0 | 0 | 0 | 0 | 0.0% | 0.0% | ||
| 21 | 28 | Scenario #5 | 0 | 0 | 0 | 0 | 0 | 0.0% | 0.0% | ||
| 21 | 28 | Scenario #6 | 1 | 0 | 1 | 0 | 1 | 0.0% | 3.6% | ||
| 7 | Steel Girder / Cont. spans, L > 100 | 11 | 33 | 3-S2 | 0 | 0 | 0 | 0 | 0 | 0.0% | 0.0% |
| 11 | 33 | Scenario #1 | 0 | 0 | 0 | 0 | 0 | 0.0% | 0.0% | ||
| 11 | 33 | Scenario #2 | 0 | 0 | 0 | 0 | 0 | 0.0% | 0.0% | ||
| 11 | 33 | Scenario #3 | 0 | 0 | 0 | 0 | 0 | 0.0% | 0.0% | ||
| 11 | 33 | 2-S1-2 | 0 | 0 | 0 | 0 | 0 | 0.0% | 0.0% | ||
| 11 | 33 | Scenario #4 | 0 | 0 | 0 | 0 | 0 | 0.0% | 0.0% | ||
| 11 | 33 | Scenario #5 | 0 | 0 | 0 | 0 | 0 | 0.0% | 0.0% | ||
| 11 | 33 | Scenario #6 | 1 | 0 | 1 | 1 | 0 | 9.1% | 0.0% | ||
| 8 | Steel Girder / Floor-beam * | 2 | 9 | 3-S2 | N/A | N/A | 0 | 0 | 0 | 0.0% | 0.0% |
| 2 | 9 | Scenario #1 | N/A | N/A | 0 | 0 | 0 | 0.0% | 0.0% | ||
| 2 | 9 | Scenario #2 | N/A | N/A | 0 | 0 | 0 | 0.0% | 0.0% | ||
| 2 | 9 | Scenario #3 | N/A | N/A | 0 | 0 | 0 | 0.0% | 0.0% | ||
| 2 | 9 | 2-S1-2 | N/A | N/A | 0 | 0 | 0 | 0.0% | 0.0% | ||
| 2 | 9 | Scenario #4 | N/A | N/A | 0 | 0 | 0 | 0.0% | 0.0% | ||
| 2 | 9 | Scenario #5 | N/A | N/A | 0 | 0 | 0 | 0.0% | 0.0% | ||
| 2 | 9 | Scenario #6 | N/A | N/A | 0 | 0 | 0 | 0.0% | 0.0% | ||
| 9 | Conc. Tee beams | 11 | 42 | 3-S2 | 4 | 2 | 6 | 0 | 6 | 0.0% | 14.3% |
| 11 | 42 | Scenario #1 | 7 | 4 | 11 | 0 | 11 | 0.0% | 26.2% | ||
| 11 | 42 | Scenario #2 | 9 | 5 | 14 | 0 | 14 | 0.0% | 33.3% | ||
| 11 | 42 | Scenario #3 | 11 | 6 | 17 | 1 | 16 | 9.1% | 38.1% | ||
| 11 | 42 | 2-S1-2 | 0 | 0 | 0 | 0 | 0 | 0.0% | 0.0% | ||
| 11 | 42 | Scenario #4 | 4 | 1 | 5 | 0 | 5 | 0.0% | 11.9% | ||
| 11 | 42 | Scenario #5 | 0 | 1 | 1 | 0 | 1 | 0.0% | 2.4% | ||
| 11 | 42 | Scenario #6 | 7 | 5 | 12 | 1 | 11 | 9.1% | 26.2% | ||
| 10 | Conc. Box beams | 10 | 44 | 3-S2 | 0 | 0 | 0 | 0 | 0 | 0.0% | 0.0% |
| 10 | 44 | Scenario #1 | 0 | 0 | 0 | 0 | 0 | 0.0% | 0.0% | ||
| 10 | 44 | Scenario #2 | 0 | 0 | 0 | 0 | 0 | 0.0% | 0.0% | ||
| 10 | 44 | Scenario #3 | 1 | 0 | 1 | 0 | 1 | 0.0% | 2.3% | ||
| 10 | 44 | 2-S1-2 | 0 | 0 | 0 | 0 | 0 | 0.0% | 0.0% | ||
| 10 | 44 | Scenario #4 | 0 | 0 | 0 | 0 | 0 | 0.0% | 0.0% | ||
| 10 | 44 | Scenario #5 | 0 | 0 | 0 | 0 | 0 | 0.0% | 0.0% | ||
| 10 | 44 | Scenario #6 | 0 | 0 | 0 | 0 | 0 | 0.0% | 0.0% | ||
| 11 | Steel Through truss* | 1 | 15 | 3-S2 | Axial | Axial | 0 | 0 | 0 | 0.0% | 0.0% |
| 1 | 15 | Scenario #1 | Axial | Axial | 0 | 0 | 0 | 0.0% | 0.0% | ||
| 1 | 15 | Scenario #2 | Axial | Axial | 0 | 0 | 0 | 0.0% | 0.0% | ||
| 1 | 15 | Scenario #3 | Axial | Axial | 0 | 0 | 0 | 0.0% | 0.0% | ||
| 1 | 15 | 2-S1-2 | Axial | Axial | 0 | 0 | 0 | 0.0% | 0.0% | ||
| 1 | 15 | Scenario #4 | Axial | Axial | 0 | 0 | 0 | 0.0% | 0.0% | ||
| 1 | 15 | Scenario #5 | Axial | Axial | 0 | 0 | 0 | 0.0% | 0.0% | ||
| 1 | 15 | Scenario #6 | Axial | Axial | 0 | 0 | 0 | 0.0% | 0.0% | ||
| TOTAL | 153 | 337 | 3-S2 | 16 | 5 | 11 | 3.3% | 3.3% | |||
| 153 | 337 | Scenario #1 | 22 | 5 | 17 | 3.3% | 5.0% | ||||
| 153 | 337 | Scenario #2 | 31 | 5 | 26 | 3.3% | 7.7% | ||||
| 153 | 337 | Scenario #3 | 39 | 7 | 32 | 4.6% | 9.5% | ||||
| 153 | 337 | 2-S1-2 | 3 | 2 | 1 | 1.3% | 0.3% | ||||
| 153 | 337 | Scenario #4 | 14 | 4 | 10 | 2.6% | 3.0% | ||||
| 153 | 337 | Scenario #5 | 6 | 3 | 3 | 2.0% | 0.9% | ||||
| 153 | 337 | Scenario #6 | 29 | 10 | 19 | 6.5% | 5.6% | ||||
N/A: Not applicable.
*: Girder-floorbeam systems and through trusses were rated using the Load Factor Rating (LFR) methodology. All other bridge types were rated using the Load and Resistance Factor Rating (LRFR) methodology.
| Span Length [ft.] |
# of IHS Bridges Rated | # of Other NHS Bridges Rated | Vehicle Configuration | # of IHS Bridges w/ RF < 1.0 | # of Other NHS Bridges w/ RF < 1.0 | % of IHS Bridges Rated w/ RF < 1.0 | % of Other NHS Bridges Rated w/ RF < 1.0 |
|---|---|---|---|---|---|---|---|
| <20 | 0 | 8 | 3-S2 | 0 | 0 | 0.0% | 0.0% |
| 0 | 8 | Scenario #1 | 0 | 0 | 0.0% | 0.0% | |
| 0 | 8 | Scenario #2 | 0 | 1 | 0.0% | 12.5% | |
| 0 | 8 | Scenario #3 | 0 | 1 | 0.0% | 12.5% | |
| 0 | 8 | 2-S1-2 | 0 | 0 | 0.0% | 0.0% | |
| 0 | 8 | Scenario #4 | 0 | 0 | 0.0% | 0.0% | |
| 0 | 8 | Scenario #5 | 0 | 0 | 0.0% | 0.0% | |
| 0 | 8 | Scenario #6 | 0 | 0 | 0.0% | 0.0% | |
| 20-40 | 24 | 67 | 3-S2 | 2 | 5 | 8.3% | 7.5% |
| 24 | 67 | Scenario #1 | 2 | 10 | 8.3% | 14.9% | |
| 24 | 67 | Scenario #2 | 2 | 13 | 8.3% | 19.4% | |
| 24 | 67 | Scenario #3 | 2 | 16 | 8.3% | 23.9% | |
| 24 | 67 | 2-S1-2 | 0 | 0 | 0.0% | 0.0% | |
| 24 | 67 | Scenario #4 | 2 | 5 | 8.3% | 7.5% | |
| 24 | 67 | Scenario #5 | 0 | 0 | 0.0% | 0.0% | |
| 24 | 67 | Scenario #6 | 2 | 6 | 8.3% | 9.0% | |
| 40-60 | 25 | 76 | 3-S2 | 1 | 4 | 4.0% | 5.3% |
| 25 | 76 | Scenario #1 | 1 | 5 | 4.0% | 6.6% | |
| 25 | 76 | Scenario #2 | 1 | 8 | 4.0% | 10.5% | |
| 25 | 76 | Scenario #3 | 2 | 10 | 8.0% | 13.2% | |
| 25 | 76 | 2-S1-2 | 1 | 0 | 4.0% | 0.0% | |
| 25 | 76 | Scenario #4 | 1 | 2 | 4.0% | 2.6% | |
| 25 | 76 | Scenario #5 | 1 | 1 | 4.0% | 1.3% | |
| 25 | 76 | Scenario #6 | 1 | 7 | 4.0% | 9.2% | |
| 60-80 | 31 | 59 | 3-S2 | 1 | 1 | 3.2% | 1.7% |
| 31 | 59 | Scenario #1 | 1 | 1 | 3.2% | 1.7% | |
| 31 | 59 | Scenario #2 | 1 | 2 | 3.2% | 3.4% | |
| 31 | 59 | Scenario #3 | 2 | 2 | 6.5% | 3.4% | |
| 31 | 59 | 2-S1-2 | 1 | 0 | 3.2% | 0.0% | |
| 31 | 59 | Scenario #4 | 1 | 2 | 3.2% | 3.4% | |
| 31 | 59 | Scenario #5 | 1 | 1 | 3.2% | 1.7% | |
| 31 | 59 | Scenario #6 | 3 | 2 | 9.7% | 3.4% | |
| 80-100 | 31 | 44 | 3-S2 | 0 | 0 | 0.0% | 0.0% |
| 31 | 44 | Scenario #1 | 0 | 0 | 0.0% | 0.0% | |
| 31 | 44 | Scenario #2 | 0 | 1 | 0.0% | 2.3% | |
| 31 | 44 | Scenario #3 | 0 | 2 | 0.0% | 4.5% | |
| 31 | 44 | 2-S1-2 | 0 | 0 | 0.0% | 0.0% | |
| 31 | 44 | Scenario #4 | 0 | 0 | 0.0% | 0.0% | |
| 31 | 44 | Scenario #5 | 0 | 0 | 0.0% | 0.0% | |
| 31 | 44 | Scenario #6 | 1 | 2 | 3.2% | 4.5% | |
| 100-120 | 22 | 32 | 3-S2 | 1 | 1 | 4.5% | 3.1% |
| 22 | 32 | Scenario #1 | 1 | 1 | 4.5% | 3.1% | |
| 22 | 32 | Scenario #2 | 1 | 1 | 4.5% | 3.1% | |
| 22 | 32 | Scenario #3 | 1 | 1 | 4.5% | 3.1% | |
| 22 | 32 | 2-S1-2 | 0 | 1 | 0.0% | 3.1% | |
| 22 | 32 | Scenario #4 | 0 | 1 | 0.0% | 3.1% | |
| 22 | 32 | Scenario #5 | 1 | 1 | 4.5% | 3.1% | |
| 22 | 32 | Scenario #6 | 1 | 2 | 4.5% | 6.3% | |
| 120-140 | 14 | 11 | 3-S2 | 0 | 0 | 0.0% | 0.0% |
| 14 | 11 | Scenario #1 | 0 | 0 | 0.0% | 0.0% | |
| 14 | 11 | Scenario #2 | 0 | 0 | 0.0% | 0.0% | |
| 14 | 11 | Scenario #3 | 0 | 0 | 0.0% | 0.0% | |
| 14 | 11 | 2-S1-2 | 0 | 0 | 0.0% | 0.0% | |
| 14 | 11 | Scenario #4 | 0 | 0 | 0.0% | 0.0% | |
| 14 | 11 | Scenario #5 | 0 | 0 | 0.0% | 0.0% | |
| 14 | 11 | Scenario #6 | 0 | 0 | 0.0% | 0.0% | |
| 140-160 | 2 | 10 | 3-S2 | 0 | 0 | 0.0% | 0.0% |
| 2 | 10 | Scenario #1 | 0 | 0 | 0.0% | 0.0% | |
| 2 | 10 | Scenario #2 | 0 | 0 | 0.0% | 0.0% | |
| 2 | 10 | Scenario #3 | 0 | 0 | 0.0% | 0.0% | |
| 2 | 10 | 2-S1-2 | 0 | 0 | 0.0% | 0.0% | |
| 2 | 10 | Scenario #4 | 0 | 0 | 0.0% | 0.0% | |
| 2 | 10 | Scenario #5 | 0 | 0 | 0.0% | 0.0% | |
| 2 | 10 | Scenario #6 | 0 | 0 | 0.0% | 0.0% | |
| 160-180 | 1 | 6 | 3-S2 | 0 | 0 | 0.0% | 0.0% |
| 1 | 6 | Scenario #1 | 0 | 0 | 0.0% | 0.0% | |
| 1 | 6 | Scenario #2 | 0 | 0 | 0.0% | 0.0% | |
| 1 | 6 | Scenario #3 | 0 | 0 | 0.0% | 0.0% | |
| 1 | 6 | 2-S1-2 | 0 | 0 | 0.0% | 0.0% | |
| 1 | 6 | Scenario #4 | 0 | 0 | 0.0% | 0.0% | |
| 1 | 6 | Scenario #5 | 0 | 0 | 0.0% | 0.0% | |
| 1 | 6 | Scenario #6 | 1 | 0 | 100.0% | 0.0% | |
| 180-200 | 1 | 1 | 3-S2 | 0 | 0 | 0.0% | 0.0% |
| 1 | 1 | Scenario #1 | 0 | 0 | 0.0% | 0.0% | |
| 1 | 1 | Scenario #2 | 0 | 0 | 0.0% | 0.0% | |
| 1 | 1 | Scenario #3 | 0 | 0 | 0.0% | 0.0% | |
| 1 | 1 | 2-S1-2 | 0 | 0 | 0.0% | 0.0% | |
| 1 | 1 | Scenario #4 | 0 | 0 | 0.0% | 0.0% | |
| 1 | 1 | Scenario #5 | 0 | 0 | 0.0% | 0.0% | |
| 1 | 1 | Scenario #6 | 1 | 0 | 100.0% | 0.0% | |
| >200 | 2 | 23 | 3-S2 | 0 | 0 | 0.0% | 0.0% |
| 2 | 23 | Scenario #1 | 0 | 0 | 0.0% | 0.0% | |
| 2 | 23 | Scenario #2 | 0 | 0 | 0.0% | 0.0% | |
| 2 | 23 | Scenario #3 | 0 | 0 | 0.0% | 0.0% | |
| 2 | 23 | 2-S1-2 | 0 | 0 | 0.0% | 0.0% | |
| 2 | 23 | Scenario #4 | 0 | 0 | 0.0% | 0.0% | |
| 2 | 23 | Scenario #5 | 0 | 0 | 0.0% | 0.0% | |
| 2 | 23 | Scenario #6 | 0 | 0 | 0.0% | 0.0% | |
| TOTAL | 153 | 337 | 5 | 11 | 3.3% | 3.3% | |
| 153 | 337 | 5 | 17 | 3.3% | 5.0% | ||
| 153 | 337 | 5 | 26 | 3.3% | 7.7% | ||
| 153 | 337 | 7 | 32 | 4.6% | 9.5% | ||
| 153 | 337 | 2 | 1 | 1.3% | 0.3% | ||
| 153 | 337 | 4 | 10 | 2.6% | 3.0% | ||
| 153 | 337 | 3 | 3 | 2.0% | 0.9% | ||
| 153 | 337 | 10 | 19 | 6.5% | 5.6% |
| Year Built | #. of IHS Bridges Rated | # of Other NHS Bridges Rated | Vehicle Configuration | # of IHS Bridges w/ RF < 1.0 | # of Other NHS Bridges w/ RF < 1.0 | % of IHS Bridges Rated w/ RF < 1.0 | % of Other NHS Bridges Rated w/ RF < 1.0 |
|---|---|---|---|---|---|---|---|
| <1920 | 0 | 2 | 3-S2 | 0 | 0 | 0.0% | 0.0% |
| 0 | 2 | Scenario #1 | 0 | 0 | 0.0% | 0.0% | |
| 0 | 2 | Scenario #2 | 0 | 1 | 0.0% | 50.0% | |
| 0 | 2 | Scenario #3 | 0 | 1 | 0.0% | 50.0% | |
| 0 | 2 | 2-S1-2 | 0 | 0 | 0.0% | 0.0% | |
| 0 | 2 | Scenario #4 | 0 | 0 | 0.0% | 0.0% | |
| 0 | 2 | Scenario #5 | 0 | 0 | 0.0% | 0.0% | |
| 0 | 2 | Scenario #6 | 0 | 0 | 0.0% | 0.0% | |
| 1920-1930 | 0 | 20 | 3-S2 | 0 | 2 | 0.0% | 10.0% |
| 0 | 20 | Scenario #1 | 0 | 2 | 0.0% | 10.0% | |
| 0 | 20 | Scenario #2 | 0 | 3 | 0.0% | 15.0% | |
| 0 | 20 | Scenario #3 | 0 | 4 | 0.0% | 20.0% | |
| 0 | 20 | 2-S1-2 | 0 | 0 | 0.0% | 0.0% | |
| 0 | 20 | Scenario #4 | 0 | 2 | 0.0% | 10.0% | |
| 0 | 20 | Scenario #5 | 0 | 0 | 0.0% | 0.0% | |
| 0 | 20 | Scenario #6 | 0 | 2 | 0.0% | 10.0% | |
| 1930-1940 | 0 | 42 | 3-S2 | 0 | 3 | 0.0% | 7.1% |
| 0 | 42 | Scenario #1 | 0 | 6 | 0.0% | 14.3% | |
| 0 | 42 | Scenario #2 | 0 | 9 | 0.0% | 21.4% | |
| 0 | 42 | Scenario #3 | 0 | 10 | 0.0% | 23.8% | |
| 0 | 42 | 2-S1-2 | 0 | 0 | 0.0% | 0.0% | |
| 0 | 42 | Scenario #4 | 0 | 3 | 0.0% | 7.1% | |
| 0 | 42 | Scenario #5 | 0 | 0 | 0.0% | 0.0% | |
| 0 | 42 | Scenario #6 | 0 | 6 | 0.0% | 14.3% | |
| 1940-1950 | 0 | 21 | 3-S2 | 0 | 0 | 0.0% | 0.0% |
| 0 | 21 | Scenario #1 | 0 | 1 | 0.0% | 4.8% | |
| 0 | 21 | Scenario #2 | 0 | 1 | 0.0% | 4.8% | |
| 0 | 21 | Scenario #3 | 0 | 3 | 0.0% | 14.3% | |
| 0 | 21 | 2-S1-2 | 0 | 0 | 0.0% | 0.0% | |
| 0 | 21 | Scenario #4 | 0 | 0 | 0.0% | 0.0% | |
| 0 | 21 | Scenario #5 | 0 | 0 | 0.0% | 0.0% | |
| 0 | 21 | Scenario #6 | 0 | 2 | 0.0% | 9.5% | |
| 1950-1960 | 21 | 41 | 3-S2 | 0 | 2 | 0.0% | 4.9% |
| 21 | 41 | Scenario #1 | 0 | 2 | 0.0% | 4.9% | |
| 21 | 41 | Scenario #2 | 0 | 5 | 0.0% | 12.2% | |
| 21 | 41 | Scenario #3 | 1 | 6 | 4.8% | 14.6% | |
| 21 | 41 | 2-S1-2 | 0 | 0 | 0.0% | 0.0% | |
| 21 | 41 | Scenario #4 | 0 | 1 | 0.0% | 2.4% | |
| 21 | 41 | Scenario #5 | 0 | 1 | 0.0% | 2.4% | |
| 21 | 41 | Scenario #6 | 1 | 4 | 4.8% | 9.8% | |
| 1960-1970 | 58 | 45 | 3-S2 | 4 | 2 | 6.9% | 4.4% |
| 58 | 45 | Scenario #1 | 4 | 2 | 6.9% | 4.4% | |
| 58 | 45 | Scenario #2 | 4 | 2 | 6.9% | 4.4% | |
| 58 | 45 | Scenario #3 | 4 | 2 | 6.9% | 4.4% | |
| 58 | 45 | 2-S1-2 | 1 | 1 | 1.7% | 2.2% | |
| 58 | 45 | Scenario #4 | 3 | 1 | 5.2% | 2.2% | |
| 58 | 45 | Scenario #5 | 2 | 1 | 3.4% | 2.2% | |
| 58 | 45 | Scenario #6 | 5 | 2 | 8.6% | 4.4% | |
| 1970-1980 | 35 | 37 | 3-S2 | 0 | 0 | 0.0% | 0.0% |
| 35 | 37 | Scenario #1 | 0 | 1 | 0.0% | 0.0% | |
| 35 | 37 | Scenario #2 | 0 | 1 | 0.0% | 0.0% | |
| 35 | 37 | Scenario #3 | 0 | 1 | 0.0% | 0.0% | |
| 35 | 37 | 2-S1-2 | 0 | 0 | 0.0% | 0.0% | |
| 35 | 37 | Scenario #4 | 0 | 0 | 0.0% | 0.0% | |
| 35 | 37 | Scenario #5 | 0 | 0 | 0.0% | 0.0% | |
| 35 | 37 | Scenario #6 | 0 | 0 | 0.0% | 0.0% | |
| 1980-1990 | 18 | 38 | 3-S2 | 1 | 0 | 5.6% | 0.0% |
| 18 | 38 | Scenario #1 | 1 | 1 | 5.6% | 2.6% | |
| 18 | 38 | Scenario #2 | 1 | 2 | 5.6% | 5.3% | |
| 18 | 38 | Scenario #3 | 2 | 3 | 11.1% | 7.9% | |
| 18 | 38 | 2-S1-2 | 1 | 0 | 5.6% | 0.0% | |
| 18 | 38 | Scenario #4 | 1 | 2 | 5.6% | 5.3% | |
| 18 | 38 | Scenario #5 | 1 | 1 | 5.6% | 2.6% | |
| 18 | 38 | Scenario #6 | 3 | 1 | 16.7% | 2.6% | |
| 1990-2000 | 11 | 40 | 3-S2 | 0 | 2 | 0.0% | 5.0% |
| 11 | 40 | Scenario #1 | 0 | 2 | 0.0% | 5.0% | |
| 11 | 40 | Scenario #2 | 0 | 2 | 0.0% | 5.0% | |
| 11 | 40 | Scenario #3 | 0 | 2 | 0.0% | 5.0% | |
| 11 | 40 | 2-S1-2 | 0 | 0 | 0.0% | 0.0% | |
| 11 | 40 | Scenario #4 | 0 | 1 | 0.0% | 2.5% | |
| 11 | 40 | Scenario #5 | 0 | 0 | 0.0% | 0.0% | |
| 11 | 40 | Scenario #6 | 0 | 2 | 0.0% | 5.0% | |
| >2000 | 10 | 51 | 3-S2 | 0 | 0 | 0.0% | 0.0% |
| 10 | 51 | Scenario #1 | 0 | 0 | 0.0% | 0.0% | |
| 10 | 51 | Scenario #2 | 0 | 0 | 0.0% | 0.0% | |
| 10 | 51 | Scenario #3 | 0 | 0 | 0.0% | 0.0% | |
| 10 | 51 | 2-S1-2 | 0 | 0 | 0.0% | 0.0% | |
| 10 | 51 | Scenario #4 | 0 | 0 | 0.0% | 0.0% | |
| 10 | 51 | Scenario #5 | 0 | 0 | 0.0% | 0.0% | |
| 10 | 51 | Scenario #6 | 1 | 0 | 10.0% | 0.0% | |
| TOTAL | 153 | 337 | 3-S2 | 5 | 11 | 3.3% | 3.3% |
| 153 | 337 | Scenario #1 | 5 | 17 | 3.3% | 5.0% | |
| 153 | 337 | Scenario #2 | 5 | 26 | 3.3% | 7.7% | |
| 153 | 337 | Scenario #3 | 7 | 32 | 4.6% | 9.5% | |
| 153 | 337 | 2-S1-2 | 2 | 1 | 1.3% | 0.3% | |
| 153 | 337 | Scenario #4 | 4 | 10 | 2.6% | 3.0% | |
| 153 | 337 | Scenario #5 | 3 | 3 | 2.0% | 0.9% | |
| 153 | 337 | Scenario #6 | 10 | 19 | 6.5% | 5.6% |
| LOAD RATING RESULTS | PROJECTED NUMBER OF BRIDGES WITH POSTING ISSUES FOR ENTIRE INVENTORY | |||||||
|---|---|---|---|---|---|---|---|---|
| Bridge Type | #. of IHS Bridges Rated | # of Other NHS Bridges Rated | Vehicle Configuration | % of IHS Bridges Rated w/ RF < 1.0 | % of Other NHS Bridges Rated w/ RF < 1.0 | #. of IHS Bridges with Posting Issues | # of Other NHS Bridges with Posting Issues | |
| 1 | Concrete Slab | 18 | 40 | 3-S2 | 11.1% | 5.0% | 566 | 245 |
| 18 | 40 | Scenario #1 | 11.1% | 7.5% | 566 | 368 | ||
| 18 | 40 | Scenario #2 | 11.1% | 15.0% | 566 | 735 | ||
| 18 | 40 | Scenario #3 | 11.1% | 20.0% | 566 | 981 | ||
| 18 | 40 | 2-S1-2 | 0.0% | 0.0% | 0 | 0 | ||
| 18 | 40 | Scenario #4 | 11.1% | 2.5% | 566 | 123 | ||
| 18 | 40 | Scenario #5 | 0.0% | 0.0% | 0 | 0 | ||
| 18 | 40 | Scenario #6 | 11.1% | 5.0% | 566 | 245 | ||
| 2 | Concrete Girder / Simple span | 30 | 39 | 3-S2 | 3.3% | 0.0% | 310 | 0 |
| 30 | 39 | Scenario #1 | 3.3% | 0.0% | 310 | 0 | ||
| 30 | 39 | Scenario #2 | 3.3% | 0.0% | 310 | 0 | ||
| 30 | 39 | Scenario #3 | 6.7% | 0.0% | 629 | 0 | ||
| 30 | 39 | 2-S1-2 | 3.3% | 0.0% | 310 | 0 | ||
| 30 | 39 | Scenario #4 | 3.3% | 0.0% | 310 | 0 | ||
| 30 | 39 | Scenario #5 | 3.3% | 0.0% | 310 | 0 | ||
| 30 | 39 | Scenario #6 | 6.7% | 0.0% | 629 | 0 | ||
| 3 | Concrete Girder / Cont. spans | 16 | 32 | 3-S2 | 6.3% | 0.0% | 134 | 0 |
| 16 | 32 | Scenario #1 | 6.3% | 0.0% | 134 | 0 | ||
| 16 | 32 | Scenario #2 | 6.3% | 3.1% | 134 | 118 | ||
| 16 | 32 | Scenario #3 | 6.3% | 3.1% | 134 | 118 | ||
| 16 | 32 | 2-S1-2 | 6.3% | 0.0% | 134 | 0 | ||
| 16 | 32 | Scenario #4 | 6.3% | 3.1% | 134 | 118 | ||
| 16 | 32 | Scenario #5 | 6.3% | 3.1% | 134 | 118 | ||
| 16 | 32 | Scenario #6 | 12.5% | 3.1% | 266 | 118 | ||
| 4 | Steel Girder / Simple span, L < 100 |
14 | 38 | 3-S2 | 0.0% | 5.3% | 0 | 275 |
| 14 | 38 | Scenario #1 | 0.0% | 5.3% | 0 | 275 | ||
| 14 | 38 | Scenario #2 | 0.0% | 10.5% | 0 | 545 | ||
| 14 | 38 | Scenario #3 | 0.0% | 10.5% | 0 | 545 | ||
| 14 | 38 | 2-S1-2 | 0.0% | 0.0% | 0 | 0 | ||
| 14 | 38 | Scenario #4 | 0.0% | 5.3% | 0 | 275 | ||
| 14 | 38 | Scenario #5 | 0.0% | 0.0% | 0 | 0 | ||
| 14 | 38 | Scenario #6 | 0.0% | 5.3% | 0 | 275 | ||
| 5 | Steel Girder / Simple span, L > 100 | 19 | 17 | 3-S2 | 5.3% | 5.9% | 151 | 117 |
| 19 | 17 | Scenario #1 | 5.3% | 5.9% | 151 | 117 | ||
| 19 | 17 | Scenario #2 | 5.3% | 5.9% | 151 | 117 | ||
| 19 | 17 | Scenario #3 | 5.3% | 5.9% | 151 | 117 | ||
| 19 | 17 | 2-S1-2 | 0.0% | 5.9% | 0 | 117 | ||
| 19 | 17 | Scenario #4 | 0.0% | 5.9% | 0 | 117 | ||
| 19 | 17 | Scenario #5 | 5.3% | 5.9% | 151 | 117 | ||
| 19 | 17 | Scenario #6 | 10.5% | 11.8% | 299 | 234 | ||
| 6 | Steel Girder / Cont. spans, L < 100 | 21 | 28 | 3-S2 | 0.0% | 0.0% | 0 | 0 |
| 21 | 28 | Scenario #1 | 0.0% | 0.0% | 0 | 0 | ||
| 21 | 28 | Scenario #2 | 0.0% | 0.0% | 0 | 0 | ||
| 21 | 28 | Scenario #3 | 0.0% | 3.6% | 0 | 142 | ||
| 21 | 28 | 2-S1-2 | 0.0% | 0.0% | 0 | 0 | ||
| 21 | 28 | Scenario #4 | 0.0% | 0.0% | 0 | 0 | ||
| 21 | 28 | Scenario #5 | 0.0% | 0.0% | 0 | 0 | ||
| 21 | 28 | Scenario #6 | 0.0% | 3.6% | 0 | 142 | ||
| 7 | Steel Girder / Cont. spans, L > 100 | 11 | 33 | 3-S2 | 0.0% | 0.0% | 0 | 0 |
| 11 | 33 | Scenario #1 | 0.0% | 0.0% | 0 | 0 | ||
| 11 | 33 | Scenario #2 | 0.0% | 0.0% | 0 | 0 | ||
| 11 | 33 | Scenario #3 | 0.0% | 0.0% | 0 | 0 | ||
| 11 | 33 | 2-S1-2 | 0.0% | 0.0% | 0 | 0 | ||
| 11 | 33 | Scenario #4 | 0.0% | 0.0% | 0 | 0 | ||
| 11 | 33 | Scenario #5 | 0.0% | 0.0% | 0 | 0 | ||
| 11 | 33 | Scenario #6 | 9.1% | 0.0% | 387 | 0 | ||
| 8 | Steel Girder / Floorbeam * | 2 | 9 | 3-S2 | 0.0% | 0.0% | 0 | 0 |
| 2 | 9 | Scenario #1 | 0.0% | 0.0% | 0 | 0 | ||
| 2 | 9 | Scenario #2 | 0.0% | 0.0% | 0 | 0 | ||
| 2 | 9 | Scenario #3 | 0.0% | 0.0% | 0 | 0 | ||
| 2 | 9 | 2-S1-2 | 0.0% | 0.0% | 0 | 0 | ||
| 2 | 9 | Scenario #4 | 0.0% | 0.0% | 0 | 0 | ||
| 2 | 9 | Scenario #5 | 0.0% | 0.0% | 0 | 0 | ||
| 2 | 9 | Scenario #6 | 0.0% | 0.0% | 0 | 0 | ||
| 9 | Conc. Tee beams | 11 | 42 | 3-S2 | 0.0% | 14.3% | 0 | 500 |
| 11 | 42 | Scenario #1 | 0.0% | 26.2% | 0 | 917 | ||
| 11 | 42 | Scenario #2 | 0.0% | 33.3% | 0 | 1165 | ||
| 11 | 42 | Scenario #3 | 9.1% | 38.1% | 240 | 1333 | ||
| 11 | 42 | 2-S1-2 | 0.0% | 0.0% | 0 | 0 | ||
| 11 | 42 | Scenario #4 | 0.0% | 11.9% | 0 | 416 | ||
| 11 | 42 | Scenario #5 | 0.0% | 2.4% | 0 | 84 | ||
| 11 | 42 | Scenario #6 | 9.1% | 26.2% | 240 | 917 | ||
| 10 | Conc. Box beams | 10 | 44 | 3-S2 | 0.0% | 0.0% | 0 | 0 |
| 10 | 44 | Scenario #1 | 0.0% | 0.0% | 0 | 0 | ||
| 10 | 44 | Scenario #2 | 0.0% | 0.0% | 0 | 0 | ||
| 10 | 44 | Scenario #3 | 0.0% | 2.3% | 0 | 117 | ||
| 10 | 44 | 2-S1-2 | 0.0% | 0.0% | 0 | 0 | ||
| 10 | 44 | Scenario #4 | 0.0% | 0.0% | 0 | 0 | ||
| 10 | 44 | Scenario #5 | 0.0% | 0.0% | 0 | 0 | ||
| 10 | 44 | Scenario #6 | 0.0% | 0.0% | 0 | 0 | ||
| 11 | Steel Through Truss* | 1 | 15 | 3-S2 | 0.0% | 0.0% | 0 | 0 |
| 1 | 15 | Scenario #1 | 0.0% | 0.0% | 0 | 0 | ||
| 1 | 15 | Scenario #2 | 0.0% | 0.0% | 0 | 0 | ||
| 1 | 15 | Scenario #3 | 0.0% | 0.0% | 0 | 0 | ||
| 1 | 15 | 2-S1-2 | 0.0% | 0.0% | 0 | 0 | ||
| 1 | 15 | Scenario #4 | 0.0% | 0.0% | 0 | 0 | ||
| 1 | 15 | Scenario #5 | 0.0% | 0.0% | 0 | 0 | ||
| 1 | 15 | Scenario #6 | 0.0% | 0.0% | 0 | 0 | ||
| TOTAL | 153 | 337 | 3-S2 | 3.3% | 3.3% | 1485 | 1419 | |
| 153 | 337 | Scenario #1 | 3.3% | 5.0% | 1485 | 2194 | ||
| 153 | 337 | Scenario #2 | 3.3% | 7.7% | 1485 | 3360 | ||
| 153 | 337 | Scenario #3 | 4.6% | 9.5% | 2080 | 4135 | ||
| 153 | 337 | 2-S1-2 | 1.3% | 0.3% | 595 | 131 | ||
| 153 | 337 | Scenario #4 | 2.6% | 3.0% | 1185 | 1293 | ||
| 153 | 337 | Scenario #5 | 2.0% | 0.9% | 890 | 387 | ||
| 153 | 337 | Scenario #6 | 6.5% | 5.6% | 2970 | 2455 | ||
*: Girder-Floorbeam systems and through trusses were rated using the Load Factor Rating (LFR) methodology. All other bridge types were rated using the Load and Resistance Factor Rating (LRFR) methodology.
previous