Evaluation of Travel Time Methods to Support Mobility Performance Monitoring:
World Trade Bridge (Page 3 of 5)
Data Collection Details
Historical data was evaluated for an assessment of the variability in travel conditions at the Laredo border crossing. The goal of this analysis process was to obtain statistically useful data with as few data collection days as possible. In order to customize the data collection activities to Laredo, the following steps were conducted:
- Define significant "seasonal" variations,
- Define significantly different days of the week,
- Identify traffic streams that experience significantly different conditions, and
- Estimate the number of days needed for the data collection survey.
Both the Mexican and U.S. Customs official provided some data on past traffic flows at the border. Unfortunately, to date, the data collected has been inconsistent. There were sufficient data to permit some analysis and conclusions upon which data collection decisions were based. Daily truck data from the U.S. Customs and the City of Laredo were provided for first ten months of 2001. Table 6 shows that there is no clear seasonal fluctuation in traffic volumes. As shown in the table, there is not much variation is the commercial traffic by month for the data presented. However, December for which data were not available from U.S. Customs, likely exhibits a lower volume due to the holiday season. Due to project constraints, data collection needed to occur between late October and early November 2001.
The greatest fluctuations occur during the week. Sunday has the lowest volume of truck flows and represents about ten percent of the average weekday volumes. Saturday volumes are next lowest and represent about one third of the average weekday volumes. Consequently, Tuesday, Wednesday and Thursday were selected as data collection days because they represent typical weekday truck volumes. There were no 2001 data available for selecting sampling hours for the data collection at the border. Interviews with U.S. Customs and Laredo Bridge personnel and traffic counts taken by the Texas Transportation Institute (TTI) on August 15th and 16th 2000, indicated that traffic volumes during the day are somewhat different for each direction. For the outbound direction, traffic volumes build slowly after the 8:00 AM bridge opening increase until about 2:00 PM and peak about 6:00 PM before gradually declining until about 7:00 PM and then sharply declining afterwards. In the inbound direction, volumes rise rapidly in the morning, remain high until about 6:00 PM when numbers of trucks crossing into the U.S. falls off sharply. The goal of this analysis process is to obtain statistically useful data with as few data collection days as possible. As indicated above, a decision was made to collect only three days of data from Tuesday through Thursday and that this would provide an adequate number of data samples to represent “typical” conditions. Due to availability of daylight, data collection began early in the morning and continued until lighting conditions rendered data collection impossible.
| Month | Inbound Trucks | Outbound Trucks |
|---|---|---|
| January | 84,762 | 90,190 |
| February | 79,617 | 88,224 |
| March | 92,601 | 94,287 |
| April | 82,581 | 79,228 |
| May | 93,987 | 85,584 |
| June | 87,098 | 94,435 |
| July | 89,808 | 97,971 |
| August | 98,965 | 103,404 |
| September | 87,970 | 89,710 |
| October | 101,514 | 103,928 |
Source: U.S. Customs
Because the study team anticipated that travel times could differ for loaded and unloaded trucks, data for loaded and unloaded trucks was examined for the month of October. Table 7 shows that, at least for inbound traffic from Mexico into the United States, slightly less that half of the trucks are carrying loads.
| Oct-2001 | Loads | Empties | Tractors | Total |
|---|---|---|---|---|
| Mon 1 | 1,539 | 1,080 | 1,084 | 3,703 |
| Tue 2 | 2,364 | 1,095 | 1,433 | 4,892 |
| Wed 3 | 2,314 | 861 | 1,138 | 4,313 |
| Thu 4 | 2,151 | 951 | 1,225 | 4,327 |
| Fri 5 | 1,897 | 1,137 | 1,416 | 4,450 |
| Sat 6 | 654 | 179 | 538 | 1,371 |
| Sun 7 | 129 | 100 | 94 | 323 |
| Mon 8 | 1,899 | 909 | 1,188 | 3,996 |
| Tue 9 | 2,071 | 821 | 1,074 | 3,966 |
| Wed 10 | 2,082 | 980 | 1,185 | 4,247 |
| Thu 11 | 1,987 | 889 | 1,190 | 4,066 |
| Fri 12 | 1,973 | 942 | 1,297 | 4,212 |
| Sat 13 | 656 | 188 | 451 | 1,295 |
| Sun 14 | 163 | 68 | 109 | 340 |
| Mon 15 | 1,641 | 836 | 1,488 | 3,965 |
| Tue 16 | 2,003 | 979 | 1,194 | 4,176 |
| Wed 17 | 1,882 | 971 | 1,290 | 4,143 |
| Thu 18 | 1,785 | 893 | 1,145 | 3,823 |
| Fri 19 | 1,902 | 946 | 1,044 | 3,892 |
| Sat 20 | 715 | 269 | 686 | 1,670 |
| Sun 21 | 176 | 54 | 89 | 319 |
| Mon 22 | 1,857 | 1,157 | 1,230 | 4,244 |
| Tue 23 | 2,031 | 1,042 | 1,341 | 4,414 |
| Wed 24 | 2,107 | 892 | 1,115 | 4,114 |
| Thu 25 | 2,013 | 1,078 | 1,176 | 4,267 |
| Fri 26 | 1,717 | 656 | 822 | 3,195 |
| Sat 27 | 757 | 396 | 433 | 1,586 |
| Sun 28 | 135 | 68 | 84 | 287 |
| Mon 29 | 1,681 | 1,198 | 1,172 | 4,051 |
| Tue 30 | 1,994 | 797 | 960 | 3,751 |
| Wed 31 | 2,006 | 937 | 1,173 | 4,116 |
| Total | 48,281 | 23,369 | 29,864 | 101,514 |
Data Collection Procedures
The data collection stations selected for the crossing were chosen because of the particular actions that occur at each site. Segments defined by the data collection stations were used to determine the commercial vehicle travel times and freight delay. As illustrated in Figures 2 through 9, the data collection sites were located at:
- An advance station located upstream of the commercial vehicle queue – IB-1 and OB-1.
- The import station (primary inspection booths before detailed, or secondary, inspection) – IB-2 and OB-2.
Data collection was conducted by recording commercial vehicle license plates as vehicles crossed fixed points within the data collection sites. Survey individuals or teams, were placed at each of the four data collection sites to record commercial vehicle license plate data.
Collectors at these locations would record the last five characters of the front, lower-right license plate of as many trucks as possible that passed their location. When trucking firms register many vehicles at once, they often get assigned sequential license plate numbers. Using the last five characters helps to ensure that as different trucks operated by the same firm travel across the bridge that they are uniquely identified. License plate information was entered into handheld computers with a special application designed for this project. Each entry was time-stamped with the current date and time. Prior to each day’s collection, all handheld computers were synchronized to the same time. Prior experience indicated that recording the entire license plate was too time consuming and that entering only the last four characters did not provide adequate distinction between different vehicles, so the project team chose to record the last five characters. Typically, the queue of trucks crossing the border in outbound direction (towards Mexico) did not extend beyond OB-1 as shown in Figure 3. However, when the queue would extend northward the data collector at the OB-1 location would have to move to the OB-1A to a point that was beyond the end of the queue. In this way, the collector could continue to record trucks before they began their wait at the end of the line. When this or any other event of interest occurred, the collectors would use an "EVENT" feature of the PDA software to record it. A similar process was followed for the data collector at the inbound location (IB-1). Where the queue of trucks backed up from the export booths, the data collector would move south along the divided access road and resume data collection at a point about 1.5 kilometers (.9 miles) south of the Mexican export booths. The access road is shown in Figure 8. As was the case for the data collector on the U.S. side of the border, when any event of interest occurred, the collector would use the "EVENT" feature to record it.
The data collection team used cell phones and hand-held 2-way radios to communicate. This was particularly important when the queues lengthened such that a collector had to move farther upstream. The supervisors could be kept informed without repeated trips to each data collection location. This was also useful at the end of the day when the #1 collectors would inform the #2 collectors of the last truck they recorded, so the #2 collectors would know when to stop.
Data Collection Sample Size
Sample sizes are typically not a concern with videotape or handheld data entry devices, because the data collection includes a large number of vehicles. However, minimum sample sizes should be verified with variability values from field data. Early research found that sample sizes from 25 to 100 license matches were necessary for a given roadway segment and time period (Turner, et. al.). In most cases, there were sufficient records to meet this requirement.
Data Collection Equipment
As outlined in the "Data Collection Procedures" section above, Handspring Visor PDAs were used as the data entry device and proved adequate to the task. Low-end models with 2MB of storage capacity were selected as the application and data size were projected to be well below this limit. The Handspring Visors use the Palm OS (operating system) and have faster processing speeds (at least in side-by-side comparison with this application) and larger screen sizes than comparable models from Palm Computing.
A custom application was developed for the Palm OS which allowed the data collectors to identify their locations (e.g., IB-1, OB-2), the number of open booths (primarily used for the Customs inspection booths), special events or other comments, and license plate information. A screen shot of the application interface is shown in Figure 10.
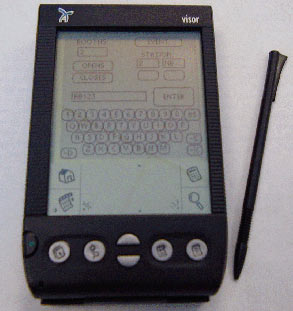
Figure 10. Data Collection Device and Software Application
The data were downloaded via a serial cable directly from the application into a text file on the field laptop computer, which was a Dell Latitude CPx H running with a 500 MHz Pentium III processor.
Data Collection Summary
Table 8 shows the number of commercial vehicle license plates recorded for each of the stations on each of the data collection days. On October 30, 2001, data was lost at the IB-1 data collection point due to a PDA malfunction. Table 9 shows the matches for each direction for the data collection days. Table 10 shows the average daily traffic volume as recorded by the U.S. Customs (inbound direction) and the city of Laredo (outbound direction). Hourly volumes are used in the calculation of delay; those are shown with the delay calculations in Tables 11 through 16.
| Station | 10/30/2001 | 10/31/2001 | 11/01/2001 | Data Collection Period |
|---|---|---|---|---|
| IB-1 | NA | 1,354 | 1,570 | 2,924 |
| IB-2 | 1,078 | 1,197 | 1,617 | 3,892 |
| OB-1 | 1,091 | 1,374 | 1,352 | 3,817 |
| OB-2 | 1,442 | 1,825 | 1,746 | 5,013 |
| Grand Total | 15,646 |
| Station | 10/30/01 | 10/31/01 | 11/1/01 |
|---|---|---|---|
| IB | NA | 532 | 820 |
| OB | 512 | 620 | 519 |
| Total | 512 | 1,152 | 1,339 |
| Direction | 10/30/01 | 10/31/01 | 11/1/01 |
|---|---|---|---|
| Inbound | 3,751 | 4,116 | 4,012 |
| Outbound | 4,293 | 4,429 | 4,312 |
| Total | 8,044 | 8,545 | 8,324 |