Freight Facts and Figures 2013
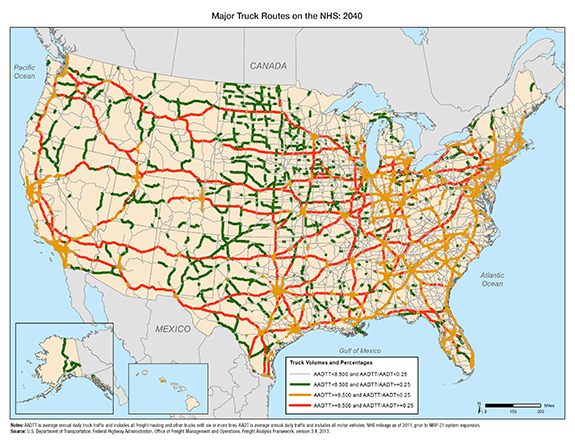
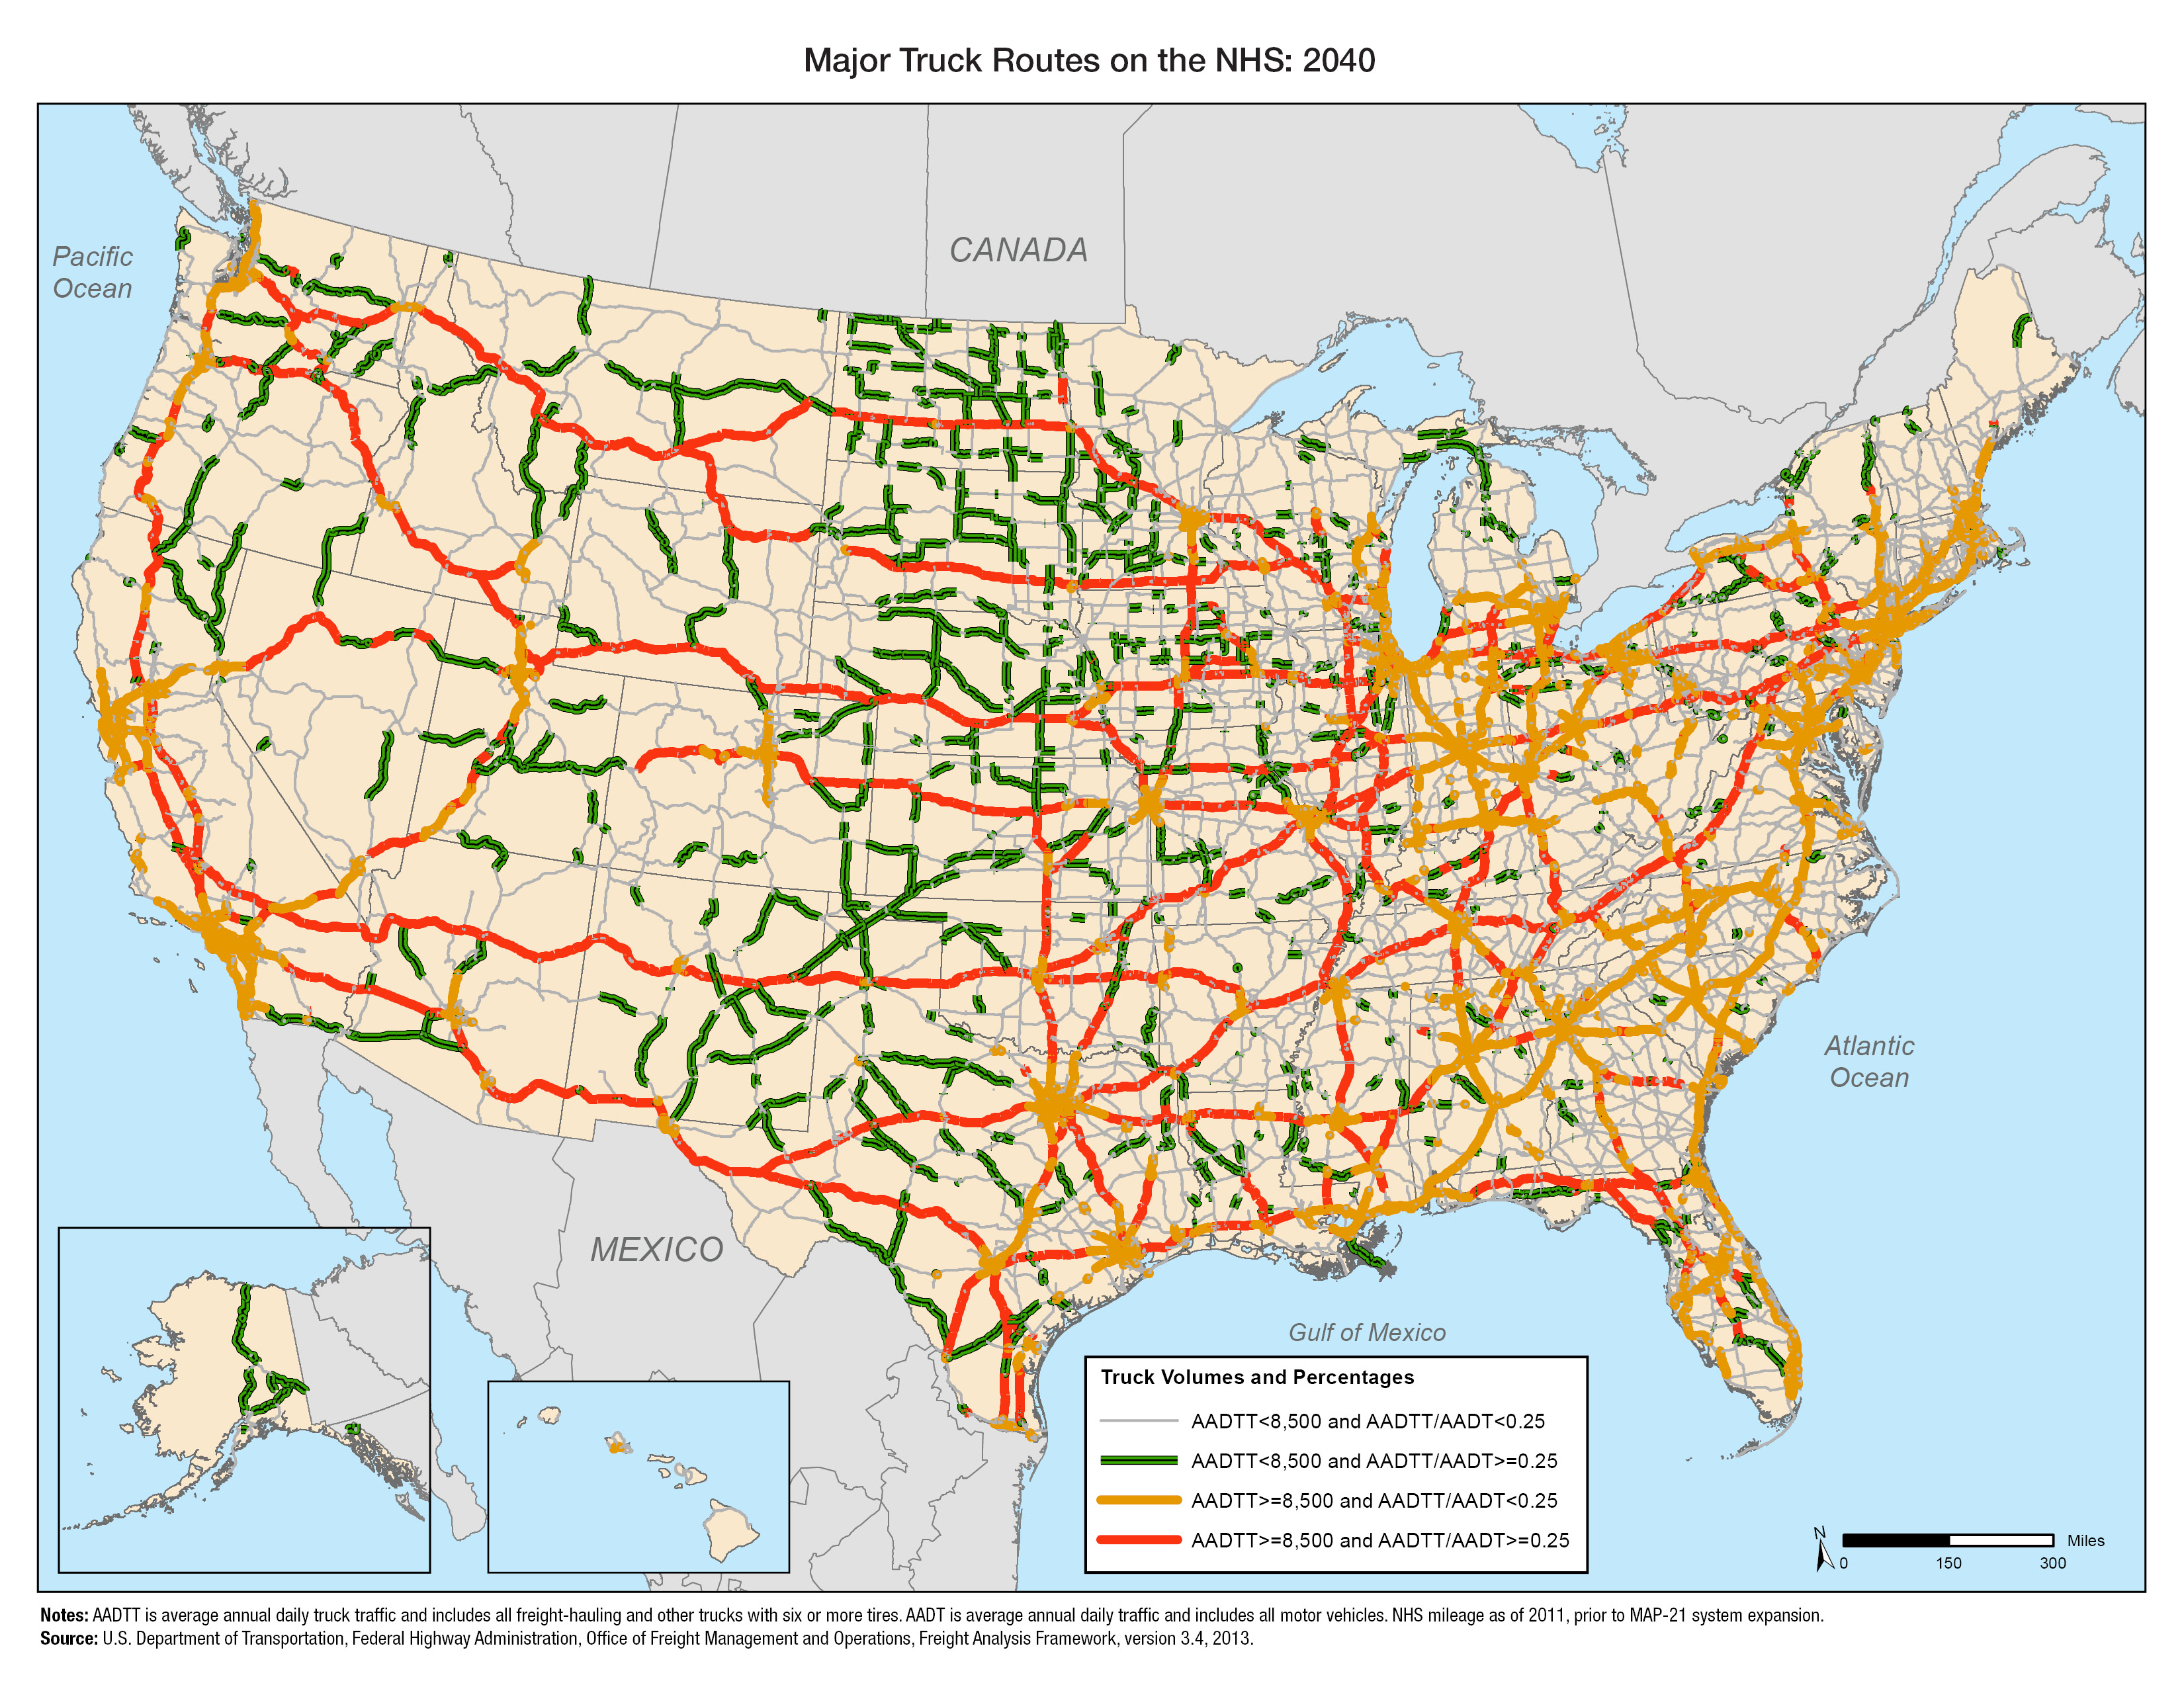
Figure 3-15. Major Truck Routes on the National Highway System: 2040
The number of NHS miles carrying large volumes and high percentages of trucks is forecast to increase dramatically by 2040. Segments with more than 8,500 trucks per day and where at least every fourth vehicle is a truck are forecast to reach 42,000 miles, an increase of more than 175 percent from 2011
Figure 3-15
Notes:
AADTT is average annual daily truck traffic and includes all freight-hauling and other trucks with six or more tires. AADT is average annual daily traffic and includes all motor vehicles. NHS mileage as of 2011, prior to MAP-21 system expansion.
Source:
U.S. Department of Transportation, Federal Highway Administration, Office of Freight Management and Operations, Freight Analysis Framework, version 3.4, 2013.
You may need the Adobe® Reader® to view the PDFs on this page.