| Skip
to content |
|
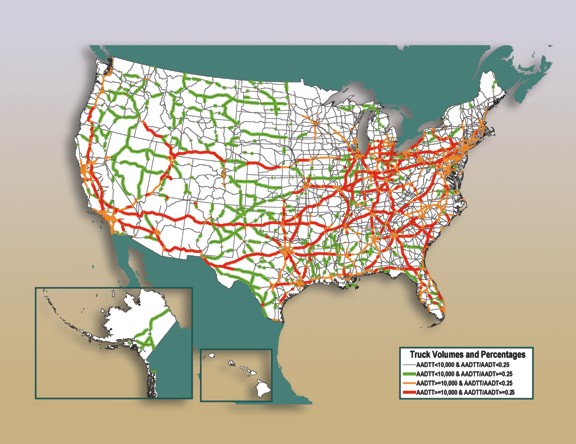
Freight Facts and Figures 2009Figure 3-8. Major Truck Routes on the National Highway System: 2035The number of NHS miles carrying large volumes and high percentages of trucks is forecast to increase dramatically by 2035. Segments with more than 10,000 trucks per day and where at least every fourth vehicle is a truck are forecast to exceed 14,000 miles, an increase of almost 230 percent from 2002.
Note: AADTT is average annual daily truck traffic, and includes freight-hauling long-distance trucks, freight-hauling local trucks, and other trucks with six or more tires. AADT is average annual daily traffic, and includes all motor vehicles. Source: U.S. Department of Transportation, Federal Highway Administration, Office of Freight Management and Operations, Freight Analysis Framework, version 2.2, 2007.
|
|
United States Department of Transportation - Federal Highway Administration |
||