| Skip
to content |
|
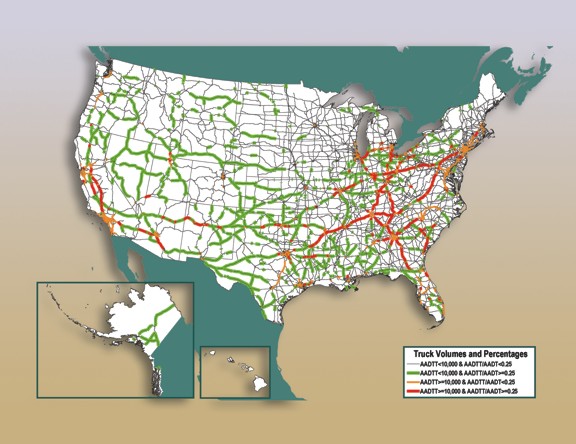
Freight Facts and Figures 2009Figure 3-7. Major Truck Routes on the National Highway System: 2002Selected routes carry a significant concentration of trucks, either as an absolute number or as a percentage of the traffic stream. More than 4,000 miles of the NHS carry more than 10,000 trucks per day on sections where at least every fourth vehicle is a truck.
Note: AADTT is average annual daily truck traffic, and includes freight-hauling long-distance trucks, freight-hauling local trucks, and other trucks with six or more tires. AADT is average annual daily traffic, and includes all motor vehicles. Source: U.S. Department of Transportation, Federal Highway Administration, Office of Freight Management and Operations, Freight Analysis Framework, version 2.2, 2007.
|
|
United States Department of Transportation - Federal Highway Administration |
||