| Skip
to content |
|
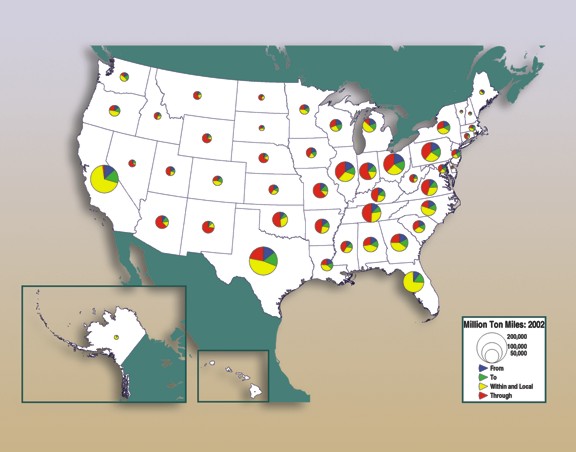
Freight Facts and Figures 2009Figure 3-16. Ton Miles of Truck Shipments by State: 2002Trucks moved 2.1 trillion ton miles of commodities in 2002, one-third of which was for portions of commodity flows passing through states, one-third split roughly evenly between portions of long-distance flows entering and leaving states, and one-third for intrastate and local flows. Long-distance interstate commerce accounts for a majority of ton miles in all but five states, and through movements account for a majority of ton miles in 17 states.
Notes: Ton miles include domestic flows by truck, domestic portions of international trade by truck to and from maritime ports, and domestic portions of international flows by truck to and from Canada and Mexico. See Table 3-10 for values and Technical Notes for method of calculation. Sources: Ton miles between places over 50 miles apart: U.S. Department of Transportation, Federal Highway Administration, Office of Freight Management and Operations, Freight Analysis Framework, version 2.3, August 2009. Ton miles between places less than 50 miles apart (Local): Ibid., and U.S. Department of Transportation, Research and Innovative Technology Administration, Bureau of Transportation Statistics and U.S. Department of Commerce, Census Bureau, 2002 Commodity Flow Survey, July 2009.
|
|
United States Department of Transportation - Federal Highway Administration |
||