Freight Facts and Figures 2009
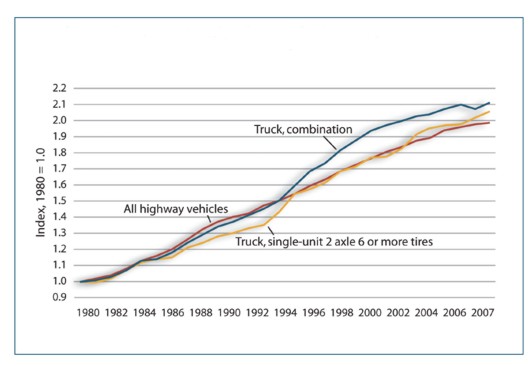
Figure 3-1. Highway Vehicle Miles Traveled by Trucks and All Vehicles: 1980-2007
The growing demand for goods and services contributes to the increase in travel by trucks at a slightly faster rate than for all vehicles.
[PDF 48KB]
Data represented in the figure.
Table in Excel format
Index: 1980 = 1.0
| 1980 |
1981 |
1982 |
1983 |
1984 |
1985 |
1986 |
1987 |
1988 |
1989 |
1990 |
1991 |
1992 |
1993 |
1994 |
1995 |
1996 |
1997 |
1998 |
1999 |
2000 |
2001 |
2002 |
2003 |
2004 |
2005 |
2006 |
2007 |
| Highway, total |
1,527,295 |
1,555,308 |
1,595,010 |
1,652,788 |
1,720,269 |
1,774,826 |
1,834,872 |
1,921,204 |
2,025,962 |
2,096,487 |
2,144,362 |
2,172,050 |
2,247,151 |
2,296,378 |
2,357,588 |
2,422,696 |
2,485,848 |
2,561,695 |
2,631,522 |
2,691,056 |
2,746,925 |
2,797,287 |
2,855,508 |
2,890,450 |
2,964,788 |
2,989,430 |
(R) 3,014,371 |
3,029,822 |
| Truck, single-unit 2-axle 6 or more tires |
39,813 |
39,568 |
40,658 |
42,546 |
44,419 |
45,441 |
45,637 |
48,022 |
49,434 |
50,870 |
51,901 |
52,898 |
53,874 |
56,772 |
61,284 |
62,705 |
64,072 |
66,893 |
68,021 |
70,304 |
70,500 |
72,448 |
75,866 |
77,757 |
78,441 |
78,496 |
(R) 80,344 |
81,954 |
| Truck, combination |
68,678 |
69,134 |
70,765 |
73,586 |
77,377 |
78,063 |
81,038 |
85,495 |
88,551 |
91,879 |
94,341 |
96,645 |
99,510 |
103,116 |
108,932 |
115,451 |
118,899 |
124,584 |
128,359 |
132,384 |
135,020 |
136,584 |
138,737 |
140,160 |
142,370 |
144,028 |
(R) 142,169 |
145,008 |
| Highway, total |
1.00 |
1.02 |
1.04 |
1.08 |
1.13 |
1.16 |
1.20 |
1.26 |
1.33 |
1.37 |
1.40 |
1.42 |
1.47 |
1.50 |
1.54 |
1.59 |
1.63 |
1.68 |
1.72 |
1.76 |
1.80 |
1.83 |
1.87 |
1.89 |
1.94 |
1.96 |
(R) 1.97 |
1.98 |
| Truck, single-unit 2-axle 6 or more tires |
1.00 |
0.99 |
1.02 |
1.07 |
1.12 |
1.14 |
1.15 |
1.21 |
1.24 |
1.28 |
1.30 |
1.33 |
1.35 |
1.43 |
1.54 |
1.57 |
1.61 |
1.68 |
1.71 |
1.77 |
1.77 |
1.82 |
1.91 |
1.95 |
1.97 |
1.97 |
(R) 2.02 |
2.06 |
| Truck, combination |
1.00 |
1.01 |
1.03 |
1.07 |
1.13 |
1.14 |
1.18 |
1.24 |
1.29 |
1.34 |
1.37 |
1.41 |
1.45 |
1.50 |
1.59 |
1.68 |
1.73 |
1.81 |
1.87 |
1.93 |
1.97 |
1.99 |
2.02 |
2.04 |
2.07 |
2.10 |
(R) 2.07 |
2.11 |
To view Excel files, you can use the Microsoft
Excel Viewer.
 You will need the Adobe
Acrobat Reader to view the PDFs on this page. You will need the Adobe
Acrobat Reader to view the PDFs on this page.
previous | table of contents | next
|