Freight Facts and Figures 2008
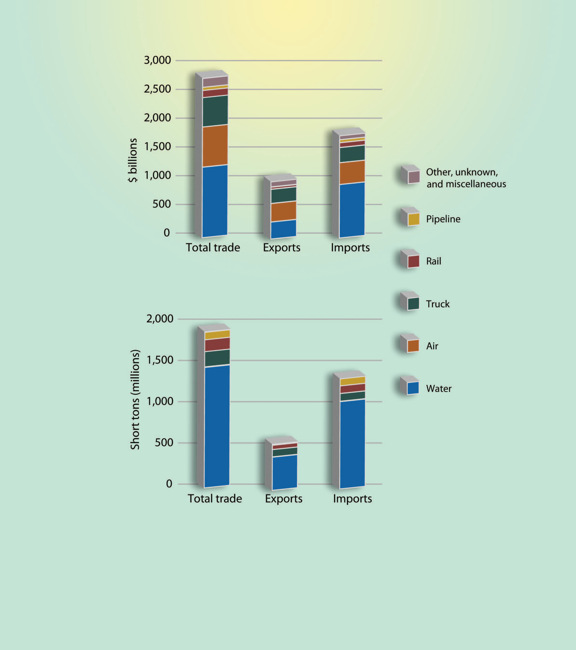
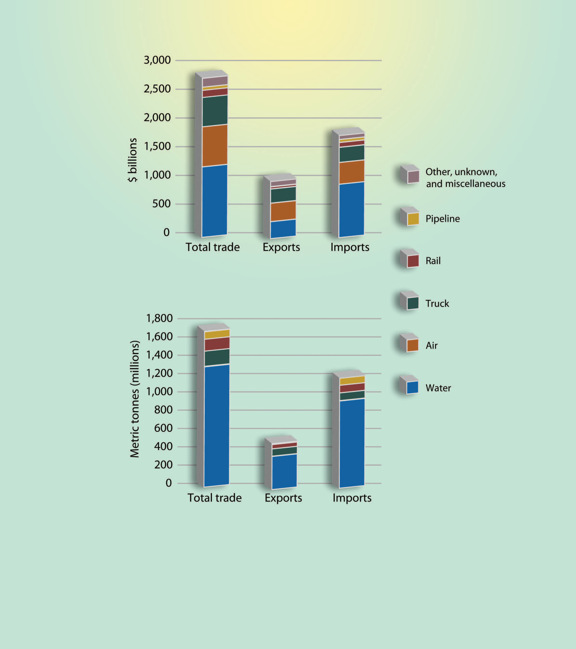
Figures 2-2 and 2-2M. U.S. International Merchandise Trade by Transportation Mode: 2006
Nearly 80 percent of freight tons in U.S. foreign trade are transported by ship. Although the vast majority of freight tonnage in U.S. foreign trade moves by water, air and truck transportation are nearly as important when freight value is considered. By value, the water share drops to 44 percent, with air and truck accounting for 25 percent and 18 percent respectively. Rail and pipeline account for the balance.
Figure 2-2 (standard units)
[PDF 317KB]
Data represented in the figure.
| Mode | Total trade Billions of current U.S. dollars |
Exports Billions of current U.S. dollars |
Imports Billions of current U.S. dollars |
|---|---|---|---|
| Water | 1,279 | 308 | 971 |
| Air | 731 | 337 | 394 |
| Truck | 534 | 257 | 276 |
| Rail | 129 | 40 | 89 |
| Pipeline | 57 | 3 | 54 |
| Other, unknown, and miscellaneous | 162 | 92 | 70 |
| Total, all modes | 2,892 | 1,037 | 1,855 |
| Mode | Total trade Millions of short tons |
Exports Millions of short tons |
Imports Millions of short tons |
|---|---|---|---|
| Water | 1,523 | 420 | 1,103 |
| Air | 8 | 3 | 4 |
| Truck | 192 | 91 | 100 |
| Rail | 150 | 55 | 95 |
| Pipeline | 95 | 5 | 89 |
| Other, unknown, and miscellaneous | 5 | 4 | 1 |
| Total, all modes | 1,973 | 580 | 1,393 |
Notes:
1 short ton = 2,000 pounds. The U.S. Department of Transportation, Research and Innovative Technology Administration, Bureau of Transportation Statistics estimated 2006 data using value-to-weight ratios derived from imported commodities. The U.S. Census Bureau no longer requires these data to be reported. Totals for the most recent year differ slightly from the Freight Analysis Framework due to variations in base year and coverage of methods for calculating values in constant dollars.
Sources:
Compiled by U.S. Department of Transportation (USDOT), Research and Innovative Technology Administration (RITA), Bureau of Transportation Statistics (BTS), October 2007.
Total, water and air data: U.S. Department of Commerce, Census Bureau, Foreign Trade Division, FT920 U.S. Merchandise Trade: Selected Highlights, December 2006.
Truck, rail, pipeline data: USDOT, RITA, BTS, TransBorder Freight Data 2006.
Other, unknown and miscellaneous data: USDOT, RITA, BTS, special tabulation, October 2007.
Figure 2-2M (metric units)
[PDF 331KB]
Data represented in the figure.
| Mode | Total trade Billions of current U.S. dollars |
Exports Billions of current U.S. dollars |
Imports Billions of current U.S. dollars |
|---|---|---|---|
| Water | 1,279 | 308 | 971 |
| Air | 731 | 337 | 394 |
| Truck | 534 | 257 | 276 |
| Rail | 129 | 40 | 89 |
| Pipeline | 57 | 3 | 54 |
| Other, unknown, and miscellaneous | 162 | 92 | 70 |
| Total, all modes | 2,892 | 1,037 | 1,855 |
| Mode | Total trade Millions of metric tonnes |
Exports Millions of metric tonnes |
Imports Millions of metric tonnes |
|---|---|---|---|
| Water | 1,386 | 382 | 1,004 |
| Air | 7 | 3 | 4 |
| Truck | 174 | 83 | 91 |
| Rail | 137 | 50 | 87 |
| Pipeline | 86 | 5 | 81 |
| Other, unknown, and miscellaneous | 5 | 4 | 1 |
| Total, all modes | 1,795 | 528 | 1,267 |
Notes:
1 short ton = 0.91 metric tonne. The U.S. Department of Transportation, Research and Innovative Technology Administration, Bureau of Transportation Statistics estimated 2006 data using value-to-weight ratios derived from imported commodities. The U.S. Census Bureau no longer requires these data to be reported. Totals for the most recent year differ slightly from the Freight Analysis Framework due to variations in base year and coverage of methods for calculating values in constant dollars.
Sources:
Compiled by U.S. Department of Transportation (USDOT), Research and Innovative Technology Administration (RITA), Bureau of Transportation Statistics (BTS), October 2007.
Total, water and air data: U.S. Department of Commerce, Census Bureau, Foreign Trade Division, FT920 U.S. Merchandise Trade: Selected Highlights, December 2006.
Truck, rail, pipeline data: USDOT, RITA, BTS, TransBorder Freight Data 2006.
Other, unknown and miscellaneous data: USDOT, RITA, BTS, special tabulation, October 2007.
To view Excel files, you can use the Microsoft Excel Viewer.
![]() You will need the Adobe
Acrobat Reader to view the PDFs on this page.
You will need the Adobe
Acrobat Reader to view the PDFs on this page.