Appendix A. More on Consumers' Surplus
In competitive markets, the intersection of the supply and demand curves for some commodity—say gizmos—determines both its market price and the quantity that is transferred from seller to buyer during some time period. A gizmo's price is the additional or marginal cost to some firm in producing what is, in a sense, the last gizmo manufactured today. The price is simultaneously the value its buyer attaches to today's last gizmo. If its price were just a tiny bit higher, this last buyer would not have taken today's last gizmo. Similarly, if its price were just a tiny bit lower, its producer would not have manufactured today's last gizmo. Put differently, the market price of today's last gizmo is the price at which its producer would be indifferent between manufacturing and not manufacturing it and, simultaneously, its buyer would be indifferent between buying and not buying it.
As commonly drawn, supply and demand curves respectively slope upward and downward from left to right. If this characteristic applies in the gizmo market, then, apart from the last gizmo, each of today's gizmos is valued by its buyer at more than its price and costs its seller less than its price. The difference between what a buyer would just be willing to pay for a gizmo and its actual price is commonly termed a "consumers' (or consumers or consumer's) surplus." Similarly, the difference between the market price of a gizmo and its marginal cost to a seller is commonly termed a "producers' (or producer or producer's) surplus." Economists commonly view the sum of the consumer and producer surpluses from, for example, today's gizmo sales as an important measure of the gizmo market's contribution to social welfare.
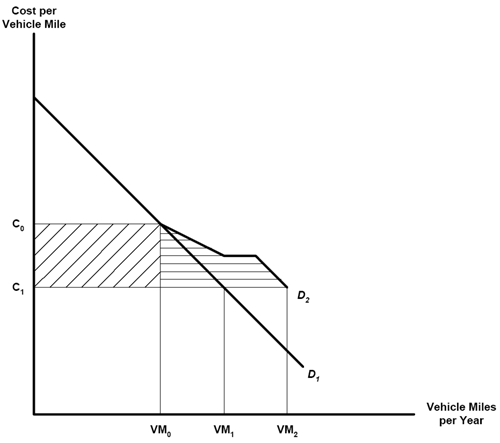
The vertically shaded area to the left of demand curve D1 in Exhibit 4 is the increase in surplus associated with first-order benefits—the cost reductions to shippers and carriers including those to shippers that result from reduced average travel times and the reduced variability of the difference between actual and average travel times. The horizontally shaded area to the left of demand curve D2 and above the price at which D2 and the new supply curve intersect is consumer-surplus benefits. They are associated with the logistic reorganization that curve D2 summarizes. The part of this area to the left of demand curve D1 is benefits associated with the pre-improvement level of transportation services. The triangular area to the left of D1 is benefits associated with the increased transportation intensity to which the improvement gives rise.

Exhibit 4: Consumer Surplus for Transportation