Evaluation of Travel Time Methods to Support Mobility Performance Monitoring:
Blaine (Pacific Highway) (Page 2 of 3)
Data Collection Details
Both the Canadian and U.S. Customs official provided some data on past traffic flows at the border. Unfortunately, to date, the data collected has been fragmentary. However, the data that was available was used to select the sampling hours for the data collection at the border. The goal of this analysis process was to obtain statistically useful data with as few data collection days as possible. In order to customize the data collection activities at the Blaine Border Crossing, the following steps were conducted:
- Define significant "seasonal" variations,
- Define significantly different days of the week,
- Identify traffic streams that experience significantly different conditions, and
- Estimate the number of days needed for the data collection survey.
As shown in Figure 7, there is some variation is the commercial traffic by month. Due to project constraints, data collection needed to occur between late May and early September 2001. From Figure 7, the two months with the greatest average volumes during this data collection window were May and July.
Figure 7. Blaine Trucks, Monthly Average
Table 3 shows that at least for inbound traffic from Canada into the United States , there is a significant difference in commercial traffic between weekdays and weekends. Weekend traffic is about 51 percent of typical weekday traffic. However there is not a significant difference between Monday and Friday and the three mid-week days although traffic on Mondays and Fridays is about 97% of the traffic on Tuesday through Thursday. Nevertheless, a decision was made to collect only three days of data from Tuesday through Thursday and that this would provide an adequate number of data samples to represent "typical" conditions.
| Day | Day of Week | Inbound |
|---|---|---|
| 1 | Tuesday | 1,818 |
| 2 | Wednesday | 1,640 |
| 3 | Thursday | 1,579 |
| 4 | Friday | 1,556 |
| 5 | Saturday | 893 |
| 6 | Sunday | 827 |
| 7 | Monday | 1,576 |
| 8 | Tuesday | 1,698 |
| 9 | Wednesday | 1,613 |
| 10 | Thursday | 1,591 |
| 11 | Friday | 1,503 |
| 12 | Saturday | 807 |
| 13 | Sunday | 669 |
| 14 | Monday | 1,575 |
| 15 | Tuesday | 1,670 |
| 16 | Wednesday | 1,846 |
| 17 | Thursday | 1,704 |
| 18 | Friday | 1,439 |
| 19 | Saturday | 988 |
| 20 | Sunday | 853 |
| 21 | Monday | 1,053 |
| 22 | Tuesday | 1,837 |
| 23 | Wednesday | 1,862 |
| 24 | Thursday | 1,863 |
| 25 | Friday | 1,557 |
| 26 | Saturday | 787 |
| 27 | Sunday | 765 |
| 28 | Monday | 1,350 |
| 29 | Tuesday | 1,725 |
| 30 | Wednesday | 1,713 |
| 31 | Thursday | 1,687 |
Source: U.S. Customs, Blaine Crossing
Data Collection Procedures
The data collection stations selected for the crossing were chosen because of the particular actions that occur at each site. Segments defined by the data collection stations were used to determine the commercial vehicle travel times and freight delay. As illustrated in Figures 2 through 9, the data collection sites were located at:
- An advance station located upstream of the commercial vehicle queue – IB-1 and OB-1.
- The import station (primary inspection booths before detailed, or secondary, inspection) – IB-2 and OB-2.
Data collection was conducted by recording commercial vehicle license plates as vehicles crossed fixed points within the data collection sites. Survey individuals or teams, were placed at each of the four data collection sites to record commercial vehicle license plate data.
Collectors at these locations would record the last five characters of the front, lower-left license plate of as many trucks as possible that passed their location. When trucking firms register many vehicles at once, they often get assigned sequential license plate numbers. Using the last five characters helps to ensure that as different trucks operated by the same firm travel across the bridge that they are uniquely identified. License plate information was entered into handheld computers with a special application designed for this project. Each entry was time-stamped with the current date and time. Prior to each day's collection, all handheld computers were synchronized to the same time. Prior experience indicated that recording the entire license plate was too time consuming and that entering only the last four characters did not provide adequate distinction between different vehicles, so the project team chose to record the last five characters.
Typically, the queue of trucks crossing the border outbound would not extend beyond OB-1B as shown in Figure 3. However, when the queue would extend southward towards I-5 the data collector at the #1 location would have to move to a point on the entrance ramp to the interstate that was beyond the end of the queue. In this way, they could continue to record trucks before they began their wait at the end of the line. When this or any other event of interest occurred, the collectors would use an "EVENT" feature of the PDA software to record it.
For each #1 location, the supervisor would record the distance from any data collection point other than the original position that would be OB-1A. During post-processing, the data from the locations nearer to the border than the farthest location would be adjusted to include the additional travel time from the farthest location to the original location. The travel time would be computed at free-flow speeds, since there would have been no queue at the times that the data were collected at these closer locations. In this way, the data all would appear to be collected from the same location, the one most distant from the primary Customs Canadian booth.
The data collection team used cell phones to communicate. This was particularly important when the queues lengthened such that a collector had to move farther upstream. The supervisor could be kept informed without repeated trips to each data collection location. This was also useful at the end of the day when the #1 collectors would inform the #2 collectors of the last truck they recorded, so the #2 collectors would know when to stop. Although cell tower location limitations created some problems with reception, each collector was usually able to use their cell phone to reach other team members.
Data Collection Sample Size
Sample sizes are typically not a concern with videotape or handheld data entry devices, because the data collection includes a large number of vehicles. However, minimum sample sizes should be verified with variability values from field data. Early research found that sample sizes from 25 to 100 license matches were necessary for a given roadway segment and time period (Turner, et. al.). In most cases, there were sufficient records to meet this requirement.
Data Collection Equipment
As outlined in the "Data Collection Procedures" section above, Handspring Visor PDAs were used as the data entry device and proved adequate to the task. Low-end models with 2MB of storage capacity were selected as the application and data size were projected to be well below this limit. The Handspring Visors use the Palm OS (operating system) and have faster processing speeds (at least in side-by-side comparison with this application) and larger screen sizes than comparable models from Palm Computing.
A custom application was developed for the Palm OS which allowed the data collectors to identify their locations (e.g., OB-1, IB-2), the number of open booths (primarily used for the Customs inspection booths), special events or other comments, and license plate information. A screen shot of the application interface is shown in Figure 8.
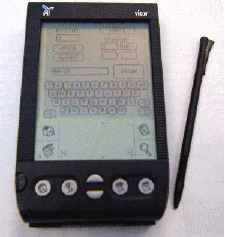
Figure 8. Data Collection Device and Software Application
The data were downloaded via a serial cable directly from the application into a text file on the field laptop computer, which was a Dell Latitude CPx H running with a 500 MHz Pentium III processor.
Data Collection Summary
Table 4 shows the number of commercial vehicle license plates recorded for each of the stations on each of the data collection days. Table 5 shows the matches for each direction for the data collection days. Matches from the northernmost U.S. Primary booth were eliminated because the trucks passing through this booth had a greater chance of stopping at the duty free shop after they were recorded at IB-1. Table 6 shows the average daily traffic volume as recorded by the U.S. Customs (inbound direction) and the Canadian Customs (outbound direction). Hourly volumes are used in the calculation of delay and are shown with the delay calculations in Tables 7 through 12.
| Station | 7/10/01 | 7/11/01 | 7/12/01 |
|---|---|---|---|
| OB-1 | 700 | 878 | 828 |
| OB-2 | 737 | 926 | 850 |
| IB-1 | 610 | 709 | 789 |
| IB-2 | 870 | 985 | 830 |
| Total | 2,917 | 3,498 | 3,297 |
| Station | 7/10/01 | 7/11/01 | 7/12/01 |
|---|---|---|---|
| OB | 547 | 641 | 647 |
| IB | 266 | 291 | 320 |
| Total | 813 | 932 | 967 |
| Direction | 7/10/01 | 7/11/01 | 7/12/01 |
|---|---|---|---|
| Outbound* | 1,137 | 1,317 | 1,179 |
| Inbound | 1,943 | 1,746 | 1,848 |
| Total | 3,080 | 3,063 | 3,027 |
*Note: Underreporting is inherent in this data because no data was collected for the early morning hours before 6:00 AM and after 11:00 PM
Data Quality Steps
At the end of each day of data collection, the supervisor would collect the PDAs and download the data into the field laptop computer where it was stored on the hard drive. The data would be examined for any anomalies and transferred across the Internet to a secondary location for backup purposes. The OB-1 and OB-2 data would be merged together and license plates from the two locations would be "matched" using a spreadsheet developed in Microsoft Excel. As it is easy to mistake certain characters, particularly letters that looked like numbers, the license plate data was pre-processed. All 'I's were replaced with '1's; all 'O's, 'D's, and 'Q's were replaced with '0's; all 'S's were replaced with '5's; and all 'Z's were replaced with '2's. In addition, the data collectors were instructed to always use '1's for 'I's and '0's for 'O's (i.e., to use the digit, rather than the letter).
Occasionally, collectors would be unsure about a license plate and would append "QQQ" to their entry. This would typically occur when several trucks passed the collector in rapid succession or if one truck blocked the license plate of another and he or she could only manage a quick glimpse. This would allow the supervisor to search the downloaded data for a potential match by using the travel times of other trucks that were recorded in the same general time frame. During this process, the supervisor could also identify the few records in which the data collector forgot to press "ENTER" after recording a license plate before recording the next one. These ten-character entries could be split into two and the time for the first interpolated from the adjacent entries if they were less than a minute or so apart.
Data post-processing also included a step to identify any anomalies in the data, including outliers. Outliers, records that indicated travel times significantly greater than typical for that time period, were most often caused by recording the license plate of a vehicle only some of the time as it made repeated trips across the border during a single day. This is because the matching algorithm uses the most recent time at the #1 position when matching to a record from a #2 location. For example, if the vehicle was recorded as it headed from Canada to the U.S. early in the morning, later returned to Canada, was missed as it re-entered the U.S. later in the day, and then recorded on its subsequent return to Canada, the #1 time from its first trip would be matched with it #1 time from the first trip (for a valid travel time) an also matched to the #2 time from its second trip (an invalid travel time). This invalid travel time would be easily identified by manual inspection of the data, aided by highlighting those travel times above a specific, but variable, threshold.
previous | next