
Freeway Management and Operations Handbook
Chapter 8 – Managed Lanes
Page 2 of 2
8.2.6 Technologies
The following technologies can be applied to managed lanes:
- Static signing and striping.
- Dynamic message signs
- Variable speed limit signs
- Speed warning systems
- Lane-use control signals
- Moveable barriers
- Channelizing devices.
- Electronic toll collection
The generic relationship between these technologies and lane use management strategies is shown in Table 8-6.


Decision makers must assess the candidate technologies to determine which are most appropriate to achieve the desired strategies. The assessment should consider both the spatial and temporal operational characteristics of the freeway. For example, spatial considerations address technology adequacy from the aspect of roadway design and construction and may require the decision maker to answer such questions as:
- Is the pavement on the shoulder adequate to support heavy-vehicle travel?
- How will restricting large trucks to a specific lane or lanes affect vehicle merging or diverging maneuvers at entrance and exit ramp locations?
Temporal considerations also prove important in assessing technologies. For example, before considering truck lane restrictions on a freeway, a decision maker may consider whether truck-automobile conflicts and crashes are a problem at all times of the day or only during certain periods. Likewise, decisions regarding when and how many lanes will be closed to accomplish a given work activity are a major part of the work zone planning process. For instance, it may be possible to close more travel lanes at night to do the work, but this requires channelizing devices and other traffic control devices that provide higher levels of retro-reflectivity (increasing planning and traffic control costs). Other considerations include cost, time to implement, political feasibility, and estimates of benefits.
To aid in this assessment the remainder of this section describes each of the identified technologies and provides examples of deployment.
8.2.6.1 Static Signing and Striping
As discussed in Chapter 6, static signing and striping provide the required guidance and warning to ensure the safe and orderly movement of traffic. Signs can implement managed lanes by restricting certain vehicles from using a particular lane. Examples include:
- Restricting trucks to the right most lane(s) or from using a facility at specific times of day.
- Establishing lane(s) for high-occupancy vehicle use only.
Static signing and striping are also used for warning purposes in advance of construction and maintenance work zones to inform motorists that one or more travel lanes are closed downstream. These generally supplement the channelizing devices placed at the point of closure that require drivers to vacate the lane at that point (channelizing devices are discussed later in this section).
Standards on static signing and striping are covered in the Manual on Uniform Traffic Control Devices (2). Some states also publish their own manuals that should be followed when specifying lane management signing.
8.2.6.2 Changeable Message Signs
Changeable message signs can advise motorists of freeway conditions so that they can take appropriate action to improve the efficiency and safety of travel. Chapter 13 (Information Dissemination) provides a detailed discussion of dynamic message sign technologies. For managed lane applications, the more limited capability variable speed limit signs, speed warning systems and lane control signals (LCS) can also convey lane use and lane status information to drivers.
8.2.6.3 Variable Speed Limit Signs
Using variable speed limits as a strategy is discussed in section 8.2.5.7. The technologies that apply to VSL signs span those that are generally used for dynamic message signs. They can range from limited message signs capable of displaying numerals only to infinitely variable message signs with full message capability but used for displaying variable speed limits. See Chapter 13 for a description of changeable message sign capabilities.
8.2.6.4 Speed Warning Systems
Speed warning systems sense the speed of a passing vehicle and activate a dynamic message sign informing the driver of his or her current speed. These systems find application at the approaches to work zones, at high accident locations where speed is a contributing factor, and at other locations experiencing excessive speeds for prevailing conditions. Typically, a radar senses a vehicle's speed and activates a DMS with a message such as:
"YOU ARE SPEEDING AT [xx] M.P.H. 45 M.P.H. CURVE AHEAD."
In a deployment in Colorado (See Figure 8-12), the maximum design speed for a curve was 43 mi/h due to limited sight distance. The 85th percentile of truck speed was 66 mi/h before installation and 48 mi/h after. However, studies conducted under the Midwest States Smart Work Zone Deployment initiative indicate that no significant difference was observed in the number of vehicles observing the speed limit (24). Other studies have indicated that dynamic speed displays can be effectively combined with a static speed limit sign posted above the display for comparison.
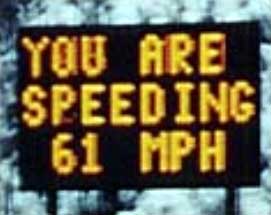
Figure 8-12: Speed Warning Sign
8.2.6.5 Lane-Use Control Signals
Lane-use Control Signals (LCS) are fixed-grid CMS (refer to Chapter 13) that use both color and symbols to convey information. The Manual on Uniform Traffic Control Devices (MUTCD) defines LCS as special overhead signals that permit or prohibit the use of specific lanes of a street or highway or that indicate the impending prohibition of their use. LCSs are most commonly used for reversible-lane control, but are also used in non-reversible freeway lane applications. Examples include (25, 26, 27):
- Toll booths,
- HOV lanes,
- Reversible transitways on freeways,
- Arena traffic, and
- Parking control.
Other applications include:
- Restricting traffic from certain lanes at certain hours to facilitate merging traffic from a ramp or other freeway,
- Controlling lane use for tunnels and bridges,
- On a freeway, near its terminus, to indicate a lane that ends, and
- On a freeway or long bridge, to indicate that a lane may be temporarily blocked by a crash, breakdown, construction or maintenance activities.
In addition, at least one operating agency uses LCS to indicate to motorists that a shoulder can be used as a travel lane during peak travel periods. Interstate 66 in Virginia uses the left most lane as an HOV lane during the peak periods; therefore, the shoulder lane is used during this period to allow the same number of lanes for use by non-HOV traffic. Lane-use control signals are used to indicate when the shoulder lane can be used. Figure 8-13 shows a European freeway LCS.
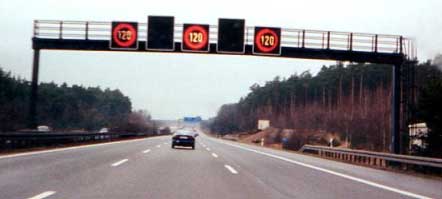
Figure 8-13: LCS (Germany)
The MUTCD (2) provides information on the design, location and operation of lane-use control signals. The MUTCD describes the signal displays and defines the meaning of the displays.
The most common types of LCS are fixed-grid fiberoptic, and fixed-grid LED light emitting. Regardless of the technology used, LCSs cannot force vehicles to vacate a lane or use a shoulder as a travel lane. They do provide guidance about lane status, and are intended to promote safer operations by warning motorists upstream of an actual lane blockage.
A panel of eight TxDOT managers and engineers with expertise in Lane Control Signal (LCS) design and operation for freeways discussed problems and potential solutions regarding LCS. Their recommendations included the following:
- Visibility
- Drivethroughs should be performed to determine if the red X is display has sufficient legibility distance.
- If choosing double-stroked symbols for LCS displays, a maximum pixel spacing and/or effective stroke-width-to-letter-height should also be specified.
- A regular cleaning and bulk replacement schedule should be implemented.
- Back plates or back panels should be considered for placement behind LCS on overhead sign structures.
- Spacing and Mounting Locations
- LCS should be placed every 0.8 to 1.6 km (0.5 to 1.0 mi), but special geometric characteristics and driver decision points should also be considered during this placement.
- Mounting LCS on a cross-street bridge structure rather than on an overhead sign structure is desired.
- Positive guidance principles should be employed when determining the placement of the LCS.
8.2.6.6 Moveable Barriers
Moveable Barrier Technology (MBT) provides the opportunity to change the direction of a freeway lane while providing continuous positive protection between opposing flows of traffic. The technology can also provide continuous protection between a work zone that changes in width and length and adjacent traffic lanes. MBT can accomplish these changes quickly, making it possible to respond to changes in traffic volumes that occur within a day. Therefore, MBT provides a strategy to change the capacity of a freeway in the peak direction quickly and easily, with a resulting reduction in congestion (15).
A moveable barrier (Figure 8-14) is comprised of a series of interconnected sections of barrier elements (zipper) hinged together to form a continuous chain. The cross section is similar to other portable barriers, but with a "T"-shaped top. Each section is about 1 meter in length and weighs approximately 3300 kg. Sections of barrier can easily be locked together or unlocked by inserting or withdrawing a steel pin through the hinge components attached to either end of the barrier.
Figure 8-14: Moveable Barrier Technology D
A specially designed conveyor system on a self-propelled barrier transfer machine (BTM) is used to shift the barrier laterally across the roadway. The distance of the shift can be varied from 4 to 24 feet. Conveyor wheels on the BTM engage the T-shaped top of the barrier. The barrier can then be lifted several inches off the ground, moved sidewinder fashion through an elongated "S" curve, and accurately repositioned to form a new lane line. Barriers can be moved at a speed of more than five miles per hour.
Many reversible lane applications employ moveable barriers over the distance of one to several miles to control traffic and minimize head-on collisions. Moveable barriers also tend to keep the reversible lane speeds at free flow conditions, thus providing lane users with time savings. Figure 8-15 shows the repositioning of a typical moveable barrier.
Figure 8-15: Moveable Barrier Being Repositioned
(Photo by Advantage Technologies for the Massachusetts Highway Department)
8.2.6.7 Channelizing Devices for Work Zones
Static signs are used for directing traffic in advance of and within a work zone. CMSs (See Chapter 13) and arrow panels supplement channelizing devices and provide additional target value and suitable messages that attract motorists' attention as they approach a work zone. Highway Advisory Radio (HAR) (See Chapter 13) can provide additional information, including route detours. Newspaper articles, traffic broadcasts, fax, e-mail and the Internet can alert motorists to general construction and maintenance work zone locations, but provide limited detailed information about specific lane closures and traffic delays.
Within the work zone itself, traffic must be channeled from the lane(s) being closed to the designated pathway. A number of different types of channelizing devices can be used, depending on the duration of the closure and traffic speeds. These devices include:
- Cones.
- Tubular markers.
- Vertical panels.
- Drums.
- Barricades.
Regardless of the device used, it is critical that proper spacing and length of taper be employed to safely transition motorists from the closed lane(s) to open lane(s).
Portable barriers may be used to separate traffic from the work area and to protect construction workers. Special signing and temporary delineation and / or route detours may be needed when these barriers are moved and traffic is shifted.
There is a wide variety of channelizing devices currently available for use in highway work zones. The MUTCD (2) presents basic design standards for these devices and general guidelines for their use; however, it is the highway agency's choice where and when to use particular devices or sets of devices. Typically, work zone channelizing devices are chosen on the basis of one of the following practices:
- Select the device with the lowest initial cost.
- Select the device normally used by the agency.
- Select a device already in stock.
- Select the "very best" device just in case.
Each of these approaches has drawbacks, and collectively they have resulted in inflated job costs, unnecessarily large inventories, lack of uniformity, and in some cases improper device use. As an alternative to the typical methods used for selecting channelizing devices for work zones, the value engineering approach can be used. The approach involves 7 steps:
- Determine the intended purpose of the devices.
- Identify available alternative devices.
- Select appropriate measures of device performance.
- Determine the performance of the alternative devices on the basis of selected performance measures.
- Estimate the total cost of each acceptable alternative.
- Calculate the relative value of each acceptable alternative, where value equals performance divided by cost.
- Select the alternative with the greatest value.
The following recommendations should be followed when using this approach:
- Base value engineering study on comprehensive and accurate information.
- Use a team approach – team members are well-trained and diverse in experience and technical background.
- Consider value engineering approach most appropriate for central office use – through pooling central office staff and data-gathering resources.
The responsible highway agency will make the final choice of the channelizing devices used in the work zone. However, using the approach suggested the agency should be able to balance the needs of the work zone with the agency budget.
8.2.6.8 Electronic Toll Collection
Electronic Toll Collection (ETC) adds a new control element to the set of lane management strategies that are useful for moving traffic through toll facilities. At major toll facilities where ETC has been introduced, motorists usually benefit from a significant reduction in vehicle travel time and shorter queues. In Reference 28, a dedicated cash lane had an average transaction time of 10.5 seconds for a passenger car and 29.5 seconds for a commercial vehicle. A dedicated ETC lane processed 1000 vph, with an average transaction time of 3.6 seconds per vehicle. The typical savings is 6.9 seconds per passenger car. The greater time savings, however, is realized with the elimination of queues due to the reduction of transaction time. In the study, queues of over 20 vehicles, which took up to three minutes to process had been observed at some toll plazas prior to ETC. With the introduction of ETC, there are virtually no queues at interchanges and barriers where there once was often heavy congestion.
The basic components that make the system work are (See Figure 8-16):
- Transponders on the vehicles.
- Tag reader antennas at each plaza toll lane.
- Lane controllers that control the lane equipment and track vehicles passing through.
- Host computer system – all of the toll plaza controllers are connected
to a central database.
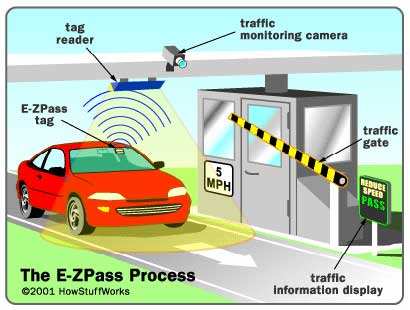
Figure 8-16: The E-ZPass Process at a Toll Booth
Drivers usually pay a deposit to obtain a transponder, which is about the size of a deck of cards. This device is placed on the inside of the car's windshield behind the rearview mirror. A transponder is a battery-operated radio frequency identification (RFID) unit that transmits radio signals. The transponder is a two-way radio with a microprocessor, operating in the 900-MHz band. Stored in this RFID transponder is some basic account information, such as an identification number.
Antennas, or electronic readers, are positioned above each toll lane. These antennas emit radio frequencies that communicate with the transponder. The detection zone of an antenna is typically 6 to 10 feet (2 to 3 m) wide and about 10 feet long. These two devices, the transponder and the antenna, interact to complete the toll transaction.
Some electronic toll-collection systems may also include a light curtain and treadles. A light curtain is just a beam of light that is directed across the lane. When that beam of light is broken, the system knows a car has entered. Treadles are sensor strips embedded in the road that detect the number of axles a vehicle has. A three-axle vehicle is charged a higher toll than a two-axle vehicle. These two devices are safeguards to ensure that all vehicles are counted correctly.
The system works as follows:
- As a car approaches a toll plaza, the radio-frequency (RF) field emitted from the antenna activates the transponder.
- The transponder broadcasts a signal back to the lane antenna with some basic information.
- That information is transferred from the lane antenna to the central database.
- If the account is in good standing, a toll is deducted from the driver's prepaid account.
- If the toll lane has a gate, the gate opens.
- A green light indicates that the driver can proceed. Some lanes have text messages that inform drivers of the toll just paid and their account balance.
The entire process takes a matter of seconds to complete. The electronic system records each toll transaction, including the time, date, plaza and toll charge of each vehicle. Typically, motorists maintain prepaid accounts. A yellow light or some other signal will flash to indicate if an account is low or depleted.
At the toll plaza, ETC introduces three types of toll lanes. These are Cash Only, ETC Only and Mixed Cash / ETC. Two key questions for plaza operations must be addressed by all ETC equipped toll facilities. The first is: how many of each type of toll lane be provided as a function of arriving traffic volume and percentage of vehicles equipped with tags? The second issue is: how should each type of toll lane be distributed across the toll plaza?
The rules regarding how fast a motorist can pass through the toll plazas vary from system to system. Agencies with traditional lane based toll plazas impose speed restrictions that slow vehicles to 5 mph (8 kph) as they pass through the toll lane. These lanes are monitored using video cameras. If a vehicle goes through the plaza without a transponder, a camera takes a snapshot of the license plate, records it and sends a violation notice to the owner. Some toll agencies are adopting a high-speed approach that utilizes an "open" toll plaza without lane restrictions, booths, or barriers, thereby allowing motorists to pass through the system at highway speeds.
8.2.7 Design and Related Considerations
The preliminary design process for a managed lane subsystem includes matching objectives with lane management strategies. The relationship of typical objectives to lane management strategies is shown in Table 8-7. Each of the cells identified by a check can be a candidate strategy to fulfill that objective. Note that objectives will most likely differ between areas.
The next step is to eliminate those strategies that do not achieve, in whole or in part, the specific project objectives. For example, if the sole objective of the project is to improve vehicle throughput, the cells containing strategies that are not candidates for this objective are shown crossed out in Table 8-8. The surviving strategies are shown in bold type on that table.

The functional requirements of a managed lane component define specific strategies needed to achieve one or more of the stated objectives for that component. In theory, the strategies should be defined independent of the technology used to implement them. However, some managed lane objectives may be so narrowly defined and governed by standards or policies (e.g. temporary freeway lane closures for maintenance) that this step, in and of itself, defines the technology to be used (6). For other objectives, though, the technology required may not be so obvious, and so a definition of functional requirements would be warranted. Possible functional requirements of a managed lanes subsystem to increase peak period freeway capacity include:
- Automatically determine when freeway lane volumes reach 90 percent of estimated capacity.
- Ensure that no stalled vehicles are located on the shoulder in the affected section of freeway.
- Notify motorists at the beginning of the affected section that freeway shoulder can be used as a travel lane.
- Notify motorists at the end of the affected section that they should return to the normal freeway travel lanes.
- Terminate motorist notification of permissible freeway shoulder usage at the end of the peak period.
The functional relationships, data requirements, and information flows show how the managed lane functions will be integrated with each other and with the other freeway management system components (such as surveillance or motorist information dissemination). When defining the functional relationships, data requirements, and information flows as they impact dynamic signs and surveillance, the National Transportation Communications Interface Protocol (NTCIP) and the National ITS Architecture should be followed (4). This approach provides the following advantages:
- It allows components from different vendors to be used interchangeably, increasing competition and reducing costs.
- It eases future upgrades or expansions of the components. The necessary interfaces to other components of the freeway management system (i.e., surveillance) have already been established.
For other managed lane functions, informal functional relationships, data requirements, and information flows may be acceptable, but should be prepared nonetheless. For example, the functional relationships, data requirements, and information flows for managing a temporary total freeway closure over the weekend might include how real-time data concerning traffic conditions, project status, and / or the effects of weather are transferred among the transportation agencies (such as the traffic, maintenance, and public information divisions), enforcement agencies, the media, and the private contractor.
Enforcement should be a key element of all managed lanes plans. Plans should address both the management and coordination requirements among the various partners, relative to enforcement. Operational issues such as staff requirements and citation locations also need to be addressed during plan development.
8.2.8 Emerging Trends
The broad concept of managed lanes is, in many respects, an emerging trend. Specific applications in this regard are summarized below.
8.2.8.1 Separated lanes / roadways / guideways
It is anticipated that the separation of commercial and non-commercial traffic will become increasingly important (e.g. approximately 120 miles of truck bypass lanes are being planned in Southern California). On a much more distant horizon, the Netherlands has advanced a Combi-Road Driverless Truck Guideway concept in which unmanned trucks carrying sea containers drive on dedicated tracks with active longitudinal guidance from seaports to inland terminals (29). Figure 8-17 illustrates a prototype of this system.
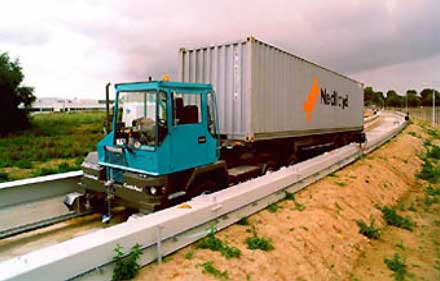
Figure 8-17: Combi-Road Driverless Truck Guideway
8.2.8.2 Automated Speed Enforcement
Automated speed enforcement (ASE) has been used as a speed control and enforcement tool by over 40 countries around the world, with some systems having been in place for up to 30 years (30). Studies (31) indicate that the technology is effective in reducing speeds and accidents. In 1998, it was used in four states: Arizona, California, Colorado, and Oregon.
A 1992 study on the Capital Beltway in the Washington D.C. area (32), demonstrated that it is operationally feasible to use photo-radar technology to detect and photograph speed violators on high-speed, high-volume roads. Photo-radar technology can produce clear photographs that can be used to prosecute speeding drivers in court. The equipment proved capable of detecting and properly photographing a much higher percentage of speed violators than can the average police officer in a patrol car. The study also concluded that it is feasible to propose legislation for the use of photo-radar technology that could safeguard individual rights, meet constitutional requirements, and enforce speed limits.
Although automated speed enforcement is currently not well accepted by the U.S. public, the technology would seem particularly relevant to work zone traffic control (21) and high accident locations where excessive speed is determined to be a contributing factor.
8.2.8.3 Smart Work Zones
Smart Work Zones refer to the application of intelligent transportation systems within work zones to improve safety and reduce congestion at work zone locations. These systems can be used to warn drivers of downstream congestion, alert drivers of slower speeds ahead, and suggest alternate routes based on prevailing conditions (24, 33, 34, 38).
The Smart Work Zone usually integrates changeable message signs, speed sensors, video cameras, and highway advisory radio (HAR) through a computerized control system that automatically determines appropriate responses to current traffic conditions. These systems can be deployed to provide traveler information in work zones where permanent traffic management systems do not exist. Some systems can operate with little or no day-to-day human intervention (33).
There are four principal components of the Smart Work Zone:
- Speed detectors and / or surveillance equipment
- Central control system
- Information dissemination devices
- Communications systems
Speed sensors and / or surveillance equipment are located within the work zone to determine the traffic conditions within the work zone. Traffic data is transmitted to a portable, central control system located at the work site or a traffic management center where the incoming data is processed. The traffic data is analyzed to determine if a speed advisory, delay advisory, or route diversion message should be displayed. If the data indicates that some type of message should be displayed, the central control system transmits a signal to CMSs, HAR, and / or other device in order to alert drivers to conditions in the work zone (33). The traffic data gathered can also be displayed graphically on the Internet or transmitted via an automated fax or e-mail.
In addition to the mobility, safety, and cost savings benefits experienced by the deployment of a Smart Work Zone, research has indicated that agencies deploying Smart Work Zones have developed improved relationships with the public and other agencies (34). At some sites, the improved relationship with the public was documented through numerous positive letters and e-mails, and through survey responses.
8.2.8.4 Vehicle-Highway Automation
The implementation of vehicle-highway automation in the 21st century will provide an enhanced level of surface transportation accessibility and mobility (35). A first-generation of vehicle-highway automation is coming into focus, in which automated vehicles operate on today's roads with no extensive infrastructure modifications required. Early co-pilot systems would evolve to auto-pilots gradually. These vehicles would operate at spacing a bit tighter than commuter flows of today, with traffic flow benefits achieved through vehicle-cooperative systems as well as vehicle-infrastructure cooperation.
The vehicles may cluster in designated lanes, which are also open to normal vehicles, or may be allowed on high-occupancy vehicle (HOV) lanes to increase their proximity to one another and therefore get the benefits of cooperative operations (access to HOV lanes also creates a powerful incentive for consumers to invest in these systems). Stabilization of traffic flow and modest increases in capacity are seen as the key outcomes.
Once this level of functionality is proven and in broad use, a second generation scenario comes into play, which expands, to dedicated lanes, presumably desired by a user population with a high percentage of automation-capable vehicles. With growing use, networks of automated vehicle lanes would develop, offering the high levels of per-lane capacity achievable through close-headway operations.
An important force in the development of vehicle-highway automation is a federal pooled-fund program, Cooperative Vehicle-Highway Automation Systems (CVHAS). The program uses pooled resources from public and private sector partners to research, develop, evaluate and deploy CVHAS solutions to improve transportation mobility, safety, air quality, and energy reduction. CVHAS seeks to facilitate the sharing of technological and institutional experiences gained from its projects and the projects of its individual members.
CVHAS defines vehicle-highway automation systems as systems that provide driving control assistance or fully automated driving, based on information about the vehicle's driving environment that can be received by communication from other vehicles or from the infrastructure, as well as from its own on-board sensors. These systems could have implementations for special classes of vehicles (transit buses or heavy trucks, for example) prior to the broader implementation for the general population of light-duty passenger vehicles.
8.2.8.5 Congestion Pricing
In its 1995 two-volume report, Curbing Gridlock: Peak-Period Fees to Relieve Traffic Congestion, (36) the National Academy of Sciences praises congestion pricing as a potentially powerful tool to persuade people to carpool, use transit, telecommute, vary the times they travel, alter their routes, choose other destinations, or avoid or combine some trips. Experience in other countries, such as England, France, and Singapore, demonstrates that congestion pricing does significantly reduce gridlock during peak traffic periods.
In a separate California study funded by the Federal Highway Administration, (37) researchers found that congestion pricing and other market-based transportation pricing measures offer great potential for reducing congestion, improving air quality, cutting energy consumption, and increasing the efficiency of the state's transportation system. It is highly likely that the future will see the increasing use of congestion pricing. The factors that lead to this conclusion are the:
- need for more aggressive strategies to combat congestion
- increasing number of deployed electronic toll collection systems
- unending search for additional revenue sources
- increasing number of successes achieved with congestion pricing
8.3 Implementation and Operational Considerations
8.3.1 Funding Source Identification
Many managed lane strategies are supported as part of an operating agency's normal activities, or are addressed during development of other components of the freeway management system (e.g., information dissemination subsystems). Consequently, the primary concern for these strategies is the extent to which introducing the new strategy affects the existing budget for operations and maintenance, and whether this impact can be accommodated through a reallocation of agency funds.
Two of the major managed lane options, implementation of tolls and / or congestion pricing strategies, result in revenues that are used to offset the cost of constructing and operating these strategies. Traditionally, toll facilities were converted to "free" roadways once the bonds used to construct the roadway had been paid. Recent changes in legislation, however, now allow agencies to continue toll operations after bond payment, and to use the revenues to fund other traffic management activities.
8.3.2 Incremental Implementation
Experience from past freeway management projects indicate that it is best to implement strategies and techniques incrementally where possible to develop operational experience with the strategies, and to demonstrate the advantages of the techniques to elected officials and to the public. This may be true for some of the more "innovative" or controversial managed lane strategies as well. For these situations, consideration should be given to initiating small, demonstration-type projects at a location or over a section of freeway where the benefits are expected to be the greatest. In this way, the partners can illustrate the benefits of the strategy and generate the support necessary to proceed with more extensive implementation if desired.
8.3.3 Evaluation
The final stop in the decision process for managed lanes is to establish the mechanism for evaluation of the strategies once they have been implemented. It is important to monitor the impacts and benefits of new strategies and techniques as they are implemented to determine if they meet the intended objectives and functions for which they were designed. Also, it is important that these data be collected so that they can be collated and disseminated in an ongoing manner to elected officials and the general public. In this way, continued funding for these strategies can be obtained more readily, and expansion of activities to further improve facility operations will be m ore readily accepted.
8.4 Examples
This section describes some example applications of the managed lane concept.
8.4.1 Variable Speed Limit Signs In Work Zones
The use of variable speed limit signs in work zones has been demonstrated by the Minnesota Department of Transportation (Mn/DOT) (38). The objective of the system was to make work zone speed limits on a high-volume urban freeway easier to sign and enforce. The system incorporated two modular message blocks on each speed limit sign placed in a work zone. The signs are easily moved because they are mounted on U-channel supports. While construction workers are not present, the speed limit continues to be 65 mph. When construction workers arrive, a designated worker changes the speed limit to 45 mph. The displayed speeds are enforceable. In 2000, Mn/DOT deployed one sign for the demonstration. This demonstration has led Mn/DOT to conduct an evaluation to include as many as eight variable speed limit signs (22).
8.4.2 Variable Speed Warning System
A Dynamic Downhill Truck Speed Warning System was installed at the Eisenhower Tunnel on I-70 west of Denver in mid-1995. The objectives were to:
- Identify vehicle-specific safe operating speeds for long downgrades.
- Reduce runaway truck accidents through real-time driver information.
- Modify driver behavior.
The system consists of:
- Weigh in motion sensor
- Changeable message sign
- Inductive loop detectors
- Computer hardware and software
The algorithm within the computer system computes a safe speed based on the truck weight, speed, and axle configuration. The recommended speed is displayed on a variable message sign. Each truck receives a vehicle-specific recommended safe speed message. It is an advisory system. Since system deployment, truck-related accidents have declined on the steep downhill grade sections while the volume of truck traffic has increased by an average of 5 percent per year.
8.4.3 San Antonio Transguide
Transguide is designed to locate incidents within two minutes and then warn motorists within 15 seconds. Upon detection of an incident, the type, lanes obstructed, and traffic data are entered into the server which then searches through a database of over 150,000 scenarios and selects the appropriate response. Among other actions, this response recommends what changes should be made to LCSs, and other equipment. These changes are presented to the operator for review and, upon approval, the system executes all the changes within 15 seconds. LCSs display one of the following symbols to guide motorists into the appropriate lanes:
| This lane or ramp is open to traffic | |
| There is a hazard on a shoulder adjacent to this lane or this ramp has a hazard or congestion ahead; this symbol may soon be used to warn of congestion ahead on freeway mainlanes |
| This lane is closed ahead and traffic should merge in
the direction indicated |
|
| This lane or ramp is closed |
8.5 References
1. Texas Transportation Website, managed-lanes.tamu.edu.
2. Manual of Uniform Traffic Control Devices. (Millennium Edition with Errata) FHWA, U.S. Department of Transportation, Washington, DC, 2000.
3. Dudek, C.L., and Ullman, G.L. Freeway Corridor Management. NCHRP Synthesis of Highway Practice No. 177. TRB, National Research Council, Washington, DC, March 1992.
4. U.S. Department of Transportation, Version 4.0 of the National ITS Architecture, http://www.iteris.com/itsarch/.
5. Douglas, James G., Truck Lane Options, Puget Sound Managed Lanes Workshop, June 7–8, 2001.
6. Middleton, D., Fitzpatrick, K., Jasek, D., and Woods, D. Truck Accident Countermeasures on Urban Freeways. FHWA-RD-92-059. FHWA, U.S. Department of Transportation, Washington, DC, May 1994.
7. Effects of Lane Restrictions for Trucks, FHWA, Washington, D.C., June 1986.
8. Stokes, R., and McCasland, W.R., Truck Operations and Regulations on Urban Freeways in Texas, ITE Journal, Vol. 56, No.2, pp 17–21, February 1986.
9. TTI Evaluates Lane Restrictions for Houston Demonstration Project, Texas Transportation Researcher, Volume 38, Number 1 (2002).
10. An Evaluation of the Impact of Lane Use Restrictions for Large Trucks along I-40 near Knoxville, Research Capsule, Tennessee Department of Transportation, Volume 1, Issue 1, June 2003.
11. AASHTO, A Policy on Geometric Design of Highways and Streets, 2001.
12. Curren, J.E., Use of Shoulders and Narrow Lanes to Increase Freeway Capacity, NCHRP Report 369. TRB, National Research Council, Washington, DC, 1995.
13. Synthesis of Safety Research Related to Traffic Control and Roadway Elements: Volume 1, Washington, D.C.: Federal Highway Administration, 1982.
14. Poole, R.W. Jr., Introducing Congestion Pricing on a New Toll Road. Transportation Research Record No. 1359. TRB, National Research Council, Washington, DC, 1992, pp 19–25.
15. Rathbone, Daniel B, Moveable Barrier Assisted Traffic Management To Mitigate Congested Highways, Bridges and Tunnels, DBR Associates, August, 1999.
16. MacCalden, M.S., A Traffic Management System for the San Francisco-Oakland Bay Bridge, ITE Journal, Vol. 54, No. 5, May 1984, pp 46–51.
17. Computran Systems Corp. Holland and Lincoln Tunnel Access Metering Study, July 1994.
18. Traffic Engineering Handbook. Institute of Transportation Engineers, Washington, DC, 1992.
19. Robinson, Mark, Examples of Variable Speed Limit Applications, Speed Management Workshop, TRB 79th Annual Meeting, January 9, 2000.
20. Klijnhout, I., Motorway Control and Signalling: The Test of Time, Traffic Engineering and Control. Volume 25, No. 4, April 1984.
21. Work Zone Operations Best Practices Guidebook, Publication No. FWHA-OP-00-010, April 2000.
22. Work Zone Mobility and Safety Self Assessment Guide, FHWA.
23. Hanscom, F., Effectiveness of Changeable Message Displays in Advance of High-Speed Freeway Lane Closures, Biotechnology, Inc., NCHRP Report 235, September 1981.
24. Maze, T., E. Meyer, N. Shaik, and P. T. McCoy, Midwest State Smart Work Zone Deployment Initiative, May 2000. website http://www.matc.unl.edu/project/.
25. Finley, M.D.; G. L. Ullman; K. D. Parma; and N. D. Trout. "Yellow Transition Lane Control Signal Symbols for Freeway Traffic Management." Transportation Research Board Paper 01184. Transportation Research Board Meeting, Washington, DC, January 2002.
26. Ullman, G. "Motorists Interpretations of MUTCD Freeway Lane Control Signals". Texas Transportation Institute, January 1993.
27. Forbes, T.W.; E. Gervais; and T. Allen. "Effectiveness of Symbols for Lane Control Signals." Highway Research Bulletin, No. 244, Highway Research Board, Washington, D.C., 1959.
28. Vollmer Associates, E-ZPass Evaluation Report, August 2000.
29. Reconnect, New Means of Transport Survey and Preselection, European Commission, Transport RTD 4th Framework Programme, May 1999.
30. Freedman, M., A.F. Williams, and A.K. Lund, Public Opinion Regarding Photo-Radar, Transportation Research Record 1270, Transportation Research Board, 1990.
31. Fontaine, M., Schrock, S., Ullman, G., Feasibility of Real-time Remote Speed Enforcement for Work Zones, Transportation Research Board, 81st Annual Meeting, January 2002.
32. Cheryl W. Lynn, Robyn Lau, Nicholas J. Garber, Janice V. Alcee, Wayne S. Ferguson, Jonathan C. Black, Torsten K. Lienau, Peter M. Wendzel, Final Report: Automated Speed Enforcement Pilot Project for the Capital Beltway: Feasibility of Photo-Radar, November 1992.
33. Fontaine, M. D, "Guidelines for the Application of Portable Work Zone Intelligent Transportation Systems", Virginia Transportation Research Council, Transportation Research Board, January 2003.
34. Tudor, L. H., A. Meadors, and R. Plant "Deployment of Smart Work Zone Technology in Arkansas", Arkansas State Highway and Transportation Department, Transportation Research Board Annual Meeting, Washington, D.C., January 2003.
35. Lay, R., Saxton, L., Vehicle-Highway Automation, Directions, Challenges, and Contributing Factors, Millennium Paper for TRB Committee A3A53, Task Force on Vehicle-Highway Automation.
36. Curbing Gridlock: Peak-Period Fees to Relieve Traffic Congestion, Vol. 1 & 2, National Research Council, Washington, D.C., May 1993.
37. "Exploring the Role of Pricing as a Congestion Management Tool," Federal Highway Administration, Washington, D.C., July 23, 1991.
38. Paniati, J. "Intelligent Transportation Systems in Work Zones – A Cross Cutting Study". ITS JPO Federal Highway Administration, November 2002.
39. Perez, B.G., Sciara, G.C., et al., A Guide for Hot Lane Development, Federal Highway Administration.
40. Flores, Claudia D., Corridor Management, Module 9, p. 82, Technology Division, Center for Advanced Transportation Technology, Cerritos College.