National Road Pricing Conference
Shoulder Conversion to HOT Lane Workshop
Workshop Presentation
Slide 1
Shoulder Conversion to HOT Lane Workshop
National Road Pricing Conference
June 4, 2010
Ginger Goodin, Texas Transportation Institute
Greg Jones, Federal Highway Administration
Slide 2
Workshop Purpose
Provide hands-on practice in applying lessons learned and best practices from implemented projects across the country
- Understand the challenges in implementing pricing projects
- Move pricing forward in your area
Slide 3
Workshop Agenda
- Review of Project
- Break into groups for exercises
- Five subject areas covered
- 5-10 minute overview of subject area
- 35-40 minutes to complete exercise
- Break for lunch after second round of exercises
- Group reports
Slide 4
Subject Areas
- Planning
- Operations
- Design
- Funding and Finance
- Outreach
No specific order, all have overlapping elements
Slide 5
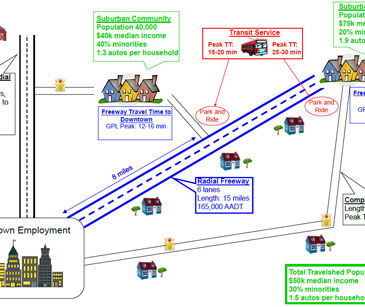
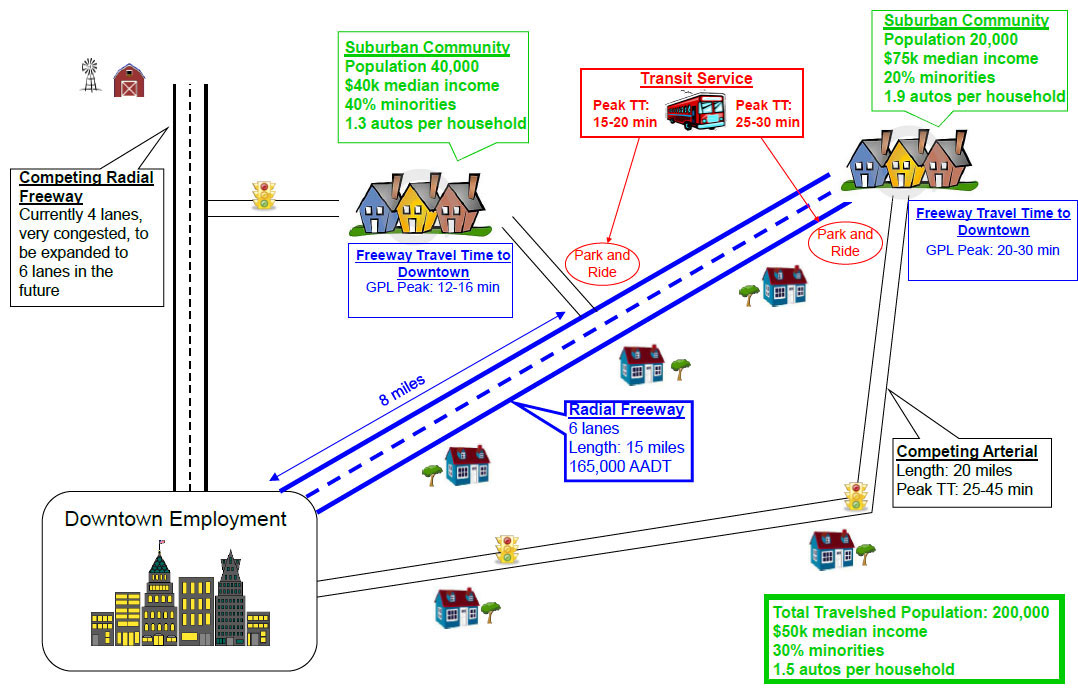
Our Project
Length: 15 miles
6 lanes with 10' shoulders on both sides
165,000 AADT and growing
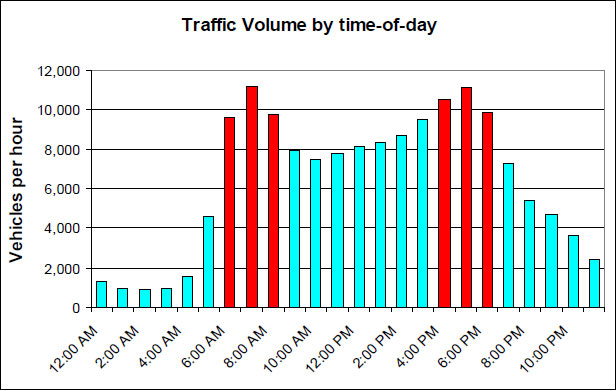
Peak period speeds consistently reach 30mph
Drainage inlets every 0.5 mile with 4" depression in left shoulder
Additional 20' of ROW periodically available beyond right shoulder
Rumble strips on outside edgelines
Four bridge abutments exist along the facility
Existing ITS components include cameras, loop detection in all lanes at half mile spacing and on freeway ramps, DMS, & ramp meters.
Slide 6
Slide 7
Project Characteristics
- Corridor History
- Congestion worsening
- Downtown businesses seeking alternatives to bring more commuters downtown
- Opposition to capacity improvements on adjacent radial corridor from environmental interests
- Corridor demographics
- Varies by sub-area
- Total travelshed population = 200,000
- $50,000 median income
- 30% minorities
- 1.5 autos per household
Slide 8
Project Characteristics
General Purpose Lanes
- 6 lanes with 10' shoulders
- 165,000 AADT and growing
Slide 9
Project Characteristics
Project Partners
- State DOT
- Owner of lanes and ROW
- Operator of freeway
- Transit authority
- Operator of express bus service and park-and-ride facilities
- Regional toll authority
- Operates one toll road in region
- Cash and transponder-based electronic tolling
- Metropolitan Planning Organization
- State Police
- Enforces traffic laws on state highways
Slide 10
Project Characteristics
- Legal authority – HOT and shoulder running allowed by state statute
- Regional policies – none for shoulder conversion
- Project partners – state DOT (owner of ROW), transit authority, regional toll authority, state police
- Toll authority currently operating one toll road in region with ETC (transponder)
- Environmental clearance – FONSI expected
- Design exceptions – submit request to FHWA prior to implementation
Slide 11
Project Characteristics
- Cross section
- Access
- Location and method of access undetermined
- Enforcement
- Subject to design and location
Slide 12
Project Characteristics
- Estimated project costs
- Capital costs: $ 10,000,000
- Annual operating costs: $ 1,000,000
- Bus volumes
- Available funding
- State is committed to contributing $ 8,000,000
- Traffic and revenue studies - none
- Revenue sharing potential – Regional toll authority
- Possible funding partners - Regional toll authority and transit agency
Slide 13
Planning
- Establish goals and objectives and clearly communicate a vision
- Take advantage of opportunities
- Maintain flexibility
- Engage project partners and encourage agency cooperation
Slide 14
Planning Exercise
Slide 15
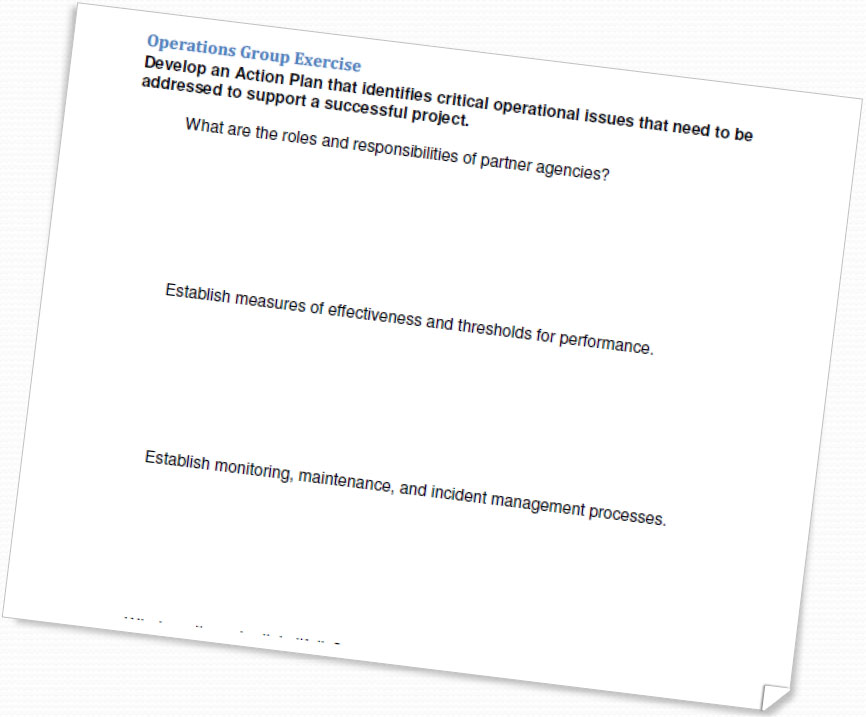
Operations
- Develop a Concept of Operations to guide the process
- Establish a minimum operating speed threshold of 45 mph for HOT operation
- Select the appropriate user group to best optimize the added capacity and achieve stated objectives
- Ensure that temporary use of the shoulder as a HOT lane is only deployed when needed
Slide 16
Operations
- Establish operational procedures that ensure the safety of users and help maximize the potential benefits of using the shoulder during congested periods
- Ensure operations integrate with existing systems
- Determine if existing incident management protocol will be applicable to shoulder operations
- European applications of shoulder use have typically been accompanied by one or more ATM strategies
Slide 17
Operations Exercise
Slide 18
Design
- Ensure the safest design possible that provides adequate space for identified users and necessary maneuvers
- Provide adequate space for emergency refuge and/or enforcement whenever possible
- Provide clear information to users to ensure their comprehension of the facility and the specifics of operation
Slide 19
Design Exercise
Slide 20
Funding and Finance
- Consider any and all funding and/or financing mechanisms
- Available assistance through federal programs
- Stakeholders
- Revenue sharing
Slide 21
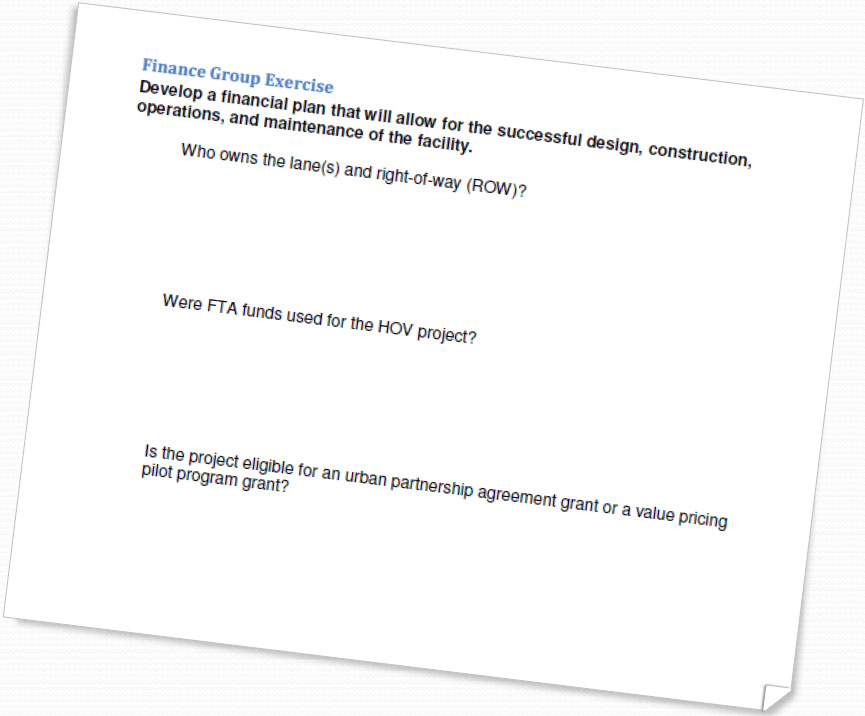
Finance Exercise
Slide 22
Outreach
- Identify project champions
- Conduct market research and identify issues
- Develop clear and concise messages
- Communicate project goals
- Continue from project development through operations
- Create brand awareness
Slide 23
Outreach Exercise
Slide 24
Breakout Group Reports