National Road Pricing Conference
HOV-to-HOT Lanes Workshop
Workshop Presentation
Slide 1
HOV-to-HOT Lanes Workshop
National Road Pricing Conference
June 4, 2010
Mark Burris, Texas Transportation Institute
Jessie Yung, Federal Highway Administration
Slide 2
Workshop Purpose
Provide hands-on practice in applying lessons learned and best practices from implemented projects across the country
- understand the challenges in implementing pricing projects
- move pricing forward in your area
Slide 3
Workshop Agenda
- Review of Project
- Break into groups for exercises
- Five subject areas covered
- 5-10 minute overview of subject area
- 20-25 minutes to complete exercise
- Break for lunch after second round of exercises
- Group reports
Slide 4
Subject Areas
- Planning
- Operations
- Design
- Funding and Finance
- Outreach
No specific order, all have overlapping elements
Slide 5
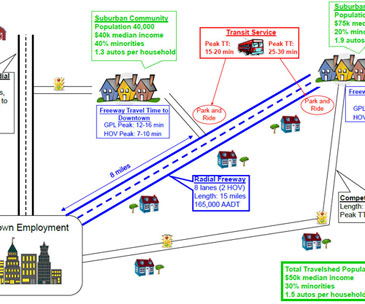
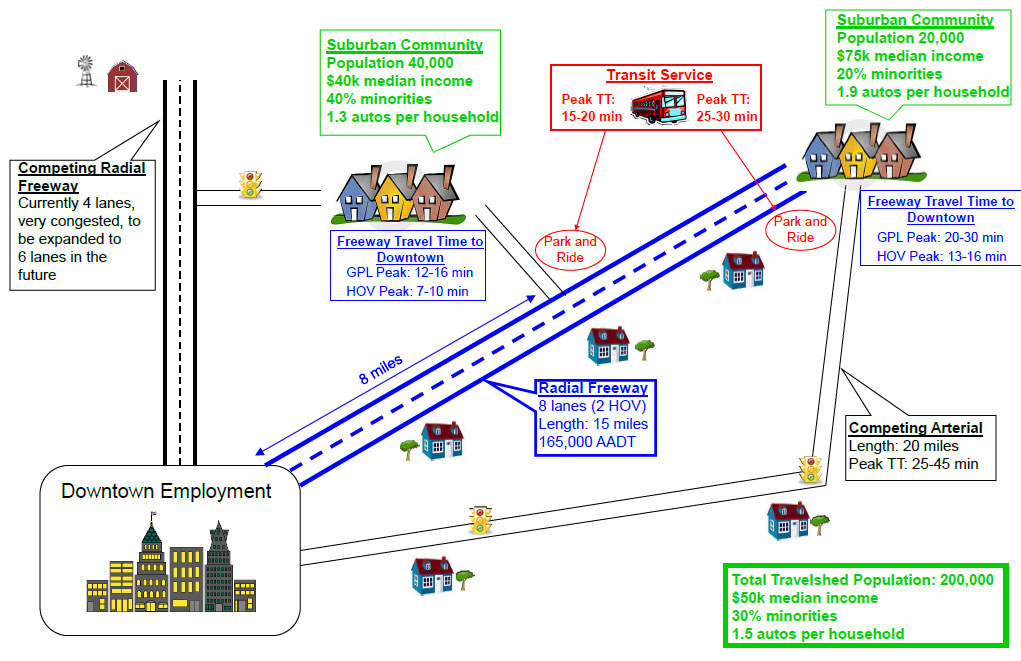
Our Project
Radial freeway corridor serving major activity center
15 miles total length
3 GP lanes in each direction
1 HOV lane in each direction
Transit service with two park-and-ride facilities
Downtown rapidly developing and congestion growing
No funding for expansion. Congested 4-lane adjacent radial freeway is funded for expansion
Parallel arterial
Slide 6
Slide 7
Project Characteristics
- Corridor History
- Congestion worsening
- Downtown businesses seeking alternatives to bring more commuters downtown
- Opposition to capacity improvements on adjacent radial corridor from environmental interests
- Corridor demographics
- Varies by sub-area
- Total travelshed population = 200,000
- $50,000 median income
- 30% minorities
- 1.5 autos per household
Slide 8
Project Characteristics
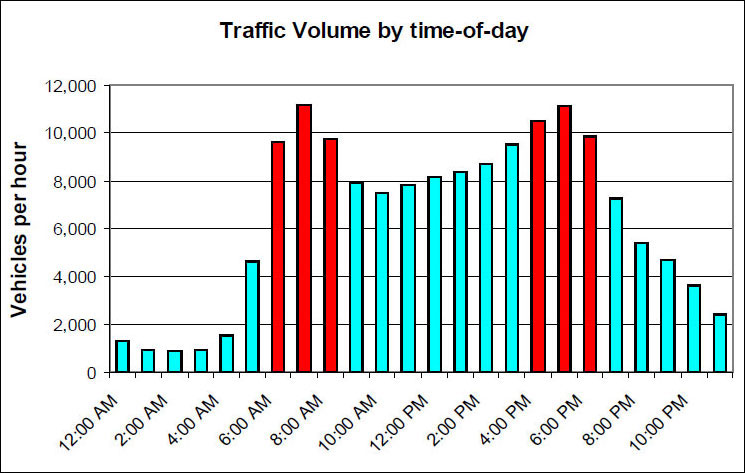
General Purpose Lanes
- 6 lanes with full shoulders
- 165,000 AADT and growing
Slide 9
Project Characteristics
- HOV Project History
- Operating for 9 years
- Construction funding came from state and federal sources
- Full-time HOV2+ operation (24/7)
- Peak period average vehicle occupancy of 2.21
- Public perception of underutilization, 1000 vph in peak
- Park-and-ride utilization at 65% , 2 lots
Slide 10
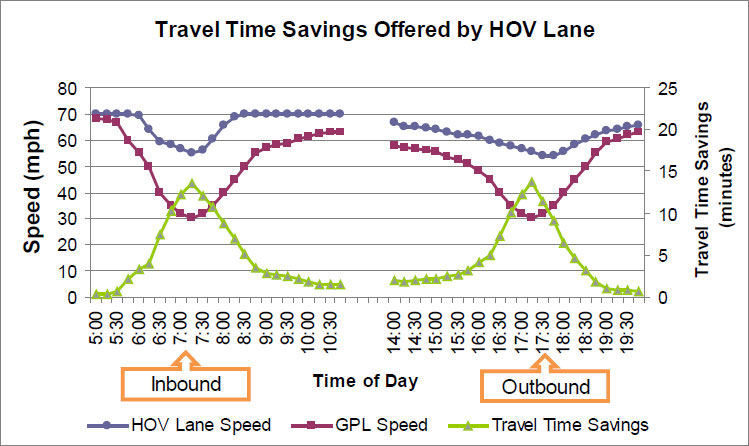
HOV lanes
- 2 lanes, one in each direction
- Buffer separated
- Peak volumes 800-1000 vehicles per hour
- Peak period speed 65 mph
Slide 11
Project Characteristics
Project Partners
- State DOT
- Owner of lanes and ROW
- Operator of freeway
- Transit authority
- Operator of express bus service and park-and-ride facilities
- Regional toll authority
- Operates one toll road in region
- Cash and transponder-based electronic tolling
- State police
- Metropolitan Planning Organization
Slide 12
Project Characteristics
- Legal authority
- HOT allowed by state statute
- Regional policies
- Conversion of HOV lane to HOT lane in long range plan
- No policies on toll rate setting, occupancy, etc.
- Environmental clearance – FONSI expected
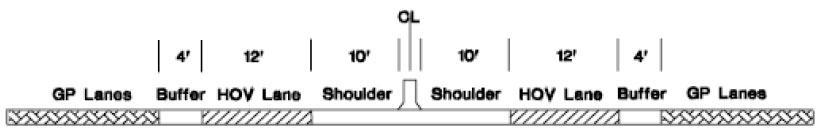
Slide 13
Project Characteristics
- Cross section
- Access
- In addition to termini, two intermediate access points to HOV lane
- Between the two P&R lots
- Between P&R lot and downtown
- Enforcement
- Enforcement areas (14' shoulder) located on downstream ends of intermediate access points
Slide 14
Project Characteristics
- Estimated project costs
- Capital costs: $10,000,000
- Annual operating costs $1,000,000
- Available funding
- State is committed to contributing $8,000,000
- FHWA/FTA program requirements and limitations – FTA funds used in construction of HOV lanes
- Traffic and revenue studies – none
Slide 15
Planning
- Establish goals and objectives and clearly communicate a vision
- Take advantage of opportunities
- Maintain flexibility
- Engage project partners and encourage agency cooperation
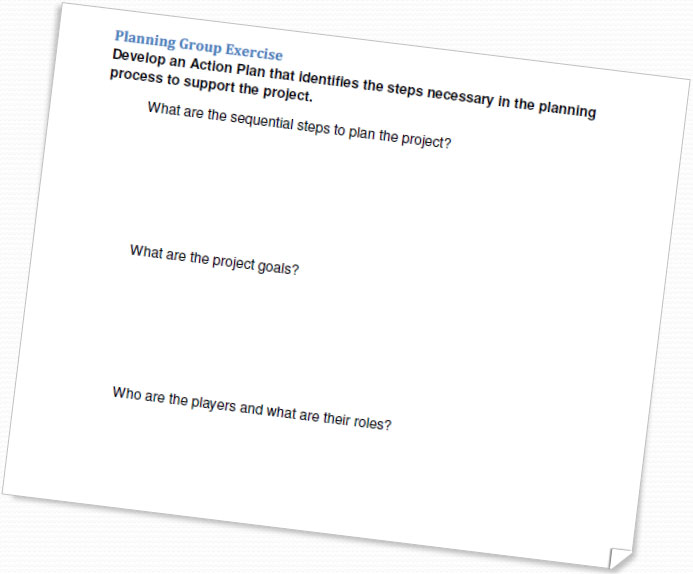
Slide 16
Planning Exercise
Slide 17
Operations
- Develop a Concept of Operations to guide the process
- Determine vehicle occupancy based on current operating conditions
- Pricing strategy
- Tolling policy
- Enforcement
- Hours of operation
- Operating parameters/goals
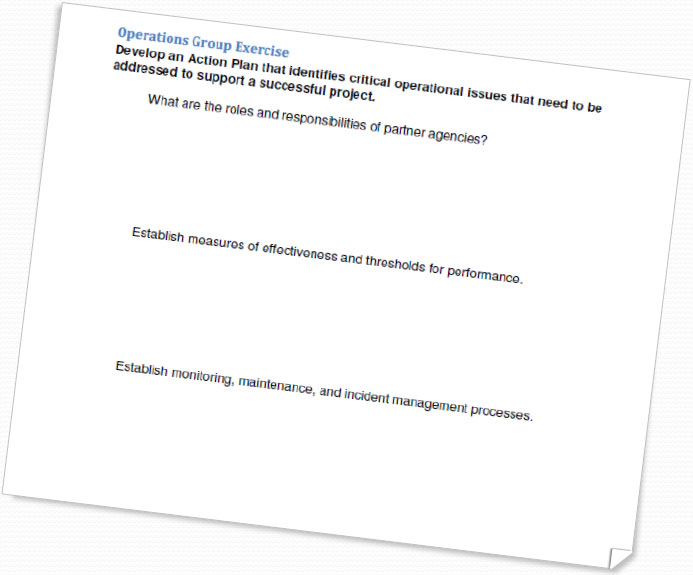
Slide 18
Operations Exercise
Slide 19
Design
- Depends on design of HOV lanes and available room in the corridor to make modifications
- Separation mechanism
- Access locations
- Toll collection locations
- Coherent signing program
- Wider buffer when using pylons or paint
- Safe merging/weaving distances
- Incident detection and use of ITS
- Number of lanes
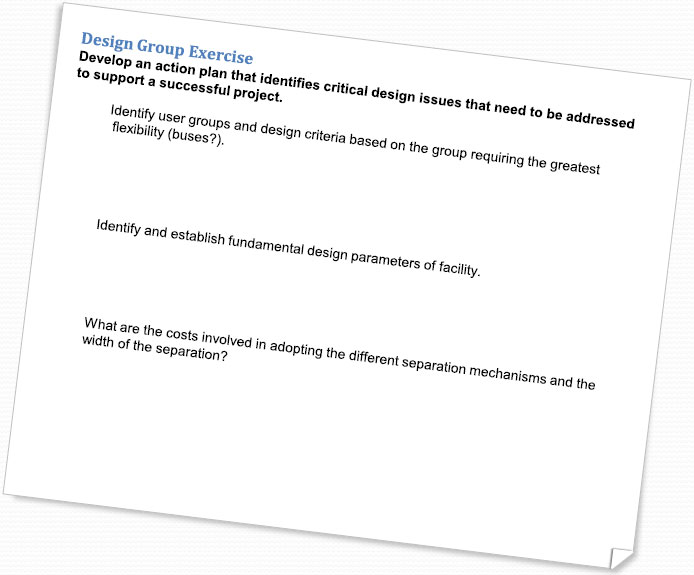
Slide 20
Design Exercise
Slide 21
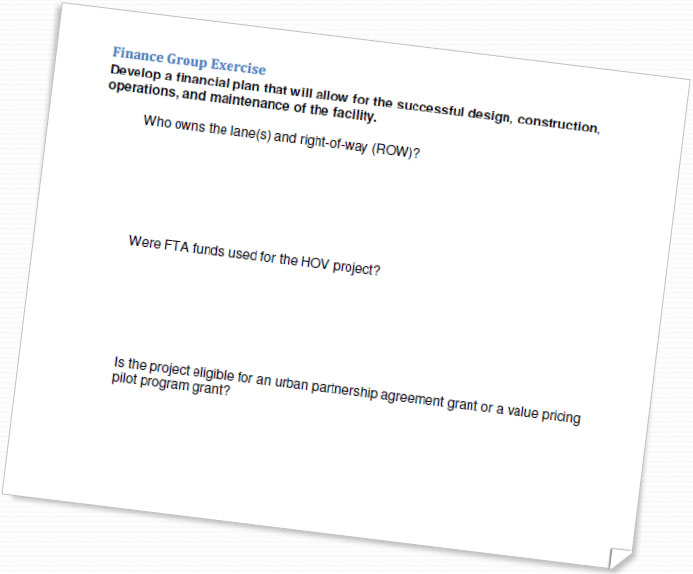
Funding and Finance
- Ownership for facility and right-of-way
- Available assistance through federal programs
- Stakeholders
- Revenue sharing
Slide 22
Finance Exercise
Slide 23
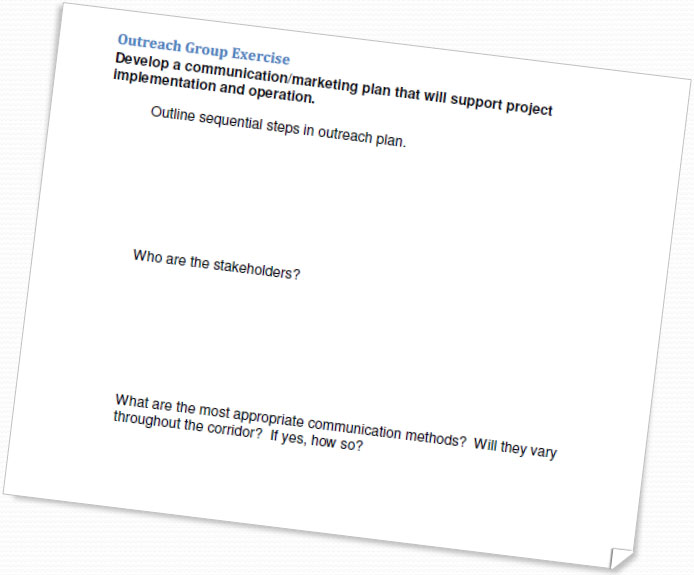
Outreach
- Identify project champions
- Conduct market research and identify issues
- Develop clear and concise messages
- Communicate project goals
- Outreach to travelers about changes in access or other conditions
- Continue from project development through operations
- Create brand awareness
Slide 24
Outreach Exercise
Slide 25
Breakout Group Reports