National Road Pricing Conference
Added Capacity - HOT Lane Workshop
Workshop Presentation
Slide 1
Added Capacity - HOT Lane Workshop
National Road Pricing Conference
June 4, 2010
Jennifer Tsien, PBS&J
Angela Jacobs, Federal Highway Administration
Slide 2
Workshop Purpose
Provide hands-on practice in applying lessons learned and best practice from implemented projects across the country
- Understand the challenges in implementing pricing projects
- Move pricing forward in your area
Slide 3
Workshop Agenda
- Review of Project
- Break into groups for exercises
- Five subject areas covered
- 5-10 minute overview of subject area
- 20-25 minutes to complete exercise
- Break for lunch after second round of exercises
- Group reports
Slide 4
Subject Areas
- Planning
- Operations
- Design
- Funding and Finance
- Outreach
No specific order, all have overlapping elements
Slide 5
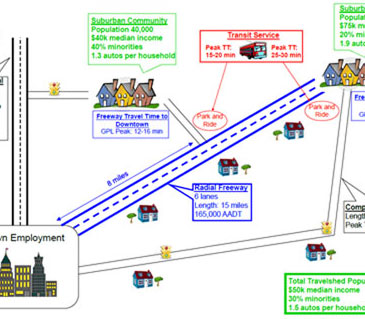
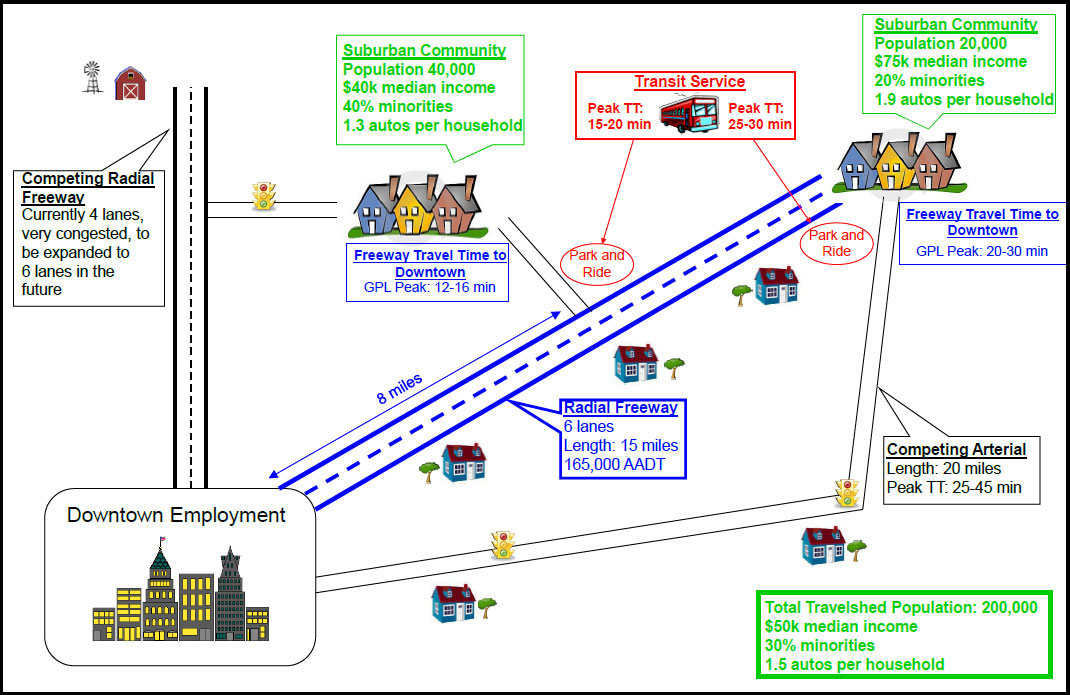
Our Project
Slide 6
Slide 7
Project Characteristics
- Corridor History
- Congestion worsening
- Downtown businesses seeking alternatives to bring more commuters downtown
- Opposition to capacity improvements on adjacent radial corridor from environmental interests
- Corridor demographics
- Varies by sub-area
- Total travelshed population = 200,000
- $50,000 median income
- 30% minorities
- 1.5 autos per household
Slide 8
Project Characteristics
General Purpose Lanes
- 6 lanes with 10' shoulders
- 165,000 AADT and growing
Slide 9
Project Characteristics
Project Partners
- State DOT
- Owner of lanes and ROW
- Operator of freeway
- Transit authority
- Operator of express bus service and park-and-ride facilities
- Regional toll authority
- Operates one toll road in region
- Cash and transponder-based electronic tolling
- Metropolitan Planning Organization
Slide 10
Project Characteristics
- Legal authority – HOT and express allowed by state statute
- Regional policies – No policies on toll rate setting, occupancy, etc.
- Project partners – state DOT (owner of ROW), transit authority, regional toll authority, state police
- Toll authority currently operating one toll road in region with ETC (transponder) and cash
- Environmental clearance – FONSI expected
Slide 11
Project Characteristics
- Cross section
- Total right of way available: 200 feet
- Access
- Location and method of access undetermined
- Enforcement
- Subject to design and location
Slide 12
Project Characteristics
- Estimated project costs
- Capital costs: $ 50,000,000
- Annual operating costs: $ 1,000,000
- Available funding
- State is committed to contributing $ 28,000,000
- Traffic and revenue studies - none
- Revenue sharing potential – Regional toll authority, private partner
- Possible funding partners - Regional toll authority, private partner
Slide 13
Planning
- Establish goals and objectives and clearly communicate a vision
- Take advantage of opportunities
- Maintain flexibility
- Engage project partners and encourage agency cooperation
Slide 14
Planning Exercise
Slide 15
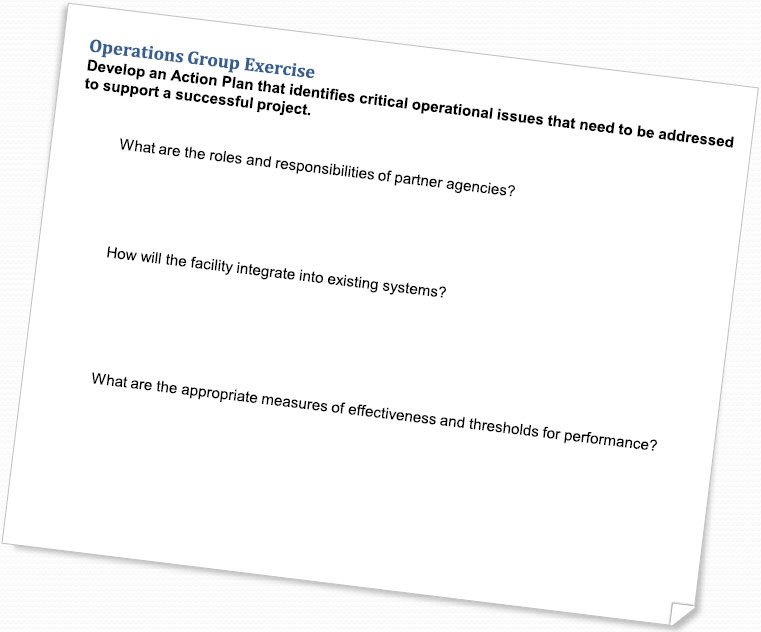
Operations
- Develop a Concept of Operations to guide the process
- Establish Operational Policy
- Leverage technology and operational strategies
- Implement and maintain stakeholder group
- Identify design and legislative impacts of operational goals
- Enforcement strategies
Slide 16
Operations Exercise
Slide 17
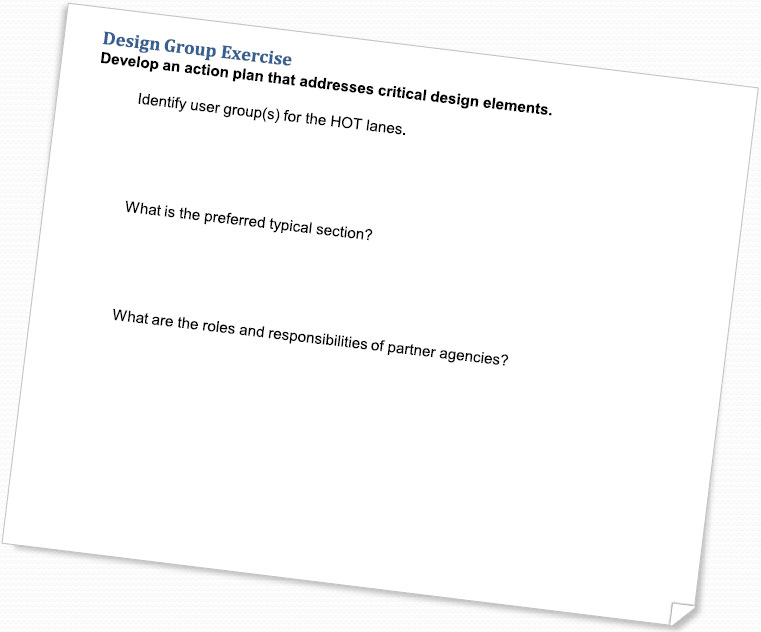
Design
- Identify user groups for the HOT lanes
- Provide safe and efficient design
- Provide enforcement areas
- Communicate to the public at the roadside
Slide 18
Design Exercise
Slide 19
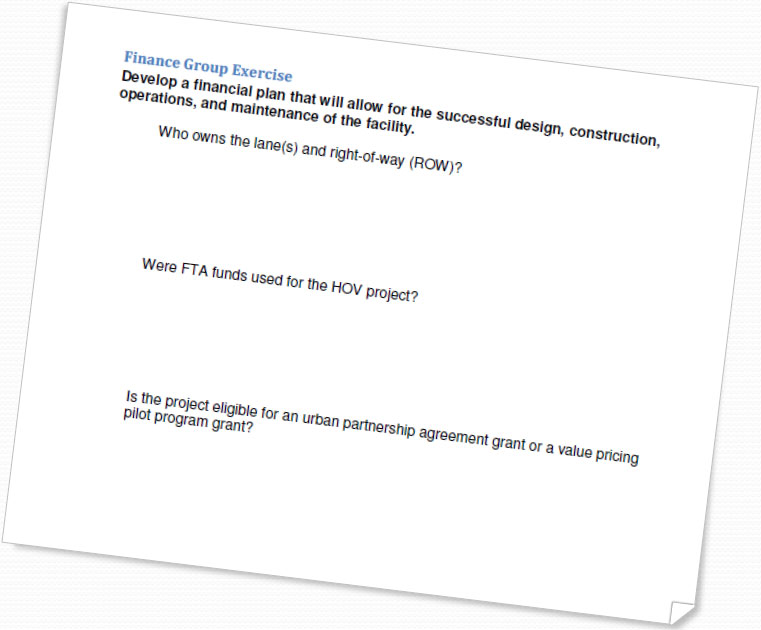
Funding and Finance
- Consider any and all funding and/or financing mechanisms
- Available assistance through federal programs
- Stakeholders
- Revenue sharing
Slide 20
Finance Exercise
Slide 21
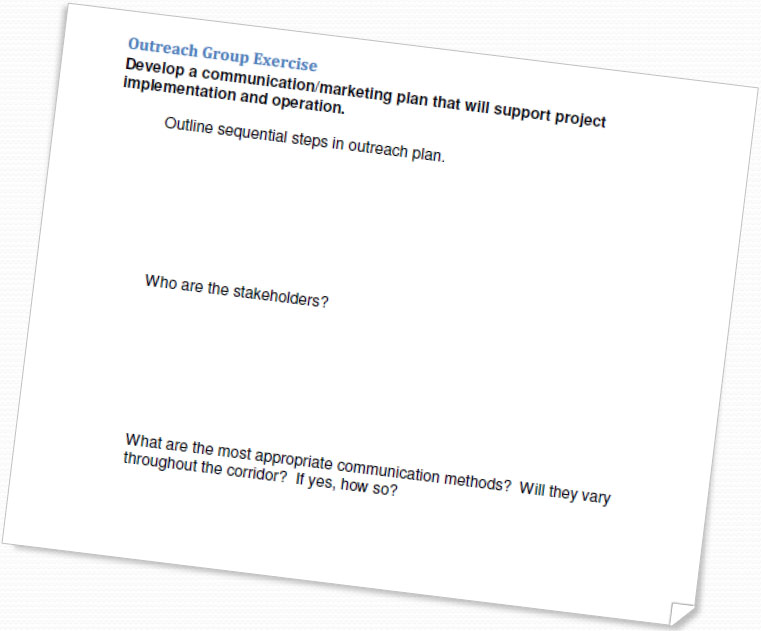
Outreach
- Identify project champions
- Conduct market research and identify issues
- Develop clear and concise messages
- Communicate project goals
- Continue from project development through operations
- Create brand awareness
Slide 22
Outreach Exercise
Slide 23
Breakout Group Reports