Deploying Advanced Technology Infrastructure for Transportation Systems Management & Operations in Maryland: US 1 Innovative Technology Deployment Corridor
Appendix D: RITIS and Other UMD Analysis Visualization Capabilities
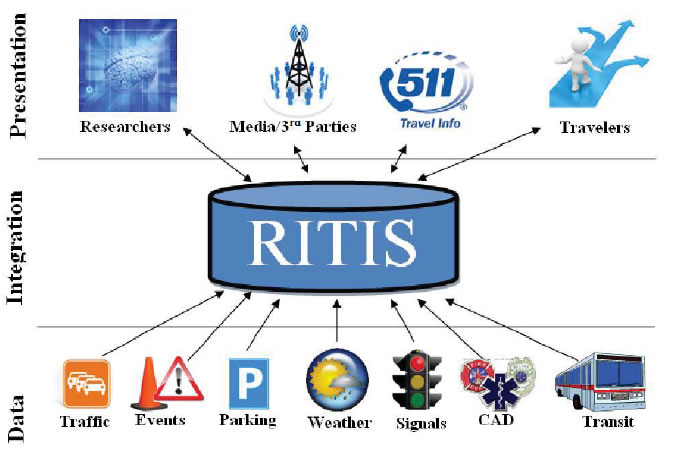
RITIS is an automated data sharing, dissemination, and archiving system that includes many performance measure, dashboard, and visual analytics tools that help agencies to gain situational awareness, measure performance, and communicate information between agencies and to the public.
RITIS automatically fuses, translates, and standardizes data obtained from multiple agencies in order to provide an enhanced overall view of the transportation network. Participating agencies are able to view transportation and related emergency management information through innovative visualizations and use it to improve their operations and emergency preparedness. RITIS also uses regional standardized data to provide information to third parties, the media, and other traveler information resources including web sites, paging systems, and 511.
RITIS Features
There are three main RITIS components including:
- Real-time data feeds;
- Real-time situational awareness tools; and
- Archived data analysis tools.
Real-Time Data Feeds
RITIS data feeds are services that provide direct access to real-time incident, event, detector, probe, weather, transit, and other data sources including ITS device status. The RITIS data feeds are designed to facilitate integration of RITIS data back into legacy and third party systems and for 3rd-
party application developers that need access to real-time information for dynamic mobility applications. The data feeds provide for implementation flexibility both in data format and retrieval method. The RITIS platform allows each agency to determine which data elements it wishes to provide in the data feed or maintain secure and secluded from other agencies or the public.
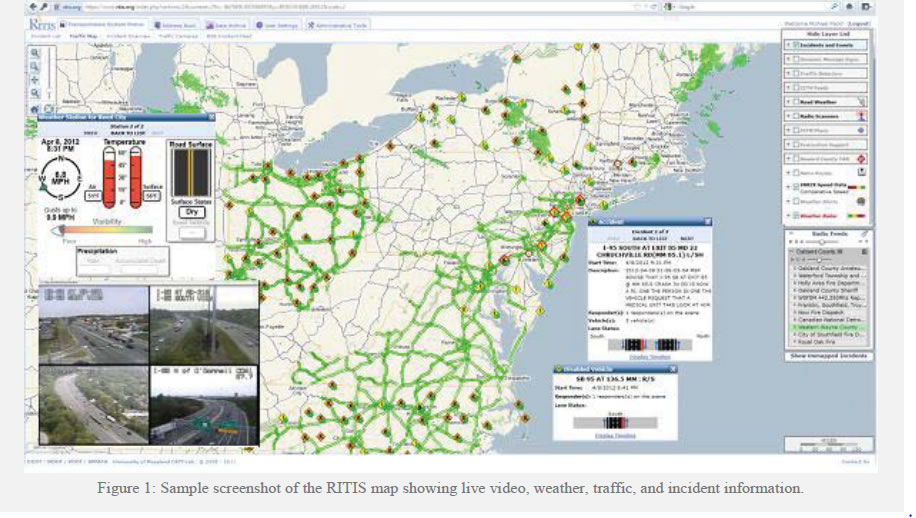
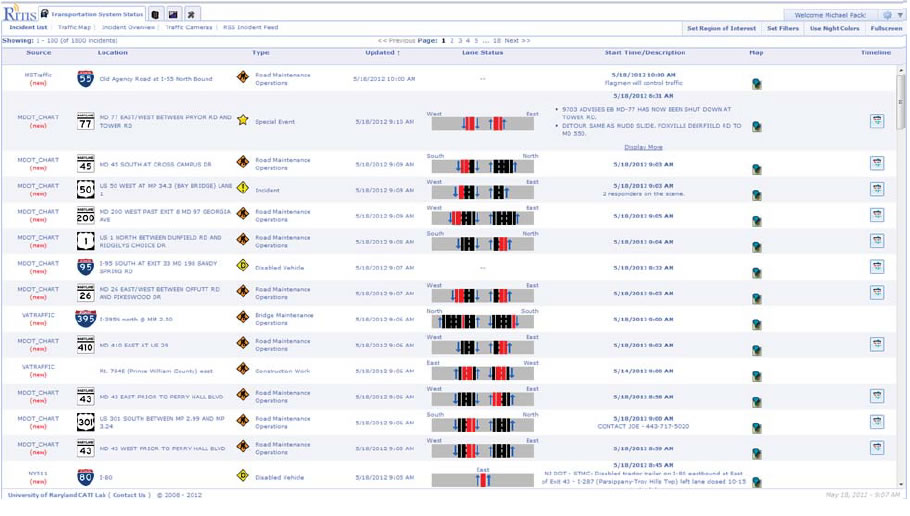
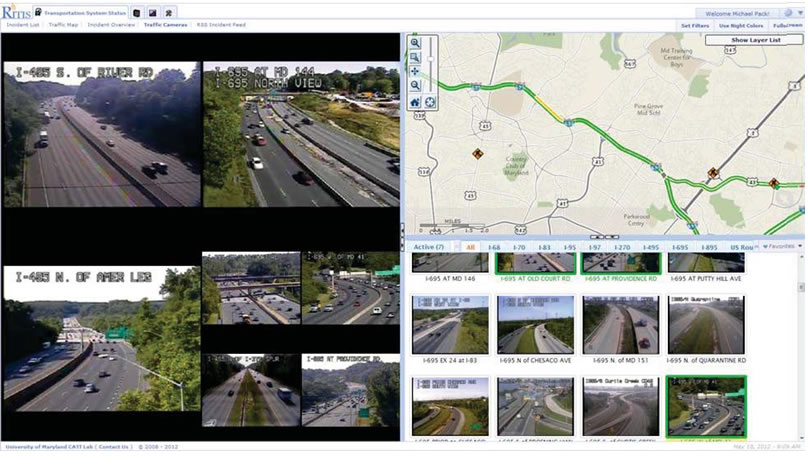
Real-Time Situational Awareness Tools
The RITIS website allows users with appropriate credentials to view all of the real-time RITIS data in a browser. The website provides users with a dynamic set of visualizations and tools that afford efficient situational awareness. Authorized users can interact with live events, incidents, weather, sensors, radio scanners, and other data sources and devices in maps, lists, and other graphics. Users can apply a rich set of filters, access contact information, and even set up alerts. Public safety or DOT employees who wish to get an account to the RITIS platform can do so by visiting https://www.ritis.org/register/ and filling out their contact information. There is no cost to get access. Accounts are not given to the public or the private sector due to the sensitive nature of some of the data.
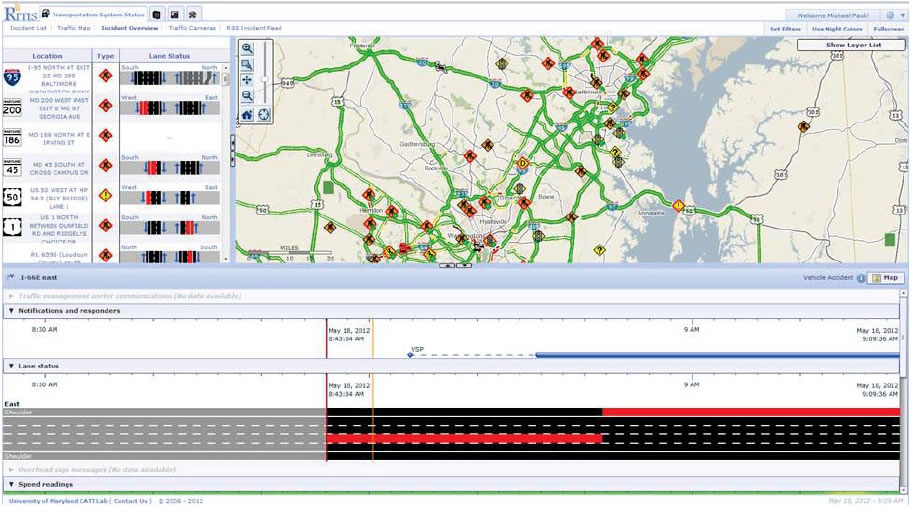
Archived Data Analysis Tools
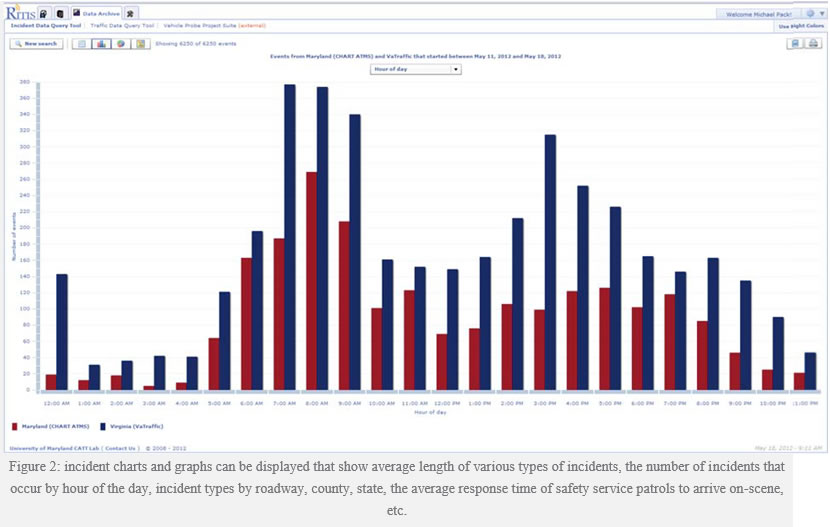
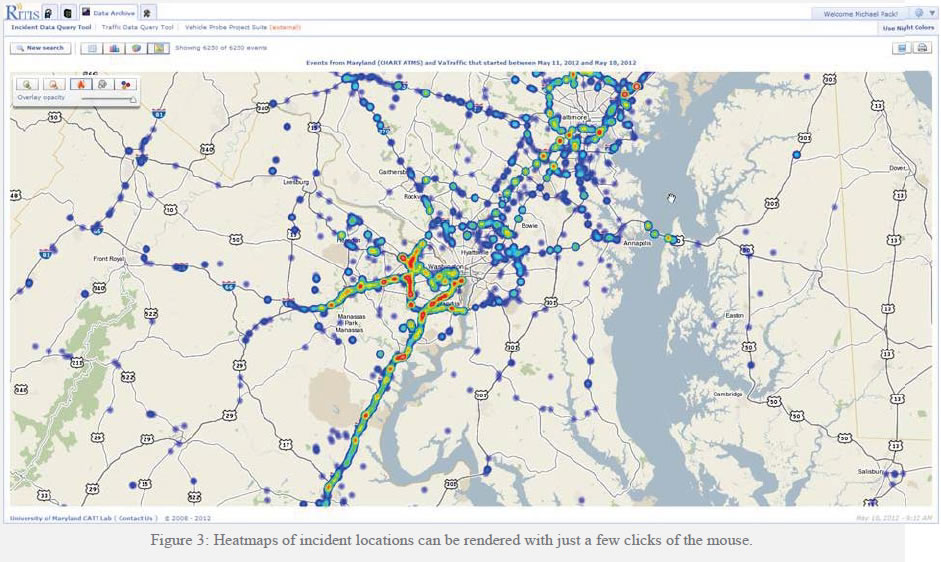
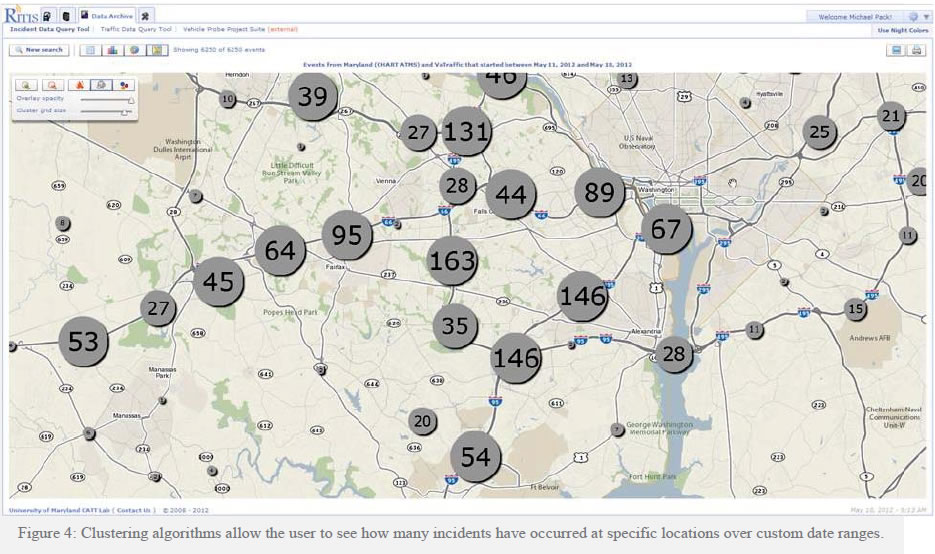
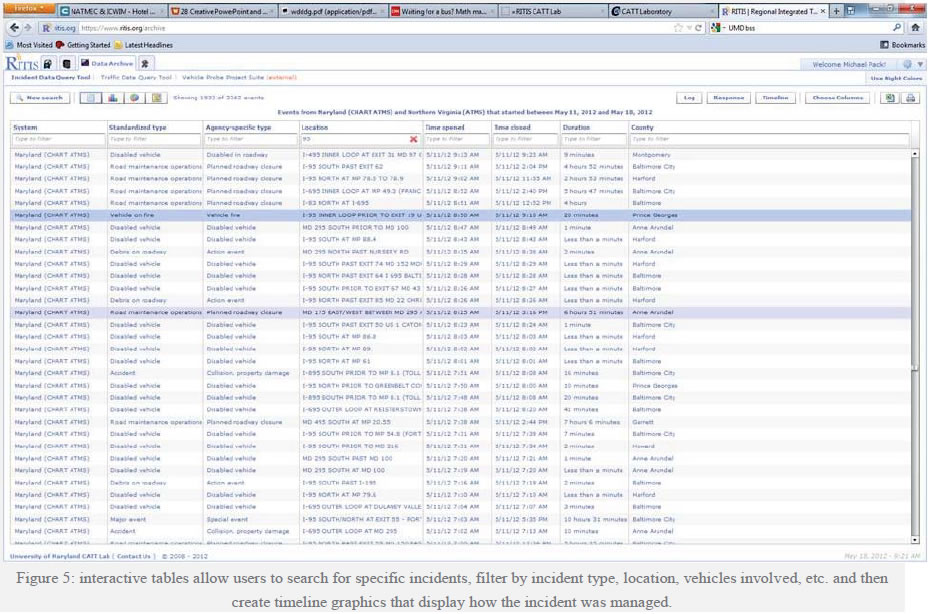
All data within RITIS is archived indefinitely—meaning that no data is ever deemed “too old” to be removed from user access. A number of online tools have been developed to allow users to query, analyze, and derive performance measures from the RITIS archive. Many of these tools are highly interactive and dynamic. They have been developed with the user in mind and afford a high degree of freedom to explore the data with minimal training needed. Data within the archive can also be downloaded and/or exported so that users can perform their own, independent analysis. These tools can allow users to identify accident hot-spots, analyze queue lengths and traffic congestion/bottlenecks at specific areas, perform after action reviews, and evaluate the effectiveness of transportation operations strategies. A few screenshots of these applications are included below; however, we encourage you to check out the many additional archived data analysis tools that are featured in our portfolio.