Organizing for Reliability – Capability Maturity Model Assessment and Implementation Plans
Executive Summary
2.0 Summary of All Capability Dimensions
Table 2.1 and Figure 2.1 presents the range of self-assessment levels by CMM dimension and capability level for the 23 workshop locations with implementation plans analyzed in this report.
Table 2.1 Workshop Self-Assessment Levels Distribution by Dimension (23 Workshops)
| Dimension |
Capability Self-Assessment – Level 1 Performed |
Capability Self-Assessment – Level 2 Managed |
Capability Self-Assessment – Level 3 Integrated |
Capability Self-Assessment – Level 4 Optimizing |
| Business Processes |
11 |
10 |
2 |
0 |
| Systems and Technology |
7 |
12 |
3 |
1 |
| Performance Measurement |
9 |
11 |
3 |
0 |
| Culture |
8 |
11 |
4 |
0 |
| Organization and Staffing |
8 |
9 |
6 |
0 |
| Collaboration |
4 |
12 |
6 |
1 |
Note: Workshop self-assessment scores were often augmented with a “plus” or “minus” or given as a fraction (e.g., 1.5). For the purpose of the exhibit, “pluses” and “minuses” were ignored and all fractions were rounded to a whole number (with one-halves rounded down).
Self-assessment “scoring” is subjective and specific to each site. The result represents the consensus of workshop participants – agency staff and their partners. The distribution of assessment levels shown in Table 2.1 and Figure 2.1 suggest certain general conclusions:
- Most locations assessed themselves at the “performed” or “managed” level (often somewhere in between) for most dimensions. This suggests that key issues for those dimensions are increasingly well-understood and consideration is being given to improvement actions. However, only a few agencies indicated reaching the level of “integrated” for any given dimension, even fewer rated themselves at that level in more than one dimension, and only two locations rated themselves as “optimizing” in a specific dimension.
- Collaboration and Systems and Technology are the strongest dimensions: for Collaboration, this appears to reflect the impact of recent FHWA incident management training and other collaboration outreach; for Systems and Technology, this is based on the accumulated experience with technology deployment over the past 10-15 years. Performance Management and Business Processes (reflecting planning and programming) exhibited a different pattern: most agencies were aware of the need for improvement in these areas in response both to Federal policy and their own internal needs – and are beginning to evolve approaches to meet those needs.
- There is often a significant gap between best practice and average practice among sites within any given dimension. Even within individual States, progress in improving capabilities across the six dimensions is uneven. In many cases, however, there is visible change and strong staff leaders that are fully aware of best practice and are working within their agencies to establish the essential capabilities.
- While the aggregate assessment distributions among several dimensions were similar, this result masks very different distributions within individual agencies; that is, strengths and weakness differed among agencies responding to varying conditions.
Figure 2.1 Graph. Distribution of Self-Assessments (23 Workshops)
(Source: Cambridge Systematics, Inc. and Parsons Brinckerhoff.)
It should be noted that the self-assessment scores cannot be used for cross-site comparisons, as some sites were “tougher” self-graders than others. However, within any given workshop location, the scores for each dimension appear to reflect the relative level of capability among the dimensions.
2.1 Synergies among Dimensions of Capability
One of the most important findings of the SHRP 2 research, clearly validated in the workshops, was the apparent interdependence among process and institutional dimensions, as suggested in Figure 2.2.
Figure 2.2 Graph. Synergy among Dimensions of Capability
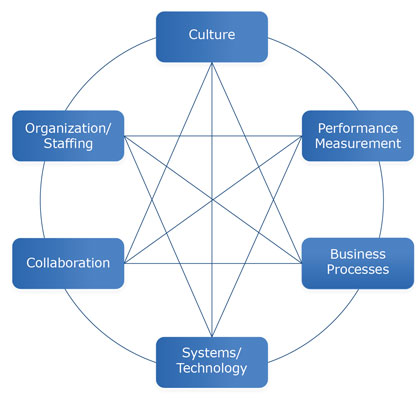
(Source: Cambridge Systematics, Inc. and Parsons Brinckerhoff.)
The dimensions of capability appear to be highly interdependent, such that it is difficult to improve a current level of capability in one dimension without simultaneously improving other dimensions that support it. This is reflected by the narrow spread in capabilities found among all workshops. As examples, workshop participants noted that strategic planning is hampered by lack of performance data; business processes were hampered by lack of staff capabilities; and reorganization was impossible without top management buy-in to the culture of TSM&O.
The wide variety of improvement actions identified by workshop participants across the six dimensions – including plans, processes, agreements, business cases, and organizational and staffing recommendations – reflect that each has a mutually reinforcing effect on overall capability. This synergy among the dimensions appears to represent a major management challenge to agencies desiring to improve TSM&O effectiveness, as it indicates that the required actions are likely to involve several agency units, including several necessarily involving top management.