Interstate 75 Stated Preference Survey
| |||||||||||||||||||||||||||||||||||||||||||||||||||||||||||||||||||||||||||||||||||||||||||||||||||||||||||||||||||||||||||||||||||||||||||||||||||||||||||||||||||||||||||||||||||||||||||||||||||||||||||||||||||||||||||||||||||||||||||||||||||||||||||||||||||||||||||||||||||||||||||||||||||||||||||||||||||||||||||||||||||||||||||||||||||||||||||||||||||||||||||||||||||||||||||||||||||||||||||||||||||||||||||||||||||||||||||||||||||||||||||||||||||||||||||||||||||||||||||||||||||||||||||||||||||||||||||||||||||||||||||||||||||||||||||||||||||||||||||||||||||||||||||||||||||||||||||||||||||||||||||||||||||||||||||||||||||||||||||||||||||||||||||||||||||||||||||||||||||||||||||||||||||||||||||||||||||||||||||||||||||||||||||||||||||||||||||||||||||||||||||||||||||||||||||||||||||||||||||||||||||||||||||||||||||||||||||||||||||||||||||||||||||||||||||||||||||||||||||||||||||||||||||||||||||||||||||||||||||||||||||||||||||||||||||||||||||||||||||||||||||||||||||||||||||||||||||||||||||||||
| Label | Count | % |
|---|---|---|
| Answering Machine | 2,065 | 16% |
| Busy | 179 | 1% |
| Complete | 1,501 | 12% |
| Disconnect | 1,669 | 13% |
| Business/Government | 509 | 4% |
| Language Barrier/Deaf | 269 | 2% |
| Fax/Modem | 686 | 5% |
| Caller ID | 2 | 0% |
| Not Qualified | 2,019 | 16% |
| Over Quota | 21 | 0% |
| Specific Callback, Respondent | 12 | 0% |
| General Callback, Household | 222 | 2% |
| No Answer | 873 | 7% |
| Partial Complete | 2 | 0% |
| 1st Refusal | 1,226 | 10% |
| Hang Up | 1,179 | 9% |
| Hard, Final Refusal | 234 | 2% |
| Hard Refusal (Conversion Attempt) | 24 | 0% |
| Total | 12,692 | 100% |
| All Sample | ||
| Sample Pieces Used | 12,692 | |
| Completed Surveys | 1,501 | 12% |
| HHlds eligible for participation | 1,761 | |
| Ineligible sample | 5,175 | 41% |
| Sample still working | 5,756 | |
| Ratio of good to bad sample | 25.39% | |
| Expected eligible sample to come | 1,461 | |
| Official Response Rate | 46.58% | |
| Refusal Rate | 14.65% | |
| Ratio of CM to Eligible | 85.24% | |
| Average Interview Length | 12.90 | Minutes |
Stated preference questions were used to measure respondents’ likelihood of using the HOT lanes as a function of the toll level and time savings. The questions were asked of 1,089 respondents whose reference trip was made as a SOV driver on I-75/575. The introduction and wording of the questions is shown below.
Now assume you’re making a future trip on I-75 just like the one that you just told me about. It’s a trip on the same day, at the same time of day, for the same purpose, and you’re under the same time pressures. You are traveling on the segment of I-75 between I-285 and I-575 and have the option of using the new carpool lane if you want to.
Order A: If you were to use the general traffic lanes on this segment of I-75, your trip would take TT+[#] and be free. If you used the new carpool lane as a single driver you would pay [$] and your trip would take TT, saving [#] minutes. You could also choose to carpool with someone and use the lane for free. Now under these conditions, would you choose to:
| Use the carpool lane, pay [$] and save [#] minutes | 1 |
| Use the general lane for free | 2 |
| Carpool with someone to use the carpool lane for free | 3 |
| DK | 98 |
Order B: If you were to use the carpool lane on this segment of I-75 as a single driver, you would pay [$] and your trip would take TT. If you were to use the general traffic lanes, your trip would take TT+[#], [#] minutes longer than in the toll lane, but it would be free. You could also choose to carpool with someone to use the carpool lane for free. Now under these conditions, would you choose to:
| Use the general lane for free | 2 |
| Use the carpool lane, pay [$] and save [#] minutes | 1 |
| Carpool with someone to use the carpool lane for free | 3 |
| DK | 98 |
Each person received 4 different scenarios of this type, each with a different amount of time savings (# = 5, 10, 15 or 20 minutes) and toll ($ = 50 cents, $1, $2, $3, $4, $5, $6 or $7). The value TT used for the tolled lane was based on the respondent’s estimate of their travel time with no congestion. Nine different sets of 4 scenarios were used across the sample, with each respondent assigned 1 of the 9 sets at random. So, in total, 36 (9 x 4) different scenarios were used, each identifying a different time/cost tradeoff point.
To avoid bias due to ordering effects, the questions were asked in two different ways. Versions Order A and Order B above differ only in the order in which the toll and non-toll options are described to the respondent. Each respondent was randomly assigned one of the two orders for all SP questions.
In the cases where respondents chose option 3, Carpool, they were asked to imagine that it would not have been possible for them to carpool for that trip, and to choose from one of the two remaining options, 1 or 2.
Next, the same type question was asked again, but this time using the “price meter” approach. Each respondent was assigned a level of time savings (S = 5, 10 or 15 minutes) at random. Then a random toll price point was chosen (P = 50 cents, $1, $2, $3, $4, $5, $6 or $7) and the same question from above was asked (Order A or Order B). If the person said that they would pay the toll, a higher price point was chosen at random, and if they said they would not pay the toll, a lower price point was chosen at random, and the question was asked again at the new toll level. This procedure was continued until the “switching point” was identified – e.g. the respondent would be willing to pay a toll of $2, but not willing to pay the next higher level, $3.
Note that this method is designed to obtain the same type of information as from a “transfer price” question which would ask each respondent directly how much they would be willing to pay for the given time savings. There are, however, drawbacks to the transfer price approach, in that respondents tend to find it much more difficult to answer such a direct question than to provide simpler yes or no type answers to specific time and toll combinations. So, we designed Method B to approximate the type of information that would be obtained from a transfer price question, but using simple pairwise choices with EXACTLY the same questionnaire wording as used in Method A. So, to the respondent, the Method B questions were simply a continuation of the Method A questions, and thus not likely to be answered in any significantly different way, and thus not much more prone to policy bias than the Method A responses.
Figure 1. Percent Willing to Pay Toll
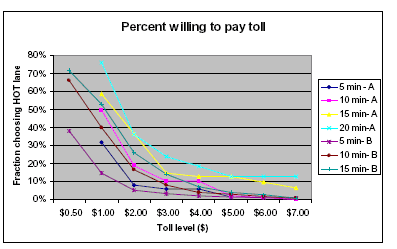
Figure 1 shows the percent of respondents who said they would pay the toll and use the HOT lane under each different level of time savings and toll. The Method A questions identify 22 different time/cost trading points, while the Method B questions represent 24 different time/cost trading points. Thus, both methods provide roughly the same amount of tradeoff information.
In Figure 1, there are 7 lines, 4 from Method A at 5, 10, 15 and 20-minute time savings, and 3 from Method B (the “price meter” approach) at 5, 10 and 15 minute time savings. The results appear to be consistent and reasonable. Some key findings are described below.
The two methods give consistent results. The lines for 5, 10 and 15 minutes for Method A track the corresponding lines from Method B quite well. The price meter (Method B) approach gives somewhat smoother curves and lower values.
Even at a very low toll level (50 cents) not everyone is willing to pay it. Only about 40% would pay that much for a 5-minute savings, while about 65% would pay it to save 10 minutes and 75% would pay it to save 15 minutes.
Even at fairly high toll levels above $3, a small fraction would be willing to pay for any level of time savings. This result supports the typical finding that there is a wide distribution of willingness to pay in the population.
The analysis in Figure 1 excludes the choice to switch to carpool to use the HOT lane. Overall, about 6% of respondents said they would shift to carpool, with no clear effect of toll level or time savings on that choice. It is not possible to say how realistic this level of shift is, as many carpools tend to be opportunity-driven, depending on whether another person happens to have a very similar destination and departure time.
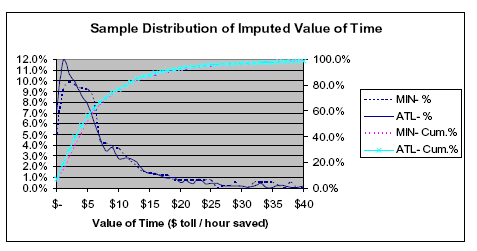
With the price meter approach (Method B), we can infer each respondent’s value of time savings (VOT) within a fairly narrow range. The results of that analysis are plotted below, and compared to the distribution from a similar HOT lane survey carried out in Minneapolis (ATL vs. MIN). The distribution function is skewed to the left with a substantial tail to the right, resembling the log-normal distribution, which is typically found for VOT. The distribution has a mode of about $1/hour, a median of about $4.75/hour, and a mean value of about $7.50/hour, slightly lower than the distribution estimated in Minneapolis. The cumulative distribution reaches the 90% point at about $18/hour, meaning that there are 10% of respondents willing to pay more than 3 times the median amount. Less than 1% of respondents are “off the chart,” willing to pay more than $40/hour.
Figure 2. Distribution of Imputed Value of Time
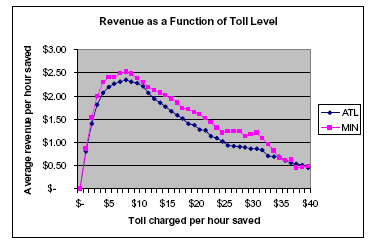
From the willingness to pay distribution above, we can obtain an estimate of the toll revenue at various toll levels, when the toll is expressed in terms of cost per time saved. The resulting curve below gives maximum revenue at a toll of about $7.50 per hour saved. This is the same result as was obtained for Minneapolis, although the revenue is slightly lower for the I-75. If the speed in the general lane were 30 mph, and the speed in the HOT lane were 60 mph, then traveling 1 mile would take 2 minutes in the general lane and 1 minute in the HOT lane, meaning the HOT lane provides a savings of 1 minute per mile. The revenue-maximizing toll would thus be $7.50/60, or 12.5 cents per mile. If, on the other hand, the speed in the general lane were 40 mph, then the HOT lane would only save 0.5 minutes per mile, so the revenue-maximizing toll would only be $7.50/120, or 6.25 cents/mile.
Figure 3. Revenue as a Function of Toll Level
To help get an idea what factors cause such a wide distribution in willingness to pay, we analyzed the variation in the average willingness to pay across various market segmentations, using the individual-level values of willingness to pay from Method B. While these results are not very useful for predictive analysis, which is best done based on Logit analysis with the combined responses from both Methods A and B, this simple analysis is useful for understanding the market in terms of what factors have the most influence on willingness to pay, in addition to the standard factors that are usually distinguished in travel models (trip purpose and time of day). The results are explained on the following pages. First, some factors that do NOT appear to have a significant effect on willingness to pay include:
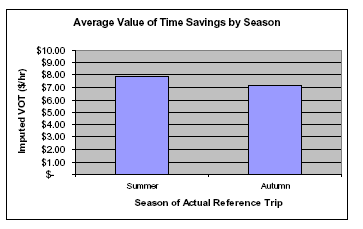
Roughly half of the respondents were surveyed in the summer period of July 14-August 14, while the other half were surveyed during the autumn season of August 15-September 3. Although these two periods are adjoining, a significant difference was found in the willingness to pay, with the average VOT about 10% lower in the latter period ($7.15/hour versus $7.85/hour). This is why the overall average figures reported in this analysis are slightly lower than those reported in the interim analysis done on the summer data only.
Three possible reasons for the somewhat lower values for the autumn period are:
Figure 4. Average Value of Time Savings by Season
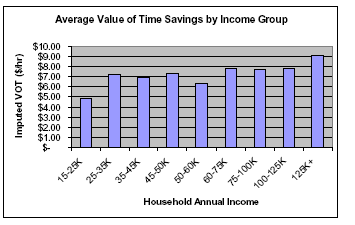
As is typically found, willingness to pay is clearly related to income, but does not increase proportionally with income. This result indicates that other factors besides income also enter into the decision of whether or not to pay the toll.
Figure 5. Average Value of Time Savings by Income Group
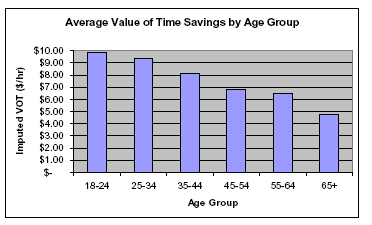
Age is also important, with willingness to pay generally decreasing with age, particularly for individuals of retirement age. This probably indicates less hectic schedules once people pass a certain age. The reason for the high willingness to pay for those under 25 is not clear. These tend to be students, who may be reimbursed by their parents.
Figure 6. Average Value of Time Savings by Age
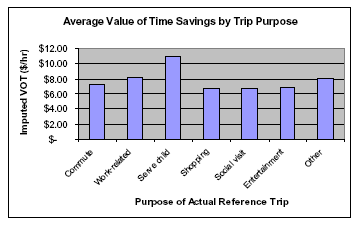
Willingness to pay is lowest for shopping, social visit, and entertainment trips and highest for those picking up or dropping off children (only 7 respondents had this trip purpose, however). The average values for other purposes are near the overall average of $7.50/hr.
Figure 7. Average Value of Time Savings by Trip Purpose
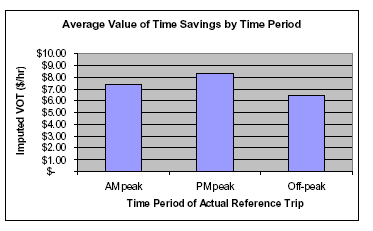
The average value of time savings is highest for those making PM peak trips and lowest for those making off-peak trips. The variation is not as substantial as one might expect, because we offered the same levels of time savings to all respondents. In actual situations where much greater time savings are possible during the peak, the toll that people would be willing to pay would be correspondingly higher.
Figure 8. Average Value of Time Savings by Time Period
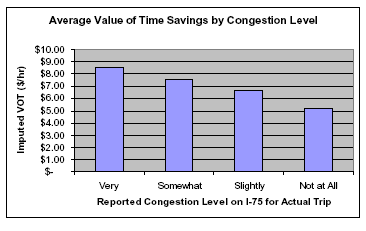
We do find quite large variation in willingness to pay according to the reported perceived congestion level for the actual trip. It is interesting that this variation is much larger than the peak/off-peak variation in the preceding chart. Two possible explanations for this are (a) there may be a good deal of congestion at off-peak times and congestion levels may be related to geography as well as time of day, and (b) those who are more time-sensitive and willing to pay higher tolls may also notice congestion levels more and have a lower threshold for what they perceive as “congested.”
Figure 9. Average Value of Time Savings by Congestion Level
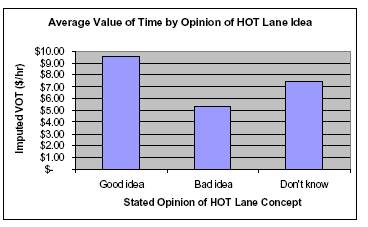
It is interesting that the average willingness to pay for those who think the HOT lanes is a good idea is almost twice as high as for those who think it is a bad idea. This result is reasonable, since people who are willing to pay for faster travel will receive more benefit from the introduction of HOT lanes than those who are not (who would still receive some travel time benefit, but not as much).
Figure 10. Average Value of Time by Opinion of HOT Lane Idea
There were three different time savings levels used for the “price meter” SP questions. The graph below shows that the willingness to pay does not rise linearly with the amount of time savings. In other words, it appears that respondents are willing to spend marginally less for each additional minute saved. The average VOT for a savings of 5 minutes is $9.00/hour, meaning that the average person would spend 75 cents to save 5 minutes. The average VOT for a savings of 10 minutes is $7.50, meaning that the average person would spend $1.25 to save 10 minutes, or 50 cents for the second 5 minutes. The average VOT for a savings of 15 minutes is about $6.40, meaning that the average person would spend $1.60 to save 15 minutes, or 35 cents for the last 5 minutes.
Figure 11. Average Value of Time by Amount of Time Saved
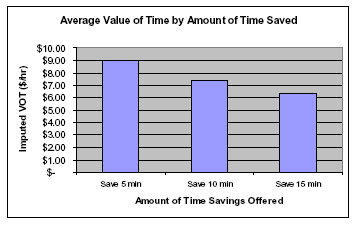
Table 2. VOT and Value of Savings
| Time Savings | VOT | Value of Savings | Marginal VOT for Added Minutes |
|---|---|---|---|
| 5 minutes | $9.00 / hr | $0.75 / 5 min | $0.75 / 5 min. = $9.00 / hr |
| 10 minutes | $7.50 / hr | $1.25 / 10 min. | $0.50 / 5 min = $6.00 / hr |
| 15 minutes | $6.40 / hr | $1.60 / 15 min. | $0.35 / 5 min = $4.20 / hr |
Finally, all of the variables listed above were included simultaneously in a regression analysis, regressing each respondent’s imputed Value of Time savings from the “Price Meter” responses against a series of 0/1 dummy variables. Most of the effects discussed above remain significant even when analyzed in combination with the other determinants of VOT. Note, however, that the difference between the summer and autumn seasons is not significant when analyzed together with the other variables, suggesting that the difference found between the seasons is due mainly to differences in the composition of the two sub-samples—random and otherwise.
Also note that the R-squared value for the disaggregate regression model is about 0.06, meaning that about 94% of the variance in individual-level willingness to pay cannot be explained by the exogenous explanatory variables. This is a typical and important result, because it means that simply segmenting VOT by trip purpose, time of day, or other observed variables is not adequate to capture the order of magnitude of variance that actually occurs. Models that do not account for such wide variation will tend to overpredict toll lane usage at low toll levels, and underpredict usage at high toll levels.
Table 3. Regression Model Summary
| VARIABLE | COEFFICIENT | T-STATISTIC |
|---|---|---|
| Constant | $ 6.92 | 7.52 |
| Time savings of 5 minutes | + $ 1.52 | 2.23 |
| Time savings of 15 minutes | - $ 1.12 | -1.67 |
| Very congested | + $ 1.23 | 2.04 |
| Not at all congested | - $ 1.54 | -1.49 |
| AM peak trip | + $ 0.29 | 0.35 |
| PM peak trip | + $ 1.21 | 1.48 |
| Commute trip | - $ 1.86 | -2.95 |
| Shopping/social/entertainment trip | - $ 1.72 | -1.72 |
| Age under 35 | + $ 3.08 | 4.06 |
| Age 35 to 44 | + $ 1.53 | 2.31 |
| Age 65 and older | - $ 1.33 | -0.98 |
| Income $15-25K | - $ 1.81 | -0.65 |
| Income $25-60K | - $ 0.97 | -1.34 |
| Income over $125K | + $ 1.66 | 2.38 |
| Season = autumn | - $ 0.33 | -0.60 |
| R-squared = 0.061 | ||
The following is a summary of the survey data. The following tables are based on processed and unweighted data.
Table 4. Data Collection Period
| CHOICE | CODE | FREQUENCY | PERCENT |
|---|---|---|---|
| Summer | 1 | 750 | 50.0 |
| Fall | 2 | 751 | 50.0 |
| Total | — | 1,501 | 100.0 |
Table 5. How Do You Usually Travel on I-75?
| CHOICE | CODE | FREQUENCY | PERCENT |
|---|---|---|---|
| Drive alone | 1 | 1,182 | 78.7 |
| Drive with other passengers | 2 | 266 | 17.7 |
| Ride as a passenger in a personal vehicle | 3 | 44 | 2.9 |
| Ride as a passenger in a vanpool | 4 | 3 | 0.2 |
| Ride as a passenger in a bus | 5 | 6 | 0.4 |
| Total | — | 1,501 | 100.0 |
Table 6. Houshold Vehicles
| CHOICE | CODE | FREQUENCY | PERCENT |
|---|---|---|---|
| Zero | 0 | 0 | 0.0 |
| One | 1 | 216 | 14.4 |
| Two | 2 | 788 | 52.5 |
| Three | 3 | 312 | 20.8 |
| Four or More | 4 | 185 | 12.3 |
| Total | — | 1,501 | 100.0 |
Table 7. Household Size
| CHOICE | CODE | FREQUENCY | PERCENT |
|---|---|---|---|
| One | 1 | 194 | 12.9 |
| Two | 2 | 542 | 36.1 |
| Three | 3 | 288 | 19.2 |
| Four or More | 4 | 477 | 31.8 |
| Total | — | 1,501 | 100.0 |
Table 8. Perceived Congestion in Atlanta
| CHOICE | CODE | FREQUENCY | PERCENT |
|---|---|---|---|
| Major problem | 1 | 1,093 | 72.8 |
| Moderate problem | 2 | 298 | 19.9 |
| Minor problem | 3 | 69 | 4.6 |
| No problem at all | 4 | 477 | 31.8 |
| Don't know | 8 | 4 | 0.3 |
| Total | — | 1,501 | 100.0 |
Table 9. Awareness of Managed Lane Construction on I-75
| CHOICE | CODE | FREQUENCY | PERCENT |
|---|---|---|---|
| Yes | 1 | 679 | 45.2 |
| No | 2 | 822 | 54.8 |
| Total | — | 1,501 | 100.0 |
Table 10. What Have You Heard Regarding Construction of I-75 Managed Lanes
| CHOICE | CODE | FREQUENCY | PERCENT |
|---|---|---|---|
| Toll road/lane was going to be built | 2 | 148 | 21.8 |
| HOV lane was going to be built | 3 | 286 | 42.1 |
| Committee was considering a change | 4 | 107 | 15.8 |
| Read information about a toll road/lane | 5 | 72 | 10.6 |
| Decision to build toll road/lane has been made | 6 | 50 | 7.4 |
| Other | 1 | 16 | 2.4 |
| Total | — | 679 | 100.0 |
Table 11. Thoughts on Managed (HOT) Lanes
| CHOICE | CODE | FREQUENCY | PERCENT |
|---|---|---|---|
| Good idea | 1 | 698 | 46.5 |
| Bad idea | 2 | 706 | 47.0 |
| Don't know | 8 | 97 | 6.5 |
| Total | — | 1,501 | 100.0 |
Table 12. Why Do You Feel This Way (Regarding HOT Lanes)?
| CHOICE | CODE | FREQUENCY | PERCENT |
|---|---|---|---|
| Defeats the purpose | 2 | 199 | 14.2 |
| Only people in carpool lanes should be rewarded | 3 | 78 | 5.6 |
| Don't think it's fair | 4 | 60 | 4.3 |
| Will not help because it will be the same amount of cars | 5 | 173 | 12.3 |
| Will help reduce the flow of traffic | 6 | 216 | 15.4 |
| Gives people a better option to shorten trip | 7 | 372 | 26.5 |
| The state can raise more money | 8 | 88 | 6.3 |
| Oppose tolls/already taxed/no direct answer | 9 | 98 | 7.0 |
| Other | 1 | 120 | 8.5 |
| Total | — | 1,404 | 100.0 |
Table 13. Thoughts on Variable Pricing
| CHOICE | CODE | FREQUENCY | PERCENT |
|---|---|---|---|
| Good idea | 1 | 463 | 30.8 |
| Bad idea | 2 | 914 | 60.9 |
| Don't know | 8 | 124 | 8.3 |
| Total | — | 1,501 | 100.0 |
Table 13. Thoughts on Variable Pricing
| CHOICE | CODE | FREQUENCY | PERCENT |
|---|---|---|---|
| Good idea | 1 | 463 | 30.8 |
| Bad idea | 2 | 914 | 60.9 |
| Don't know | 8 | 124 | 8.3 |
| Total | — | 1,501 | 100.0 |
Table 14. Why Do You Feel This Way (Regarding Variable Pricing)?
| CHOICE | CODE | FREQUENCY | PERCENT |
|---|---|---|---|
| Tolls should be a flat fee/need to anticipate cost | 2 | 485 | 35.2 |
| Should not charge too much when traffic is light | 3 | 88 | 6.4 |
| May create more traffic on those lanes | 4 | 82 | 6.0 |
| Will help bring in more money | 5 | 37 | 2.7 |
| Gives a good option to either carpool or pay toll | 6 | 168 | 12.2 |
| Can help reduce the flow of traffic | 7 | 101 | 7.3 |
| Oppose tolls/already taxed/no direct answer | 9 | 97 | 7.0 |
| Other | 1 | 319 | 23.2 |
| Total | — | 1,377 | 100.0 |
Table 15. Thoughts on Hours of Operation
| CHOICE | CODE | FREQUENCY | PERCENT |
|---|---|---|---|
| Good idea | 1 | 850 | 56.6 |
| Bad idea | 2 | 546 | 36.4 |
| Don't know | 8 | 105 | 7.0 |
| Total | — | 1,501 | 100.0 |
Table 16. Why Do You Feel This Way (Regarding Hours of Operation)?
| CHOICE | CODE | FREQUENCY | PERCENT |
|---|---|---|---|
| Only needs to be at certain hours of the day | 2 | 254 | 18.2 |
| Could cause lane to be congested | 3 | 47 | 3.4 |
| More efficient that way/help with congestion | 4 | 293 | 21.0 |
| Good option to have/flexibility | 5 | 466 | 33.4 |
| Oppose tolls/already taxed/no direct answer | 9 | 94 | 6.7 |
| Other | 1 | 242 | 17.3 |
| Total | — | 1,396 | 100.0 |
Table 17. Influences Regarding Use of Managed Lanes
| CHOICE | CODE | FREQUENCY | PERCENT |
|---|---|---|---|
| Reduce your overall travel time | 1 | 621 | 41.4 |
| Reduce the amount of time you spend in heavy traffic | 2 | 383 | 25.5 |
| Increase the predictability of your arrival time | 3 | 231 | 15.4 |
| Increase personal safety while driving in traffic | 4 | 64 | 4.3 |
| Price of the toll | 5 | 43 | 2.9 |
| Some other reason? Specify | 7 | 159 | 10.6 |
| Total | — | 1,501 | 100.0 |
Table 18. Day of Reference Trip
| CHOICE | CODE | FREQUENCY | PERCENT |
|---|---|---|---|
| Monday | 1 | 206 | 13.7 |
| Tuesday | 2 | 232 | 15.5 |
| Wednesday | 3 | 262 | 17.5 |
| Thursday | 4 | 280 | 18.7 |
| Friday | 5 | 362 | 24.1 |
| Saturday | 6 | 94 | 6.3 |
| Sunday | 7 | 65 | 4.3 |
| Total | — | 1,501 | 100.0 |
Table 19. Time of Day of Reference Trip
| CHOICE | CODE | FREQUENCY | PERCENT |
|---|---|---|---|
| AM Peak (6–10) | 1 | 548 | 36.5 |
| PM Peak (3–7) | 2 | 540 | 36.0 |
| Non-Peak | 3 | 413 | 27.5 |
| Total | — | 1,501 | 100.0 |
Table 20. Did You Leave at this Particular Time to Avoid Traffic Congestion?
| CHOICE | CODE | FREQUENCY | PERCENT |
|---|---|---|---|
| Yes | 1 | 546 | 36.4 |
| No | 2 | 953 | 63.5 |
| Don't know | 8 | 2 | 0.1 |
| Total | — | 1,501 | 100.0 |
Table 21. What Time Would You Have Preferred to Leave if No Traffic Congestion?
| CHOICE | FREQUENCY | PERCENT |
|---|---|---|
| 0300-0359 | 2 | 0.4 |
| 0400-0459 | 2 | 0.4 |
| 0500-0559 | 6 | 1.1 |
| 0600-0659 | 40 | 7.6 |
| 0700-0759 | 124 | 23.5 |
| 0800-0859 | 110 | 20.9 |
| 0900-0959 | 53 | 10.1 |
| 1000-1059 | 10 | 1.9 |
| 1100-1159 | 5 | 0.9 |
| 1200-1259 | 5 | 0.9 |
| 1300-1359 | 8 | 1.5 |
| 1400-1459 | 11 | 2.1 |
| 1500-1559 | 19 | 3.6 |
| 1600-1659 | 50 | 9.5 |
| 1700-1759 | 60 | 11.4 |
| 1800-1859 | 16 | 3.0 |
| 1900-1959 | 2 | 0.4 |
| 2000-2059 | 2 | 0.4 |
| 2100-2159 | 1 | 0.2 |
| 2200-2259 | 1 | 0.2 |
| Total | 527 | 100.0 |
Table 22. North or Southbound Travel
| CHOICE | CODE | FREQUENCY | PERCENT |
|---|---|---|---|
| North | 1 | 639 | 42.6 |
| South | 2 | 862 | 57.4 |
| Total | — | 1,501 | 100.0 |
Table 23. Trip Purpose
| CHOICE | CODE | FREQUENCY | PERCENT |
|---|---|---|---|
| Commute to or from work or school | 1 | 650 | 43.3 |
| Work-related | 2 | 315 | 21.0 |
| Drop off/pick up school age child | 3 | 22 | 1.5 |
| Shop | 4 | 57 | 3.8 |
| Visit friends or family | 5 | 93 | 6.2 |
| Recreational or entertainment activity | 6 | 138 | 9.2 |
| Something else | 7 | 226 | 15.1 |
| Total | — | 1,501 | 100.0 |
Table 24. Time Respondent Had to be at Destination
| CHOICE | CODE | FREQUENCY | PERCENT |
|---|---|---|---|
| Specific time plus or minus 10 minutes | 1 | 396 | 40.1 |
| Specific time plus or minus 30 minutes | 2 | 110 | 11.1 |
| Had more flexibility in the arrival time than that | 3 | 481 | 48.7 |
| Total | — | 987 | 100.0 |
Table 25. Trip Start
| CHOICE | CODE | FREQUENCY | PERCENT |
|---|---|---|---|
| Home | 1 | 923 | 61.5 |
| Work | 2 | 376 | 25.0 |
| Other, Specify Place Name | 7 | 202 | 13.5 |
| Total | — | 1,501 | 100.0 |
Table 26. Trip End
| CHOICE | CODE | FREQUENCY | PERCENT |
|---|---|---|---|
| Home | 1 | 416 | 27.7 |
| Work | 2 | 404 | 26.9 |
| Other, Specify Place Name | 7 | 681 | 45.4 |
| Total | — | 1,501 | 100.0 |
Table 27. Arrival Time at End Location
| CHOICE | CODE | FREQUENCY | PERCENT |
|---|---|---|---|
| AM Peak (7–10) | 1 | 421 | 28.0 |
| PM Peak (3–7) | 2 | 572 | 38.1 |
| Non-Peak | 3 | 508 | 33.8 |
| Total | — | 1,501 | 100.0 |
Table 28. Mode of Travel
| CHOICE | CODE | FREQUENCY | PERCENT |
|---|---|---|---|
| Driving alone | 1 | 1,089 | 72.6 |
| Driving with other passengers | 2 | 355 | 23.7 |
| Riding as a passenger in a personal vehicle | 3 | 501 | 3.4 |
| Riding as a passenger in a vanpool | 4 | 2 | 0.1 |
| Riding as a passenger in a bus | 5 | 4 | 0.3 |
| Total | — | 1,501 | 100.0 |
Table 29. Reference Trip Mode
| CHOICE | CODE | FREQUENCY | PERCENT |
|---|---|---|---|
| SOV | 1 | 1,089 | 72.6 |
| HOV | 2 | 406 | 27.0 |
| Vanpool | 3 | 2 | 0.1 |
| Transit | 4 | 4 | 0.3 |
| Total | — | 1,501 | 100.0 |
Table 30. Number of Adults on Trip
| CHOICE | CODE | FREQUENCY | PERCENT |
|---|---|---|---|
| One | 1 | 71 | 17.5 |
| Two | 2 | 274 | 67.5 |
| Three | 3 | 40 | 9.9 |
| Four | 4 | 16 | 3.9 |
| Five | 5 | 3 | 0.7 |
| Six | 6 | 1 | 0.2 |
| Seven | 7 | 0 | 0 |
| Eight | 8 | 1 | 0.2 |
| Total | — | 406 | 100.0 |
Table 31. Number of Children on Trip
| CHOICE | CODE | FREQUENCY | PERCENT |
|---|---|---|---|
| None | 0 | 287 | 70.7 |
| One | 1 | 60 | 14.8 |
| Two | 2 | 38 | 9.4 |
| Three | 3 | 17 | 4.2 |
| Four | 4 | 3 | 0.7 |
| Five | 5 | 0 | 0 |
| Six | 6 | 1 | 0.2 |
| Total | — | 406 | 100.0 |
Table 32. Total Occupants
| CHOICE | CODE | FREQUENCY | PERCENT |
|---|---|---|---|
| One | 1 | 6 | 1.5 |
| Two | 2 | 264 | 65.0 |
| Three | 3 | 71 | 17.5 |
| Four | 4 | 46 | 11.3 |
| Five | 5 | 13 | 3.2 |
| Six | 6 | 4 | 1.0 |
| Seven | 7 | 0 | 0 |
| Eight | 8 | 1 | 0.2 |
| Nine | 9 | 1 | 0.2 |
| Total | — | 406 | 100.0 |
Table 33. Was Respondent Delayed by Congestion
| CHOICE | CODE | FREQUENCY | PERCENT |
|---|---|---|---|
| Yes | 1 | 877 | 58.4 |
| No | 2 | 624 | 41.6 |
| Total | — | 406 | 100.0 |
Table 34. Was Respondent Delayed by Congestion
| CHOICE | FREQUENCY | PERCENT |
|---|---|---|
| 0-5 | 2 | 0.2 |
| 6-10 | 17 | 1.9 |
| 11-15 | 61 | 6.9 |
| 16-20 | 105 | 11.8 |
| 21-25 | 89 | 10.0 |
| 26-30 | 185 | 20.9 |
| 31-35 | 75 | 8.5 |
| 36-40 | 102 | 11.5 |
| 41-45 | 114 | 12.9 |
| 46-50 | 24 | 2.7 |
| 51-55 | 3 | 0.3 |
| 56-60 | 49 | 5.5 |
| 60+ | 61 | 6.9 |
| Total | 887 | 100.0 |
Table 35. Did Respondent Make Stops on Trip
| CHOICE | CODE | FREQUENCY | PERCENT |
|---|---|---|---|
| Yes | 1 | 199 | 13.3 |
| No | 2 | 1,302 | 86.7 |
| Total | — | 1,501 | 100.0 |
Table 36. Type of Stop Made
| CHOICE | CODE | FREQUENCY | PERCENT |
|---|---|---|---|
| Pick up/ drop off kids at daycare | 1 | 10 | 5.0 |
| Pick up / drop off other people | 2 | 13 | 6.5 |
| Change your mode of travel, like catch of bus | 3 | 1 | 0.5 |
| Take care of personal business, like shopping | 4 | 147 | 73.9 |
| Work-related activity | 5 | 9 | 4.5 |
| Multiple stops for different purposes | 6 | 19 | 9.5 |
| Total | — | 199 | 100.0 |
Table 37. Number of Times Late to Pick Up Child at Daycare
| CHOICE | CODE | FREQUENCY | PERCENT |
|---|---|---|---|
| None | 1 | 7 | 70.0 |
| 1-5 | 2 | 1 | 10.0 |
| 6-9 | 3 | 0 | 0.0 |
| 10 or more times | 4 | 2 | 20.0 |
| Total | — | 10 | 100.0 |
Table 38. Satisfaction with the Overall Quality of Travel on I-75 Between I-285 and I-575
| CHOICE | CODE | FREQUENCY | PERCENT |
|---|---|---|---|
| Very satisfied | 1 | 359 | 23.9 |
| Slightly satisfied | 2 | 450 | 30.0 |
| Slightly unsatisfied | 3 | 320 | 21.3 |
| Very unsatisfied | 4 | 366 | 24.4 |
| Don't Know | 8 | 6 | 0.4 |
| Total | — | 1,501 | 100.0 |
Table 39. Level of Congestion on this Segment of I-75
| CHOICE | CODE | FREQUENCY | PERCENT |
|---|---|---|---|
| Very congested | 1 | 531 | 35.4 |
| Somewhat congested | 2 | 493 | 32.8 |
| Slightly congested | 3 | 310 | 20.7 |
| Or not congested at all | 4 | 167 | 11.1 |
| Total | — | 1,501 | 100.0 |
Table 40. Employment
| CHOICE | CODE | FREQUENCY | PERCENT |
|---|---|---|---|
| Self-employed | 1 | 259 | 17.3 |
| Employed full or part time | 2 | 999 | 66.6 |
| Student full or part time | 3 | 37 | 2.5 |
| Retired | 4 | 129 | 8.6 |
| Something else | 7 | 77 | 5.1 |
| Total | — | 1,501 | 100.0 |
Table 40. Total Education
| CHOICE | CODE | FREQUENCY | PERCENT |
|---|---|---|---|
| Grade School | 1 | 14 | 0.9 |
| GED or High School Graduate | 2 | 196 | 13.1 |
| Some college or vocational education | 3 | 342 | 22.8 |
| College Graduate | 4 | 677 | 45.1 |
| Graduate Degree | 5 | 269 | 17.9 |
| Refused | 9 | 3 | 0.2 |
| Total | — | 1,501 | 100.0 |
Table 41. Ethnicity
| CHOICE | CODE | FREQUENCY | PERCENT |
|---|---|---|---|
| White or Caucasian | 1 | 1,265 | 84.3 |
| Hispanic or Latino | 2 | 34 | 2.3 |
| African-American | 3 | 124 | 8.3 |
| Asian-American | 4 | 21 | 1.4 |
| Other | 7 | 37 | 2.5 |
| Refused | 9 | 20 | 1.3 |
| Total | — | 1,501 | 100.0 |
Table 42. Age
| CHOICE | CODE | FREQUENCY | PERCENT |
|---|---|---|---|
| 18 - 24 | 1 | 60 | 4.0 |
| 25 - 34 | 2 | 255 | 17.0 |
| 25 - 34 | 3 | 411 | 27.4 |
| 45 -54 | 4 | 385 | 25.6 |
| 55 - 64 | 5 | 261 | 17.4 |
| 65 or older | 6 | 115 | 7.7 |
| Refused | 9 | 14 | 0.9 |
| Total | — | 1,501 | 100.0 |
Table 44. Household Income
| CHOICE | CODE | FREQUENCY | PERCENT |
|---|---|---|---|
| $15,000 or less | 1 | 17 | 1.1 |
| $15,000 to $24,999 | 2 | 27 | 1.8 |
| $25,000 to $34,999 | 3 | 51 | 3.4 |
| $35,000 to $44,999 | 4 | 59 | 3.9 |
| $45,000 to $49,999 | 5 | 49 | 3.3 |
| $50,000 to $59,999 | 6 | 154 | 10.3 |
| $60,000 to $74,999 | 7 | 175 | 11.7 |
| $75,000 to $99,999 | 8 | 302 | 20.1 |
| $100,000 to $124,999 | 9 | 177 | 11.8 |
| Above $125,000 | 10 | 312 | 20.8 |
| Refused | 99 | 178 | 11.8 |
| Total | — | 1,501 | 100.0 |
Table 45. Follow Up Respondent
| CHOICE | CODE | FREQUENCY | PERCENT |
|---|---|---|---|
| Yes | 1 | 1,268 | 84.5 |
| No | 2 | 233 | 15.5 |
| Total | — | 1,501 | 100.0 |
Table 46. Preferred Mode for Follow Up
| CHOICE | CODE | FREQUENCY | PERCENT |
|---|---|---|---|
| Telephone | 1 | 720 | 56.8 |
| 2 | 190 | 15.0 | |
| 3 | 358 | 28.2 | |
| Total | — | 1,268 | 100.0 |
Table 47. Gender
| CHOICE | CODE | FREQUENCY | PERCENT |
|---|---|---|---|
| Male | 1 | 841 | 56.0 |
| Female | 2 | 660 | 44.0 |
| Total | — | 1,501 | 100.0 |
Table 48. County
| CHOICE | FIPS CODE | FREQUENCY | PERCENT |
|---|---|---|---|
| Bartow | 13015 | 26 | 1.7 |
| Cherokee | 13057 | 851 | 56.7 |
| Cobb | 13067 | 593 | 39.5 |
| Fulton | 13121 | 15 | 1.0 |
| Gordon | 13129 | 1 | 0.1 |
| Paulding | 13223 | 15 | 1.0 |
| Total | — | 1,501 | 100.0 |
1 Upon generating the unlisted sample, NuStats requested that MSG match the sample to their listed database and append address information for all matching records. As a result, the 75% of sample records with address information is a mixture of both listed and unlisted sample.
You may need the Adobe Acrobat Reader to view the PDFs on this page.
| US DOT Home | FHWA Home | Operations Home | Privacy Policy | ||