HOT Credit Lanes Feasibility StudyPrintable Version (PDF 553KB) CONTENTS:
Executive SummaryPurpose of the StudyThe Fast and Intertwined Regular (FAIR) lanes concept combines the use of pricing to manage road congestion while simultaneously addressing perceived equity issues that may arise from priced roads. One frequent criticism of the high-occupancy toll (HOT) lanes concept is that it may be inequitable to low-income users who are less able to afford tolls than higher-income users. Another concern is that the general public, regardless of income, may resist HOT lanes unless they receive some tangible benefit from them even when they do not use the HOT lanes. The basic concept of the FAIR lanes proposal, as described by Patrick DeCorla-Souza (2000) in the ITS Quarterly and subsequent articles (see articles in References dated 2000-2005), is to price previously unpriced lanes to improve freeway performance and to provide a remedy to the perceived equity issues. Those equity issues are associated with the “take away” of a previously free lane and with the concern about low-income users. A FAIR lanes scheme would provide eligible users of the general purpose (GP) lanes with a “credit” each time they use the GP lane during peak periods. This credit would be redeemable toward paying their toll on the HOT lane or, potentially, other transportation services. All high-occupancy vehicles (HOV) -- carpools, vanpools and buses -- would be able to use the HOT lanes without paying a toll under all circumstances. FAIR lanes are an innovative and untested concept. This study, which is undertaken in cooperation with the Federal Highway Administration (FHWA), was designed to test this particular equity concept on actual freeway corridors. Due to political feasibility concerns and the physical characteristics of the corridors (especially the fact that neither freeway segment has convenient, parallel free routes), a modified version of the FAIR lanes concept is applied in this study. This version is termed “High-Occupancy Toll/Credit (HOT/C) lanes in this study to distinguish it from the original FAIR lanes concept. The study applies the HOT/C lanes proposal to two specific freeway segments in Alameda and Santa Clara counties in California: Interstate 580 (I-580) and Interstate 680 (I-680).
These corridors were selected because they are under active consideration for HOT lane implementation, and planning and funding for the I-680 HOT lane is already well advanced. This study analyzes key aspects of the HOT/C lanes concept including: toll revenues, impact on vehicle volumes and speeds, travel forecasting, freeway operations, and public opinion. Alternatives AnalyzedThe study reviews and compares a number of alternatives, with a focus on variable tolling scenarios. The major variables that define alternatives are: (1) crediting rate, i.e., the rate at which eligible users earn a “free” trip on the HOT lane: (2) eligibility for HOT/C lanes credits, namely the low-income only vs. all users eligibility criteria; and (3) different carpool-definition policies, namely 2-person or more (2+) vs. 3-person or more (3+) definitions of an eligible carpool. Those alternatives in which only low-income persons (defined by the U.S. government’s poverty index) are eligible for HOT/C credits are termed “Limited Eligibility” in this report. Those alternatives in which all users are eligible are termed “100 Percent Eligibility.” Both of the corridors selected for this study are characterized by a relatively affluent population, and the number of low-income users is relatively small (six percent on the I-680 and ten percent on the I-580). Although both Limited Eligibility and 100 Percent Eligibility scenarios are modeled, the study focuses more detailed analysis on Limited Eligibility, for two reasons: (1) the low-income focus addresses more directly the income equity issue, which is the most frequently raised and politically resonant “fairness” issue; and (2) the project team made a considered judgment, with concurrence from the study task force, that the 100 Percent Eligibility has no plausible chance of being enacted by policy-makers in the political and economic context of the Bay Area region, particularly due to the fact that there are no parallel roadway facilities available. A simple low-income toll discount alternative (i.e., low-income users would pay a lower toll than other users, but there would be no crediting for their use of GP lanes) was briefly considered but discarded, because this alternative was deemed to be clearly outside the scope of the HOT/C lanes concept as defined. Nevertheless, such an alternative may be considered at a later date as a different way to address the income equity issue. The 14 policy scenarios that met the specific purposes of the study and the screening criteria and are comparable include: Conventional HOV Alternatives
Scenarios A and B provide a base case of a conventional HOV lane for which there is no tolling and therefore no economic equity issue arising from tolling. It provides a point of comparison for measures such as vehicle speeds and volumes. It provides no revenues. Limited Eligibility HOT/C Alternatives (low-income only)
Scenarios C through F examine the impacts of the Limited Eligibility HOT/C lanes policy. They compare widely varying crediting rates. They also test the impact of 2+ and 3+ carpool policies. These scenarios are the most relevant to the concept of “fairness” as defined by providing a special benefit to low-income corridor users. 100 Percent Eligibility HOT/C Alternatives (all users eligible, regardless of income)
Scenarios G through L examine the impact of providing a credit to all GP lane users who have a transponder. In order to assure free-flow conditions on the HOT lane while crediting all users of the GP lanes, the crediting rates need to be very low, so the credit may be viewed by users as almost negligible. Conventional HOT Lane Alternatives
Scenarios M and N are “pure” HOT lanes and also provide a basis for comparison with the HOT/C lanes scenarios. They provide a “zero credit” to GP lane users of any income and represent the conventional HOT lane. They are useful alternatives in terms of comparing revenue generation as well as traffic conditions. Ingress/egress to the HOT lanes on the I-580 and I-680 corridors would be limited to certain locations, at the beginning and end of the HOT lane and at several intermediate access locations along the corridor. Access locations were dictated by factors such as traffic demand, distance from key interchanges, and operational and safety considerations. Public Opinion and AcceptanceIn order to assess public and stakeholder attitudes towards both the HOT/C lanes concept and value-priced lanes, the study team conducted focus groups with frequent users of I-580 and I-680. In addition, a public opinion survey of residents in Alameda County and the surrounding communities was also conducted. Findings from both the focus group research and the public opinion survey suggest that the single most important factor determining support or opposition to HOT lanes is the context in which they are presented to the public. When presented as a toll lane, designed to manage congestion, give commuters choices and fully utilize carpool lanes, respondents were generally skeptical. When presented as a carpool lane with a revenue enhancing element designed to deliver desirable transportation improvements, most notably completing carpool lanes and expanding express bus service, residents strongly support the idea. Once a desirable context is set, residents were much more likely to accept and embrace the other beneficial outcomes of the project (e.g., more choices, congestion relief and full utilization of the carpool lane). The public opinion research in this study strongly suggests that concerns about income equity are not a major determinative factor in public acceptance of HOT lanes. To the degree that fairness is an issue at all, it is defined as a concern that the wealthy would be able to buy their way out of traffic rather than that the poor would not be able to buy their way into the lane. For the average resident, allowing poor residents into the lanes for a discount only makes the plan less equitable, as it appears that exceptions are being made for everyone but them. Most importantly, the research suggests that most residents are willing to accept that not everyone will be able to access the HOT lanes, if the outcome is a better transportation system for all. CostThe total estimated incremental capital cost to implement HOT/C lanes on I-680 is $1,177,500, and the estimated incremental annual Operations & Maintenance (O&M) cost is $155,340. The total estimated incremental capital cost to implement HOT/C lanes on I-580 is $1,603,125, and the estimated incremental annual O&M cost is $189,125. Capital and O&M costs for both corridors are estimated on the basis of Limited Eligibility alternatives; capital costs for both corridors include a 25 percent contingency factor. The I-580 capital costs are higher, because I-580 will have four GP lanes in each direction (requiring more antennas, readers and structure for reading transponders in the GP lanes), while there are three GP lanes on I-680. The I-580 O&M costs are higher than I-680, due to maintenance of more equipment and a somewhat higher number of transactions. The total capital cost for implementing Limited Eligibility HOT/C Lanes for both I-580 and I-680 corridors combined is $2,630,625. The total annual O&M cost for both corridors combined is $345,194. (Note: the HOT facilities on both corridors are assumed to be in place for this estimate). HOT/C Policy Modeling ResultsThe economic and performance impacts of various HOT/C Lane policy scenarios are analyzed in terms of revenue generated and several traffic measures, such as vehicle speeds and volumes. The key findings are:
Revenue EstimatesEven under the most conservative assumptions, HOT lane tolling generates significant revenues over a 20-year period. The results, however, reveal the great sensitivity of revenues to both HOT/C and carpool policy. HOT lane revenues are produced most prolifically when there is substantial HOT lane capacity to be sold - when there is a 3+ carpool policy in place and there are no “free riders” as a result of the HOT/C policy. The addition of HOT/C users and a generous 2+ free carpool policy has significant negative effect on HOT lane revenues. Both policies have the effect of reducing the capacity that is available to sell, the volume of paying users, and therefore the total revenue generated. The assumed Real Discount Rate also has a significant effect on total revenues. Under the most diverse scenarios and assumptions tested in this study, yielding the highest and lowest revenues, the Limited Eligibility alternatives for I-680 yield a range of 20-year revenues from approximately $120 million to $331 million, and for I-580 a range from $18 million to $167 million. The 100 Percent alternatives for I-680 yield a range of revenues from $76 million to $309 million, and for I580 a range from $10 million to $159 million. The low end of the revenue ranges is characterized by these assumptions: most generous crediting policies (100 Percent Eligibility), HOV2+ carpool policy, and highest real discount rate. The high end of the revenue ranges is characterized by the opposite assumptions: least generous crediting policies (Limited Eligibility), HOV3+ carpool policy, and lowest real discount rate. Revenues are also significantly affected by the assumed sensitivity of total facility usage with tolls in place and whether or not increases in real household purchasing power are assumed. The revenue estimates depend upon the extent to which SOV and carpool volumes are sensitive to the tolls. If there is little total response of traffic to the presence of tolls, and real income growth is assumed, total revenues could be substantially more than derived under the more conservative assumptions that are provided. Operational AnalysisA qualitative evaluation and limited quantitative evaluation of two of the 14 scenarios is provided for I580 and I-680. The two alternatives selected for study of each facility represent the extremes, the least and most HOT/C lane impacts among the proposed Limited Eligibility scenarios under consideration. The rationale for selecting the two extreme scenarios is to establish a range of impacts for analytical purposes. The 100 Percent HOT/C lane was not included in this operational analysis, because it is deemed highly unlikely to be implemented. The two selected scenarios are:
Scenario C (maximum usage) demand volumes appear to be close to or slightly over capacity for I580, but not for I-680, while Scenario M (minimum usage) demand volumes seem to be well below capacity. It is reasonable to assume that ramp metering will be in place by the time any such lane is constructed, so it is likely the volumes could be controlled enough to keep actual volumes within capacity. One key element to successful operations would be the physical construction of the lane, particularly the type of buffer separating the HOT lane from the adjacent lanes and the width of shoulders, both of which would increase the capacity if designed optimally. Another element would be the locations of the access points relative to the access interchanges. The location of entry points should be as far as feasible from the interchange that nominally serves the lane, but upstream enough from the next interchange’s on-ramp. By focusing the operational analysis on the two alternatives representing the extremes of the proposed lane configurations (least usage and most usage by vehicles using HOT/C credits), the analysis brackets the range of potential impacts. The analysis shows that the concepts studied in the report would function adequately for all the Limited Eligibility scenarios. Some of the scenarios, specifically 2025 with HOV-2 free and generous HOT/C crediting may strain the lane and produce service levels worse that LOS D, but this performance would still be better than the freeway mainline GP lanes. HOT/C Lanes Feasibility ConsiderationsThe findings of the HOT/C lanes alternatives and conclusions are:
Implementation ChallengesThe implementation of HOT/C lanes on I-580 and I-680, as an additional feature of a HOT lanes program, faces several major challenges. A HOT/C lanes system on both freeways would need to satisfactorily address the following issues.
1. INTRODUCTION1.1 Background of the FAIR Lanes ConceptThe Fast and Intertwined Regular (FAIR) lanes concept combines the use of pricing to manage road congestion while simultaneously addressing perceived equity issues that may arise from priced roads. One frequent criticism of the high-occupancy toll (HOT) lanes concept is that it may be inequitable to low-income users who are less able to afford the tolls than are users with a higher income. Another concern that has been expressed is that the general public, regardless of income, may resist HOT lanes unless they receive some tangible benefit from them even when they do not use them. The basic concept of FAIR lanes is to provide eligible users of the general purpose (GP) lanes with a “credit” each time they use the GP lane during peak periods. The original concept is outlined in an article by Patrick DeCorla-Souza in a series of articles and papers. As described by DeCorla-Souza (2000) in an article in the ITS Quarterly1 the FAIR lanes concept attempts to maximize priced lane throughput, speed, safety, driving comfort and revenue by allocating two lanes to “fast” lane use, one or both of which would be taken from GP use. To compensate those currently using the GP lanes for the lane “take away,” credits would be given to all GP lane users with transponders for each use during peak periods; these credits would be redeemable toward paying the toll on the “fast” or HOT lanes, or potentially for other transportation purposes. The proposal subsequently evolved to also provide for “toll and transit fare credits or refunds for low income commuters to address equity impacts and reduce the incentive for them to divert to an alternative free route.”2 All high-occupancy vehicles (HOVs) would be able to use the HOT lanes without paying a toll. In August 2001 the ENO Transportation Foundation conducted focus groups in New York City to test commuters’ response to the FAIR lanes concept, as well as HOT lanes. The focus group participants were solo-driver commuters from the outer boroughs of New York City into Manhattan (clearly, a very different context from the corridors that are the subject of this present study). The majority indicated overall support for FAIR lanes, also described in this setting as “Fast Lanes,” in which HOVs would ride for free and low-occupancy vehicles paid a toll. However, the solo drivers indicated that, unless there are unusually pressing needs, they would normally ride the free lanes to avoid the toll. Although the participants understood credits in terms of accumulation, several participants had difficulty understanding that the credits were compensation for the conversion of an existing free regular lane into a fast HOV alternative. After having the concept explained in detail and being told that their credit would be equivalent to 25 percent of the toll at the time they are traveling, the participants’ reaction was “generally positive.” Thus, for the clear majority who would ride the free lanes on a normal basis, the credits were regarded as “getting something for nothing.”3 1.2 Focus of I-580 and I-680 StudyThis study modifies the FAIR Lanes concept in three significant ways:
FAIR lanes are an innovative and untested concept. This study, which is undertaken in cooperation with the Federal Highway Administration (FHWA), was designed to test this particular equity concept on actual freeway corridors. Due to political feasibility considerations, it was decided that a modified concept, termed High-Occupancy Toll/Credit (HOT/C) in the remainder of this report, would be applied to two specific freeway segments in Alameda and Santa Clara counties in California: Interstate 580 (I-580) and Interstate 680 (I-680)
This study analyzes key aspects of the HOT/C lanes concept including: toll revenues, impact on vehicle volumes and speeds, travel forecasting, freeway operations, and public opinion. The study reviews and compares 14 policy scenarios in all. These scenarios meet the purposes of the study and the screening criteria. The scenarios include the following categories:
Furthermore, the study further explores variations of these scenarios in order to test the sensitivity to different factors. These factors include different carpool eligibility policies, different horizon years, and variable crediting rates for HOT/C-eligible vehicles. The chapters that follow first place the study in its physical and policy context, and then proceed to analyze systematically these various scenarios. The study is the first comprehensive application of the HOT/C adaptation of the FAIR lanes concept as a potential way to address one aspect of the equity concerns often raised in connection with HOT lanes proposals. The equity issue is only one challenge faced by value pricing or road pricing proposals: a survey of the value pricing “state-ofthe-art” appears as Appendix A of this report. While this study includes analysis of both the low-income (Limited Eligibility) and the all-users (100 Percent Eligibility) HOT/C lanes crediting schemes, the analysis is more detailed for the Limited Eligibility options. This focus is a result of the deliberate and considered judgment of the project study task force, which concluded that the low-income scheme (Limited Eligibility) has a far greater likelihood of being implemented by the policy-makers in this region than does an all-users scheme. The political unacceptability of the 100 Percent Eligibility scheme, arising from concerns about both income equity and about excessive loss of revenue, led to this conclusion. Finally, the study task force also concluded that the prospect of converting existing free lanes into priced lanes on these corridors is remote that it would not merit consideration. Both of these freeway corridors lack convenient, parallel route alternatives. Furthermore, local and state elected officials have indicated strong opposition to any pricing or “take away” of existing free facilities. 2. EXISTING CONDITIONSThis section describes the physical and operational characteristics of the Interstate 580 (I-580) and Interstate 680 (I-680) corridors. This summary of existing conditions relies on currently available data. 2.1 Physical CharacteristicsInterstate 580The study limits for I-580 are Greenville Road/Altamont Pass Road to the east and the I-580/I-680 junction to the west. The facility has four GP lanes in each direction separated by a median. The median varies in width between 36 and 42 feet.4 BART operates along I-580 in the median and terminates at the Dublin-Pleasanton BART station at the west end of the I-580 study area. The length of the I-580 corridor between I-680 and Greenville Road is approximately 12 miles. This section is contained entirely within Alameda County. Figure 1
Interstate 680The study limits in the I-680 corridor are Route 237 (Santa Clara County) and Route 84 (Alameda County). It is a six-lane facility with three GP lanes in each direction. Currently, there is one interim, non-standard HOV lane in the southbound direction. This lane opened in December 2002 and the plan is to have it completed to full freeway standards by 2008. The corridor is approximately 14 miles long. Approximately 80 percent of this section is located in Alameda County and the remainder in Santa Clara County. The size of medians, the design of overcrossings and the placement of columns within the medians varies throughout the corridor. The northbound and southbound directions of the roadway have different elevations in almost half of the corridor.5 2.2 Operational CharacteristicsPeak Hour and Daily Traffic VolumesThe California Department of Transportation (Caltrans) provided mainline and ramp 24-hour count data for both corridors. Most of the data was collected in 2003 and reflects all days of the week. To summarize the data, the most recent weekday counts were used. Generally, the most recent data was counted between May and October, which is typically when the highest counts are collected. For each hour, the highest value was identified. From these numbers, the highest morning value (midnight to noon) value and the highest evening value (noon to midnight) were identified as the AM and PM peak hours. Interstate 580Figures 2 and 3 show weekday eastbound and westbound daily mainline volumes for I-580. Both figures show distinct peak levels of activity. In the westbound direction, the peak occurs in the morning indicating most jobs are west of this corridor. In the eastbound direction, peak traffic occurs in the afternoon. Both figures show smaller peaks in the reverse commute direction. Congestion in this corridor has consistently increased over time. In 2001, the segment of eastbound I-580 between Hopyard Road and El Charro Road was the fifth most congested freeway in the Bay Area in the afternoon; it was ranked 13th in 2000. Today it is the third most congested freeway in the Bay Area in the PM.6,7 Interstate 680Figures 4 and 5 show daily weekday northbound and southbound daily mainline volumes for I-680. Both figures show a large peak and a small peak. In the northbound direction, the large peak occurs in the afternoon with a smaller peak in the morning. The large peak occurs in the morning in the southbound direction. Therefore, the peak commute direction is towards jobs in Santa Clara County and southern Alameda County. These figures also indicate that although there is a predominant commute direction southbound (AM peak period) and northbound (PM peak period). The northbound AM and southbound PM reverse commute is also significant. These volumes include both GP and HOV lane traffic volumes. The southbound segment of I-680 between Sunol Road and Route 262 also has consistently placed in the “top 10” of the locations with the worst congestion in the Bay Area. However, over the past few years, its position has improved, possibly due to a reduction in traffic due to the economic downturn. In 2000, the segment was ranked second. In 2001, it improved to third, and in 2002 it was ranked eighth. Caltrans also collects information on the usage of HOV lane versus GP lanes. For the I-680 southbound lane (between Route 84 and Route 237) during the AM peak hour, seven percent of all vehicles used the HOV lane and 11 percent of all persons traveling southbound in the corridor used the HOV lane.8 Prior to the introduction of the HOV lane, there were rapid increases in delays on I-680 due to high peak period travel demand, especially between 1990 and 2001. Since then, the slow economy has resulted in reduced travel times and congestion levels. Figure 2
Figure 3
Figure 4
Figure 5
Table 1 summarizes average daily traffic (ADT) volumes data for each facility. Table 1
Source: Caltrans District 4 Highway Operations, Traffic Volumes Counts. Traffic volumes in these corridors have risen steadily over time. Table 2 shows the increase in average daily traffic volumes (ADT) since 1994. Table 2
Source: Caltrans District 4 Highway Operations, Traffic Volumes Counts (2000-2004). Figures 6, 7, 8 and 9 show peak hour ramp volumes for each facility. Figure 6
Figure 7
Figure 8
Figure 9
Traffic OperationsCaltrans monitors freeway conditions by collecting data on the magnitude, extent and duration of congestion. To characterize typical weekday conditions, speed and travel time data were collected using “floating car” runs. Caltrans District 4 summarized conditions for several representative locations on I-580 and I-680 in the Year 2002 Bay Area Freeway Congestion Data report. During the AM peak hour, vehicles on westbound I-580 between Vasco Road and Airway Boulevard experienced 3,910 vehicle hours of delay and the congestion lasted for more than three hours (6:15AM – 9:30AM). At El Charro Road vehicles experienced 250 hours of delay, and congestion lasted between 6:45AM and 9:15AM. Table 3 summarizes congestion delay and duration data. Table 3
Source: Information Memorandum: Year 2002 Bay Area Freeway Congestion Data, Caltrans District 4, Office of Highway Operations. Caltrans ranks locations based on delay where there is continuous stop and go conditions. Eastbound I-580 between Hopyard Road and west of El Charro Road during the PM peak hour was ranked number three based on the duration of total delay. Southbound I-680 (AM peak hour) between Sunol Road to south of Route 262 was ranked number eight. Table 4 summarizes the results of “floating car” runs for I-580 and I-680, representing typical conditions. Each speed profile shows variations in speeds by location for a typical run. It also summarizes, over several runs, travel times for the entire corridor. The travel times and average speeds shown in the table represent conditions with typical levels of congestion as well as conditions with no congestion. Table 4 shows that travel times when conditions are the most congested are at least twice as long as under free-flow conditions for both I-580 and I-680. Correspondingly, average speeds under congested conditions are about half as fast under free-flow conditions. Close inspection of the speed profiles shows where the variations in speeds occur within each corridor. In the AM peak hour on westbound I-580, speeds begin to decrease east of Greenville Road, dropping to below 10 mph between Vasco Road and Route 84. Speeds continue to stay low until Airway Boulevard. At this point, speeds begin to increase, resulting in free flow conditions through the end of the study area at I-680. Table 4
Source: Caltrans District 4, Highway Operations, fax from R. Kyutoku, March 28, 2004. Notes: I-580 speed and travel time data was collected between N. Flynn Road and I-680. I-680 data was collected between Bernal Avenue and Capitol Avenue. Conditions were considered to be free-flow when average speeds were about 65 mph. In the eastbound direction during the PM peak hour, speeds decrease briefly east of the I-680 interchange. Speeds then increase but decrease sharply at the Hopyard Road interchange, resulting in stop-and-go conditions. After the Tassajara Road interchange, speeds begin to increase again, continuing until the Livermore Avenue interchange. Speeds decrease as traffic approaches the Route 84 interchange. On southbound I-680 during the AM peak hour, conditions are generally free flowing or only slightly impeded south of Bernal Avenue until Andrade Road. At this point, speeds decrease and traffic flow becomes unstable. Large variations in speeds, sometimes dropping below 10 mph, continue until Mission Boulevard/Route 262. Traffic flow becomes free-flowing after this point, continuing through the end of the corridor. In the PM peak hour on northbound I-680, speeds begin to become unstable north of Scott Creek Road where there is a lot of variation. Although traffic flow remains free flowing after Mission Boulevard/Route 262, speeds drop north and south of the truck scales between Sheridan Road and Andrade Road. Speeds then climb back to allow free flow conditions. The segment between Scott Creek Road and Capitol Expressway was also surveyed in the non-predominant direction during the peak hours (this segment extends beyond the study area). During the PM peak hour in the northbound direction, the speed profile shows speeds fluctuating between 0 and 30 mph between Scott Creek Road and Calaveras Boulevard/Route 237. Truck PercentageCaltrans compiles the percentage of trucks on California highways.9 For I-580 within the study area, the average percentage of trucks on a daily basis was ten percent. For I-680, it was seven percent. Vehicle Occupancy and Vehicle ClassificationCaltrans compiles information on vehicle occupancy for facilities with existing HOV lanes only. Therefore, only data on vehicle occupancy is available for I-680. Table 5 shows vehicle occupancy and classification data for I-680. Table 5
Source: “HOV Lanes in the Bay Area,” Caltrans District 4, 2002. Notes:
2.3 Travel PatternsInterstate 580In 2000, the San Joaquin Council of Governments (SJCOG) and the San Joaquin Partnership sponsored a study to examine commute patterns in the Altamont Pass region. They surveyed drivers traveling westbound over the Altamont Pass via a mail-in survey. Responses were received from 3,950 drivers. Table 6 shows the results of the survey for drivers. Table 6
Source: “Altamont Pass Commuter Survey,” San Joaquin Partnership & San Joaquin Council of Governments, October 2000. Table 7 provides additional information on destination by city. Table 7
Source: “Altamont Pass Commuter Survey,” San Joaquin Partnership and San Joaquin Council of Governments, October 2000. Interstate 680Travel in the I-680 corridor is oriented towards jobs in southern Alameda County and Santa Clara County.10 To find affordable housing, many of these workers reside in southern and eastern Contra Costa County, eastern Alameda County and the San Joaquin Valley. The only major route linking jobs in Silicon Valley with the housing in these areas is the I-680 corridor. 2.4 TransitLivermore Amador Valley Transit Authority (LAVTA)This agency operates fixed route, express service and shuttle service in the Tri-Valley area, serving the cities of Dublin, Pleasanton and Livermore. Two bus routes operate on I-580. Route 12X (Livermore Transit Center/Las Positas College/BART) operates express service in both the eastbound and westbound directions during the morning and afternoon via the Dublin-Pleasanton BART station. Route 20X is also connected to the Dublin-Pleasanton BART station. It connects the BART station with Lawrence Livermore National Laboratory. The service operates for about a three-hour period in both the AM and PM peak periods (6:00AM to 9:00AM, 3:00PM to 6:00PM). There are five runs in the morning and six runs in the evening. Santa Clara Valley Transportation Authority (VTA)VTA operates four routes that operate on I-680 in southern Alameda County and northern Santa Clara County. All of the routes terminate at the Fremont BART station. Route 180 (Fremont BART – San Jose/Diridon Station) operates seven days a week with half-hour headways in both directions. Two of the routes, Route 520 (Fremont BART-Lockheed Martin/Moffett Park) and Route 140 (Fremont BART-Sunnyvale Caltrain), offer peak hour directional service of six and ten trips a day, respectively. The fourth route (Route 141) offers only weekend and holiday service between Fremont BART and Great America. All of these routes are considered express service. The County ConnectionThis transit agency serves central Contra Costa County including the San Ramon Valley. Four of its bus routes serve the Dublin-Pleasanton BART station. To get to the station, these routes use I-580 between I-680 and the Hacienda Boulevard interchange. Altamont Commuter Express (ACE) TrainsThe ACE corridor extends from Stockton in San Joaquin County to San Jose. There are ten stations, including Livermore, Pleasanton and Fremont. There are three morning westbound trains and three afternoon eastbound trains. Average daily ridership in April 2004 was about 1,300 riders. The Livermore station averaged 130 riders and the Pleasanton station averaged 170 riders.11 Bay Area Rapid Transit (BART)This segment of the I-580 corridor is served by the Dublin-Pleasanton BART station. This station is located south of I-680 at Hacienda Boulevard. There is direct service between this station and Daly City. The rest of the BART system is accessible from this line by transferring to other trains at the Bayfair station. The average weekday volume of exits from the Dublin-Pleasanton station is 5,957 exits.12 Table 8 shows the origins of riders boarding at the Dublin-Pleasanton station. Table 8 Rider Origins – Dublin Pleasanton Station
Source: “Patron Survey,” BART, 1998. For riders boarding at the Dublin-Pleasanton Station, almost 60 percent exit at downtown San Francisco stations. About ten percent of riders exit in downtown Oakland. Another nine percent get off at the other Oakland stations. The remaining 20 percent exit throughout the BART system.13 3. ALTERNATIVES DEFINITIONThis chapter defines the range of potential alternatives for the study. It consists of four sections: (1) Discussion of alternative compensation schemes; (2) uniform characteristics for all alternatives; (3) variable features (major features which will have variations distinct enough to constitute separate consideration and separate travel forecasting runs); and (4) the rationale for selection of alternatives to analyze. 3.1 Alternative Compensation SchemesThe basic notion underlying HOT/C lanes is that revenue from a HOT lane facility could be used to subsidize the travel of those who do not benefit directly from the HOT lane itself. In offering such compensation, the aim is to address the public perception that HOT lanes benefit only travelers who can afford the access. In so doing, the political feasibility of the HOT lane project may be improved. Although a new HOT lane, in fact, benefits all corridor users by increasing capacity and reducing travel times, the perception that HOT lanes are luxury or "Lexus lanes" that selectively benefit the affluent is not uncommon. This is particularly important in places like the Bay Area where the new lanes proposed for I-680 are being paid for by general highway funds, rather than dedication of HOT lane revenues. There are several ways in which such compensatory cross-subsidies could be implemented. Those remaining in the general purpose lanes could earn: (1) unrestricted cash credits, useable for any purpose; (2) credits that are redeemable only for a variety of transportation services in the corridor; or (3) redeemable only for access to the HOT lane. The unrestricted cash policy makes sense only in the case in which there are no transportation alternatives of value and, in any case, would be extremely difficult to justify to the public and policy-makers. The transportation services policy makes sense only if there are likely to be substantial options to HOT lane that a significant number of travelers can and will use. The third option – redeemable only for HOT lane tolls – is most appropriate for suburban corridors, where park-and-ride parking is free and transit and paratransit options are sparse, due to the highly dispersed patterns of residences and employment centers. As an empirical matter, the subsidization of the HOT lane trip is the most practical compensation option to model. This is because the GP lane users are, by definition, drivers before the HOT lane is implemented; hence, the closest substitute for their current means of travel is the HOT lane. Paying the HOT lane toll is the most likely use to be made of any cash credit restricted to transportation services by the corridor user. In contrast, the use of the credits to buy down transit fares is unlikely to be empirically important, because transit use is generally inelastic with respect to the level of fares. Similarly, paratransit services, such as taxi or limousine service, also are unlikely to be viewed as a substitute because the out of pocket costs of such service are very high relative to the level of compensation available from the HOT/C policy. This severely limits the influence that the HOT/C subsidies would have on the use of such services, and the impact of such policies will be difficult to detect in a modeling or real-world context. This logic suggests that the use of HOT/C subsidies to underwrite the tolls for occasional HOT lane trips by GP lane users constitutes a best-case HOT/C policy, from the standpoint of both the fairness and effectiveness of the HOT/C compensation policy. Therefore, on these corridors in the Bay Area policy context, the assumption that credits earned by HOT/C lane users would subsidize HOT lane access is employed in this study. 3.2 Uniform Characteristics for all AlternativesBecause the specific focus of the study is primarily to address equity issues, particularly as they pertain to lower-income corridor users, the focus is on comparing alternatives is on the economic features -- who receive the “credits,” in what form, in what carpool policy context and how much. That requires a consistent “base case” in which other potential variables are held constant. For the purposes of this study, the analysis findings and recommendations arising from the Interstate 680 Variable Pricing Feasibility Study, completed in 2003, were used to inform the base case. That proposal, which has been adopted and is being implemented by the Alameda County Congestion Management Agency (ACCMA) and other local entities, is presumed to be the basic model for both I680 and I-580 HOT lanes. Uniform assumptions and parameters include that apply to this study:
A simple low-income toll discount alternative (i.e., low-income users would pay a lower toll than other users, but there would be no crediting for their use of GP lanes) was briefly considered but discarded, because this alternative was deemed to be outside the scope of the study. Nevertheless, such an alternative may be considered at a later date as a different way to deal with the income equity issue. It is presumed that the low-income toll discount scheme, similar to all of the FAIR lane alternatives (both Limited Eligibility and 100 Percent Eligibility), would have impacts in proportion to the magnitude of the subsidy, because the discount would increase the number of HOT lane users paying a discounted toll. The impacts would be felt in both the revenues and in the performance of the HOT lanes and the GP lanes. One alternative that was also briefly considered but screened out early in the study was tolling the entire I-580 and I-680 corridors, i.e., turning them into complete toll roads on all lanes. This alternative was eliminated due to a lack of adequate, alternate parallel routes in the corridors and the presumed political infeasibility of converting a traditional freeway (with no alternative routes) into a toll road. It is highly unlikely that decision-makers and the public would find this acceptable. 3.3 Variable FeaturesVariable features for the study include the following.
3.4 Selection of AlternativesThe objective of selecting alternatives to study is to devise a series of roughly comparable alternatives that meet the primary objective of the study in examining a toll-crediting system as a potential solution to a perceived equity problem. The alternatives need to capture the variables described above and be distinct enough from one another to yield meaningful results to test the HOT/C lanes concept. The 14 policy scenarios that meet the specific purposes of the study and are comparable in terms of travel and economic forecasting and operational analysis include the following: Conventional HOV Alternatives
Scenarios A and B provide a base case of a conventional HOV lane for which there is no tolling whatsoever and therefore no economic equity issue arising from tolling. It provides a point of comparison for measures such as vehicle speeds and volumes. It, of course, provides no revenues. Limited Eligibility HOT/C Alternatives (low-income users only)
Scenarios C through F examine the impacts of the HOT/C lanes policy. They compare widely varying crediting rates. They also test the impact of 2+ and 3+ carpool policies. These scenarios are the most relevant to the concept of “fairness” as defined by providing a special benefit to low-income corridor users. 100 Percent Eligibility HOT/C Alternatives (all-user eligible, regardless of income)
Scenarios G through L examine the impact of providing a credit to all GP lane users who have a transponder. Drivers are rewarded for using the GP lane and enduring the congestion by allowing them to accumulate credits useable to pay their toll. It does not target low-income users, but instead seeks to make the HOT lane concept more attractive to all corridor users and therefore potentially more acceptable to the general public, because they would always receive a benefit. However, in order to assure free-flow conditions on the HOT lane, the crediting rates are expected to be very low, so the credit may be viewed by many users as almost negligible. Conventional HOT Lane Alternatives
Scenarios M and N represent “pure” HOT lanes and also provide a point of comparison. They provide a “zero credit” to GP lane users of any income and represent the pure HOT lane. They are useful in terms of comparing revenue generation as well as traffic conditions. 4. PUBLIC ACCEPTANCE OF HOT CREDIT LANES AND VALUE-PRICED LANES AS AN EQUITY SOLUTION“Equity” in the transportation pricing context generally refers to distribution of impacts (benefits and costs) and the degree to which this distribution is considered fair and appropriate. For this study, transportation equity impacts fall into the following two categories.
Horizontal equity often requires that users bear the full costs of their transport facilities and services, but vertical equity often requires subsidies for disadvantaged people. Therefore, transportation planning often involves making tradeoffs between different types of equity. Horizontal equity requires that people pay, as much as possible, the costs imposed by their travel activities. Pricing reforms such as road pricing, distance based fees, and fuel tax increases can increase equity by charging according to use, taking into account factors such as vehicle type, time and location. In order to assess public and stakeholder attitudes towards both the FAIR lanes concept and value-priced HOT lanes, the study team conducted two focus groups with frequent users of I-580 and I-680 and a public opinion survey of residents in Alameda County and the surrounding communities. 4.1 Focus GroupsOn August 24, 2004 two focus groups were conducted in Dublin, California. Participants in the groups consisted of Alameda and Contra Costa County residents, as well as residents from the towns of Castro Valley, Dublin, Hayward, Livermore, Pleasanton and San Ramon. All participants were I580 and I-680 users, and they were screened during the recruiting process to ensure as much diversity in income level and commute patterns as possible. The first group consisted of ten female participants, and the second group consisted of ten male participants. The groups were professionally moderated. The Focus Group Moderator’s Guide is Appendix C. Focus groups are qualitative research, not quantitative. To this end, focus groups explore how people talk and think about a specific topic and what is important to them, rather than measuring levels of support for particular points of view or positions. Votes taken within a focus group are not statistically valid, and they may not be representative of the population at large. SummaryThe focus groups for the study were designed to further explore and build upon the findings from focus groups that had been conducted for the ACCMA in July of 2003 on the subject of HOT lanes. Those earlier focus groups explored attitudes towards HOT lanes on I-680 over the Sunol Grade and found that participants were generally uncomfortable with the HOT lane concept as presented in those focus groups. In particular, participants were disinclined to accept the congestion relief benefits of HOT lanes and concerned about implementation issues. On a more promising note, participants in these groups expressed strong support for carpooling and carpool lanes and were most likely to support the HOT lane approach because it would finance construction of the northbound carpool lane over Sunol Grade. However, as noted below, the public opinion survey indicated strong support for HOT lanes, but a substantial reduction in support when the HOT/C lanes component is added. Using those findings as a starting point, the focus groups were designed to present HOT lanes in the context of completing the regional carpool lane network, and to then further test support for the HOT/C lanes concept as a means to address fairness concerns. It should also be noted that the terminology used to describe the concept was modified and labeled as “Smart Carpool Lanes” to be consistent with the revised and publicly-known name of the ongoing I-680 HOT lanes implementation project. The HOT lanes were described as HOV lanes which single-occupant vehicles (SOVs) could use in exchange for paying a fee, and that the fee would be collected by electronic transponders such as those in use for the region’s bridges. There would be striped separation between the HOV lanes and the rest of the freeway. The revenues that would be collected would be used to expand the region’s HOV lane network and regional express bus service. In contrast to the 2003 focus groups, the 2004 participants were generally supportive of the Regional Smart Carpool Lane proposal, a full network of interconnected carpool lanes spanning the region. In the context of an ambitious effort to complete the regional carpool lane network, participants accepted HOT lanes as a fair and reasonable way to pay for completion of the network, strongly suggesting that while Bay Area residents may not be ready to accept HOT lanes primarily as a congestion relief strategy in and of themselves, they are ready to accept them as a means to pay for transportation improvements that they want. The Limited Eligibility HOT/C lanes concept, providing benefits to low-income users, was less popular than was the simple HOT lane with no HOT/C credits. While some participants continued to raise fairness concerns about the Regional Smart Carpool Lane proposal, those concerns do not appear to be equity issues concerned with fairness toward low-income users. Equity Considerations
| ||||||||||||||||||||||||||||||||||||||||||||||||||||||||||||||||||||||||||||||||||||||||||||||||||||||||||||||||||||||||||||||||||||||||||||||||||||||||||||||||||||||||||||||||||||||||||||||||||||||||||||||||||||||||||||||||||||||||||||||||||||||||||||||||||||||||||||||||||||||||||||||||||||||||||||||||||||||||||||||||||||||||||||||||||||||||||||||||||||||||||||||||||||||||||||||||||||||||||||||||||||||||||||||||||||||||||||||||||||||||||||||||||||||||||||||||||||||||||||||||||||||||||||||||||||||||||||||||||||||||||||||||||||||||||||||||||||||||||||||||||||||||||||||||||||||||||||||||||||||||||||||||||||||||||||||||||||||||||||||||||||||||||||||||||||||||||||||||||||||||||||||||||||||||||||||||||||||||||||||||||||||||||||||||||||||||||||||||||||||||||||||||||||||||||||||||||||||||||||||||||||||||||||||||||||||||||||||||||||||||||||||||||||||||||||||||||||||||||||||||||||||||||||||||||||||||||||||||||
| VoT from MTC Model (in 1990 in 1990 Dollars) | |||
|---|---|---|---|
| VoT Used in Toll Modeling | |||
| (in 2000 in 2004 Dollars) | (in 2025 in 2004 Dollars) | ||
| SOV (includes Light Trucks) | $ 10.96 | $ 19.82 | $ 30.95 |
| HOV2 | $ 19.31 | $ 34.91 | $ 54.53 |
| HOV3+ | $ 28.96 | $ 52.37 | $ 81.80 |
| Heavy Trucks | $ 22.00 | $ 39.78 | $ 62.13 |
| Note: | |||
| Annual Real Income Growth: | 1.8% | ||
| Annual Infaltion Rate: | 3.0% | ||
| Source: ECONorthwest, 2005. | |||
The types of data generated by the Toll Optimization Model are:
To summarize this data, average tolls, speeds, total delay (vehicle hours traveled [VHT]) and traffic volumes on each freeway have been calculated and are presented in Tables 10 to 17. More detailed, link level data for individual alternatives is available from the model but not tabulated here. It should be noted that HOT lane facility lengths reported in these tables are calculated from the constituent segment lengths as represented in the MTC model; the actual lengths of an implemented facility are slightly different. These data, along with information on capital and operating costs, allows measurement of the impact of various HOT/C policies. Specifically, we can measure the impact (per HOT/C user of the HOT lane) on toll revenue, total delay (VHT) and capital and operating costs. Table 18 summarizes these impacts for the various HOT/C policy alternatives.
Table 10
Average Toll and Hourly Revenue Estimates during 2-Hour AM Peak Period in 2000
(in 2004 Dollars)
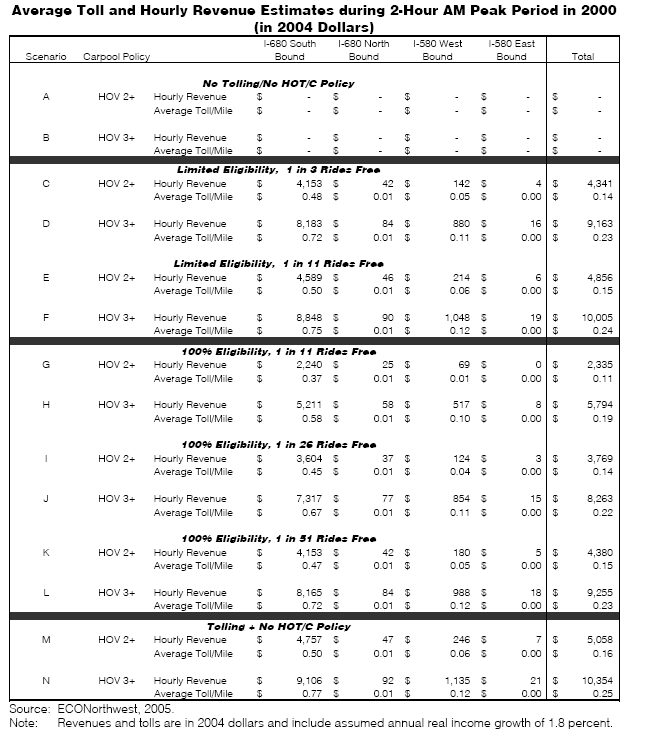
Table 11
Average Toll and Hourly Revenue Estimates during 2-Hour AM Peak Period in 2025
(in 2004 Dollars)
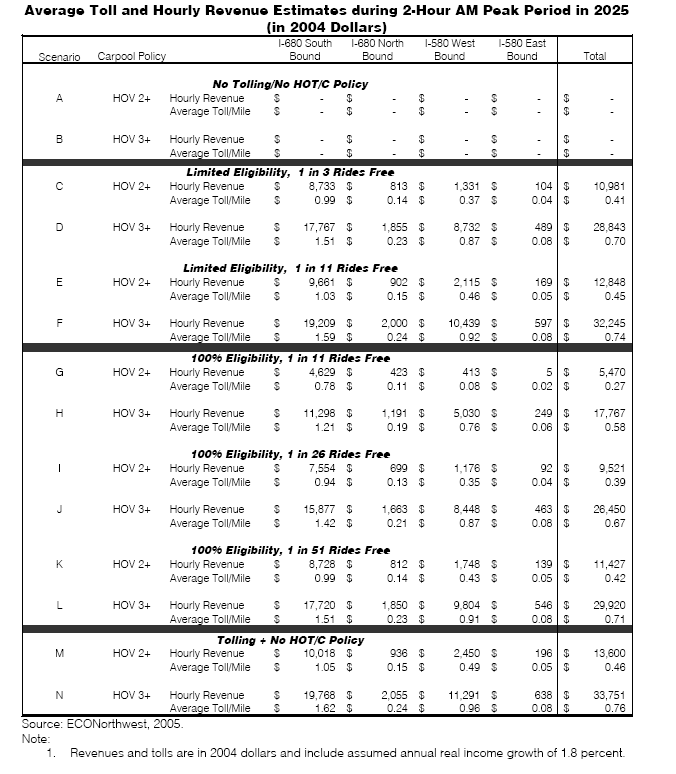
Table 12
Average Speeds on the General Purpose and HOT Lanes during 2-Hour AM Peak Period in 2000
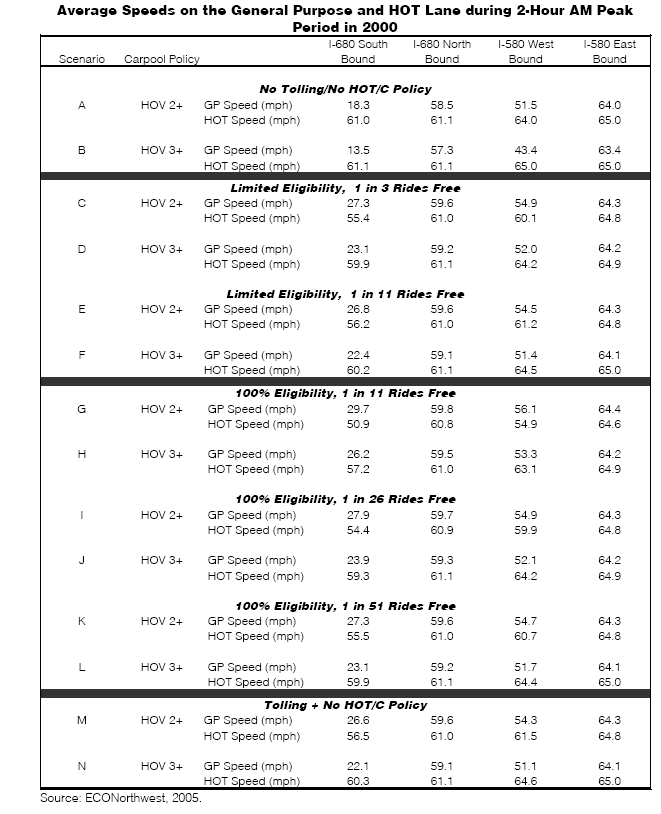
Table 13
Average Speeds on the General Purpose and HOT Lanes during 2-Hour AM Peak Period in 2025
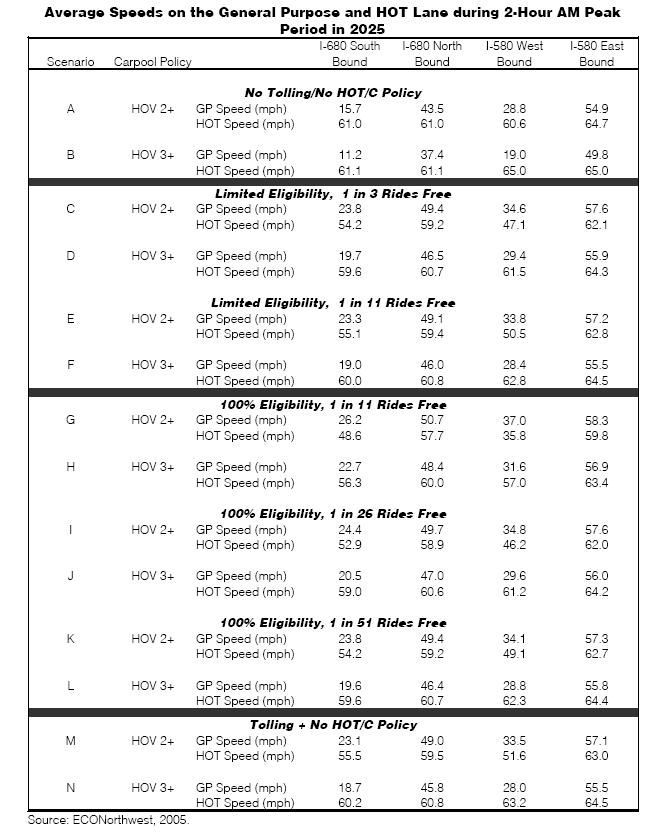
Table 14
Summary of Average Vehicle Volumes on HOT Lane during 2-Hour AM Peak Period
in 2000
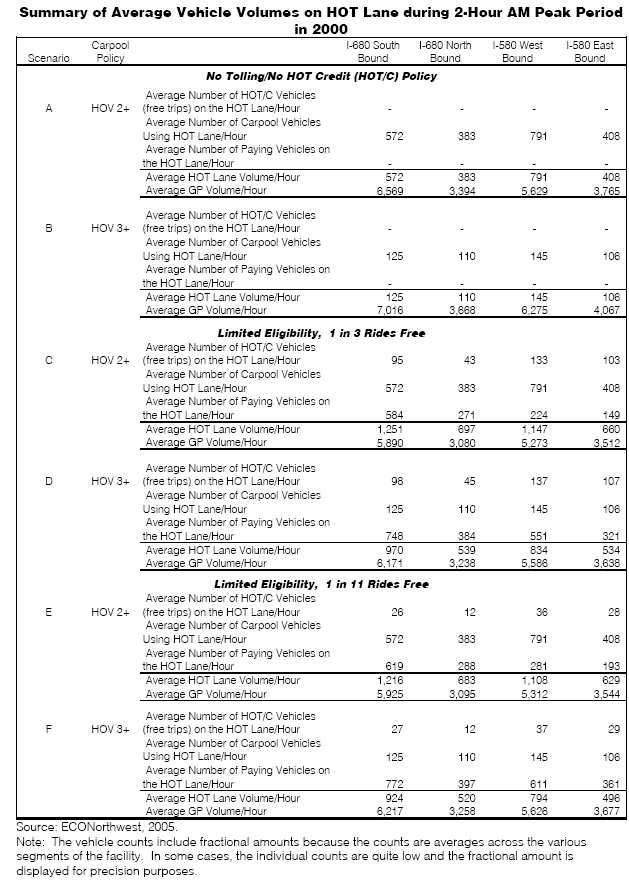
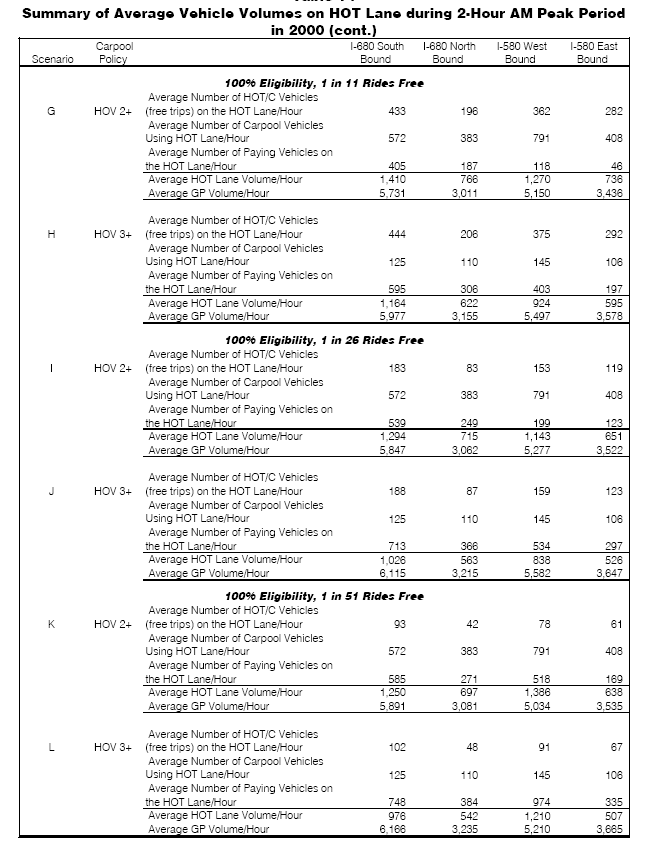
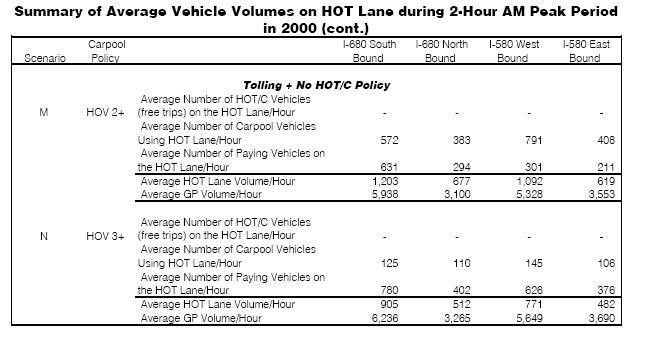
Table 15
Summary of Average Vehicle Volumes on HOT Lane during 2-Hour AM Peak Period
in 2025
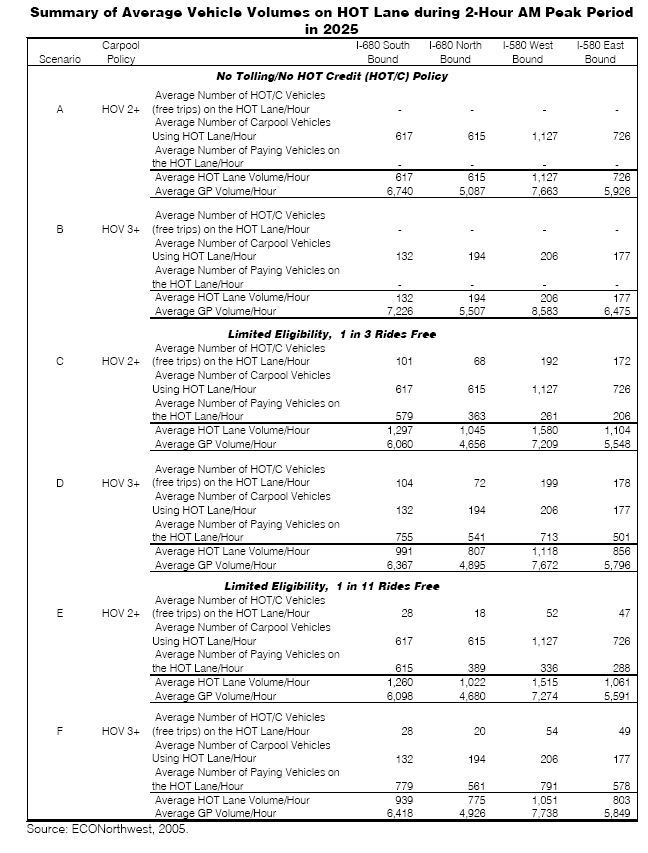
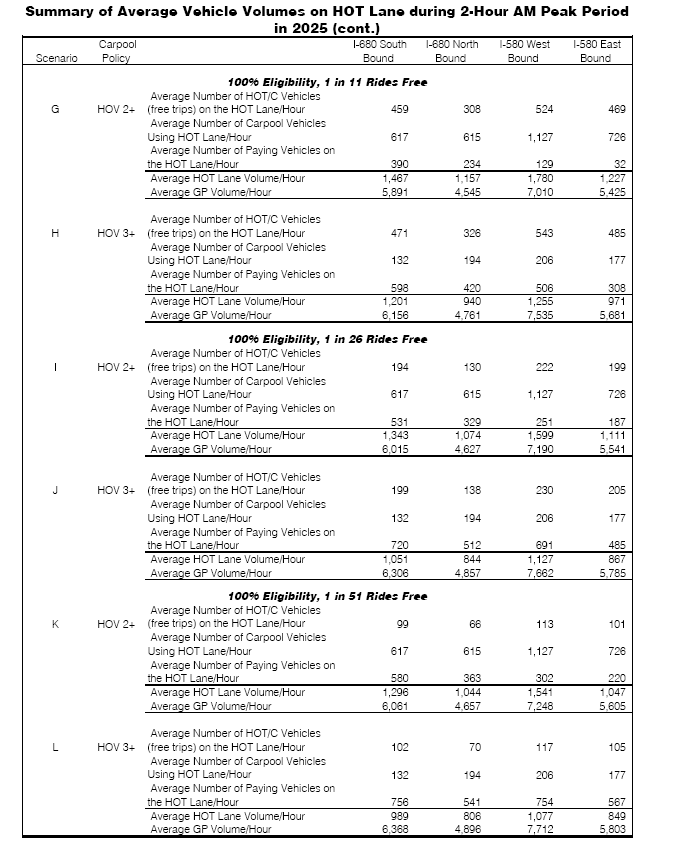
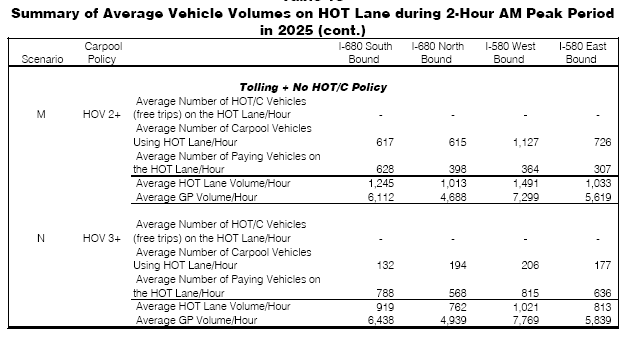
Table 16
Summary of VMT and VHT during 2-Hour AM Peak Period in 2000
in 2025
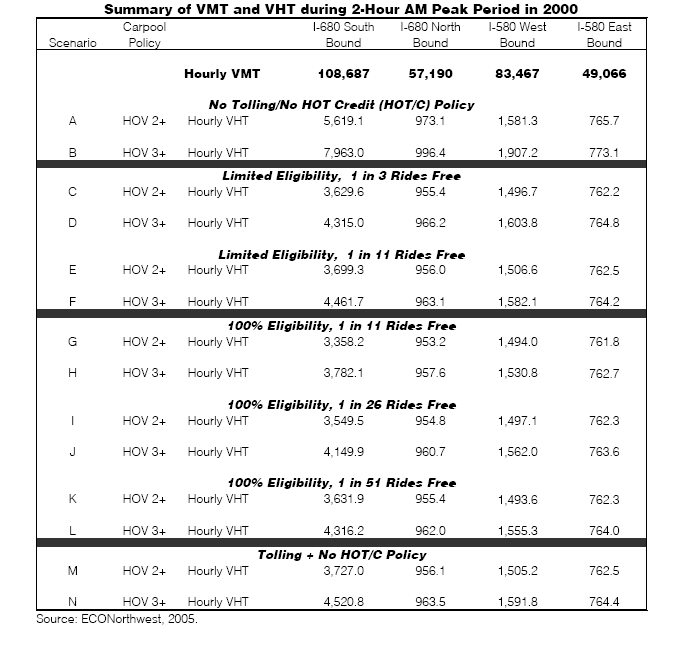
Table 17
Summary of VMT and VHT during 2-Hour AM Peak Period in 2025
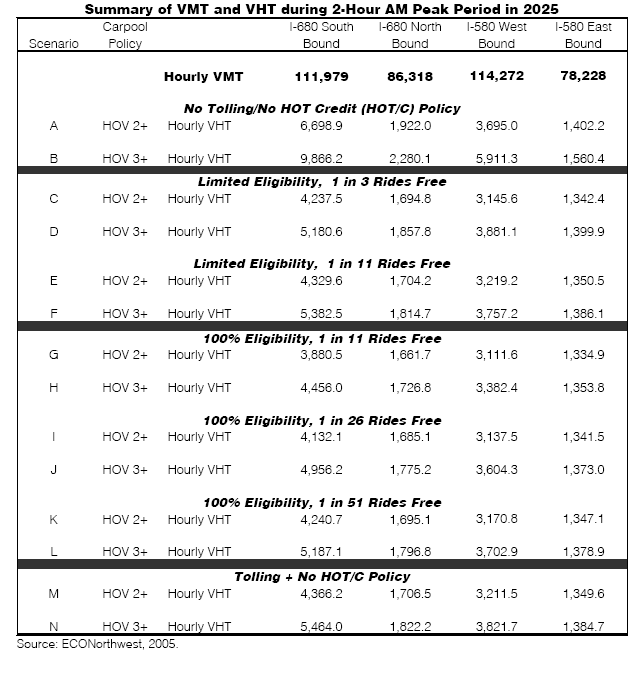
Table 18
Summary of Alternative HOT Credit HOT/C) Policies on VHT, Revenue, and Capital and Operating Costs (I-680 and I-580, combined)
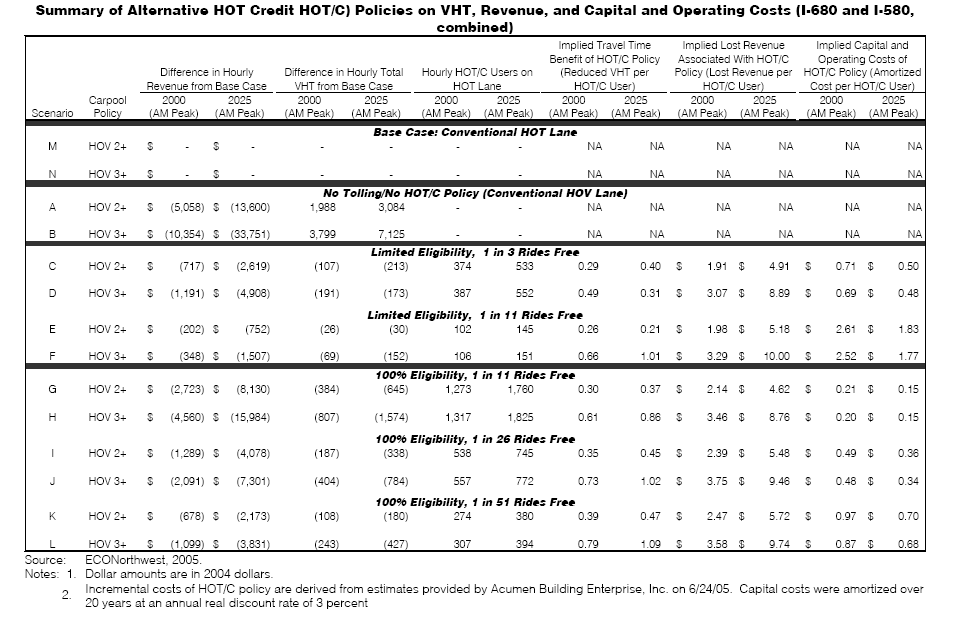
HOT Credit lanes policy is fundamentally a policy designed to remedy actual or perceived inequities in access to the superior service speeds of HOT lanes. The effect of HOT/C policy on toll revenues is provided as a way of measuring the impact on project financing of HOT/C lane policy. The impact on total vehicle miles traveled (VMT) is presented to capture the effect of the policy on total delay borne by users. Finally, the capital and operating costs associated with the facilities needed to implement HOT/C policy are provided as a means of measuring the additional project investment and day-today operating costs necessary to facilitate the HOT/C policy.
The analysis concludes the following:
Therefore, the decision to adopt or to not adopt HOT/C Lane policy involves balancing the HOT lane revenue impacts against any perceived improvement in equity of access the policy provides. There are operational impacts as well, but with the exception of the prospects of synchronous credit redemption described above, these impacts are relatively minor.
The primary purpose of this study and the associated tolling simulations is to evaluate alternative HOT/C policies, rather than to assess the financial feasibility of a new HOV or HOT lane. Nevertheless, it is interesting to compare the approximate total revenues that would be generated for each of the facilities under the various HOT/C and carpool policy alternatives. Consequently, the study team derived and applied expansion factors that permit rough estimation of annual, total revenues that would be collected under the various policy alternatives, including a pure HOT lane without HOT/C policy.
Precise measurement of the toll potential of a HOT lane facility requires modeling of tolls on a detailed, diurnal and weekly basis, since optimal toll levels vary with load and, hence, time of day and day of the week. This is a very resource intensive exercise that is more appropriate to a detailed project feasibility study than a policy study. However, having performed such detailed analyses on other facilities, including I-680, the study team is able to develop expansion factors to apply to the available, AM peak revenue estimates and expand these revenue estimates to an approximate annual level. When performed for the two model years, 2000 and 2025, it is then possible to interpolate and extrapolate revenues over a longer period of years.
In this chapter the value of 20 years of estimated revenues is presented, from the assumed build year of 2009 to 2029. The present value calculation permits summarizing in a single number the total revenues likely to be generated for each alternative in current (2004) dollars. In the process of making these measurements, the sensitivity of total revenues to the various underlying modeling assumptions is also reported, along with the assumed discount rate.
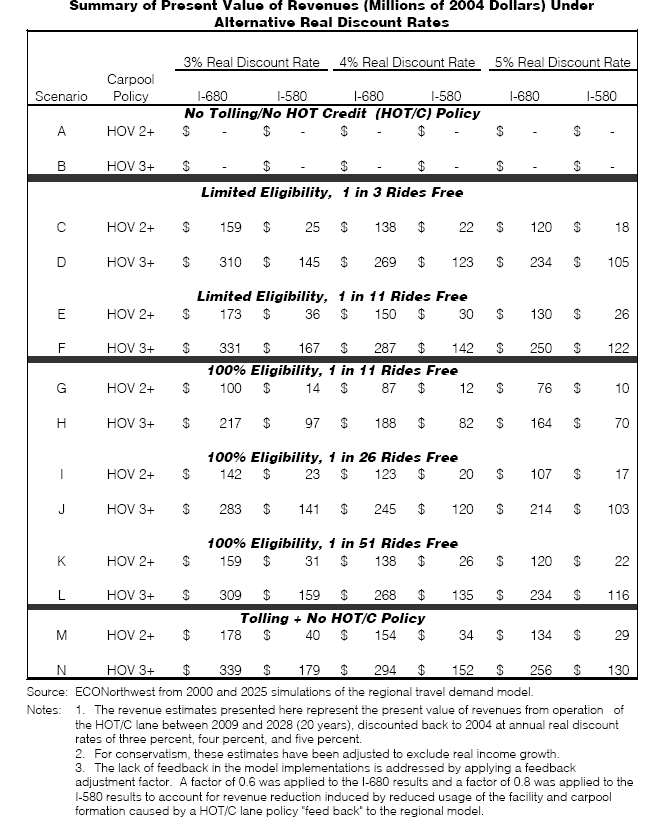
In particular, the toll optimizations incorporated two assumptions. First, tolls produced by the TOM analysis were not fed back into the regional model. If such feedback had been implemented, equilibrium toll levels likely would have been somewhat lower, and total facility and HOT lane volumes would also be somewhat lower than in the seed run (in which only a small, nominal toll is assumed to be in place on the HOT lane). Second, it is likely that tolls in future year values will be elevated not only by general inflation, but also by increases in average household purchasing power, or “real income.” The effects on revenue of both including and excluding model-feedback and real income effects are tabulated in Table 19. In Table 20, both assumptions are relaxed to provide a conservative, lower estimate of total revenues. Additional sensitivity analysis regarding the effects of alternative discount rates is also presented.
Table 19
Summary of Present Value of Revenues (Millions of 2004 Dollars) Under
Alternative Assumptions Regarding Real Income Growth and Model Feedback
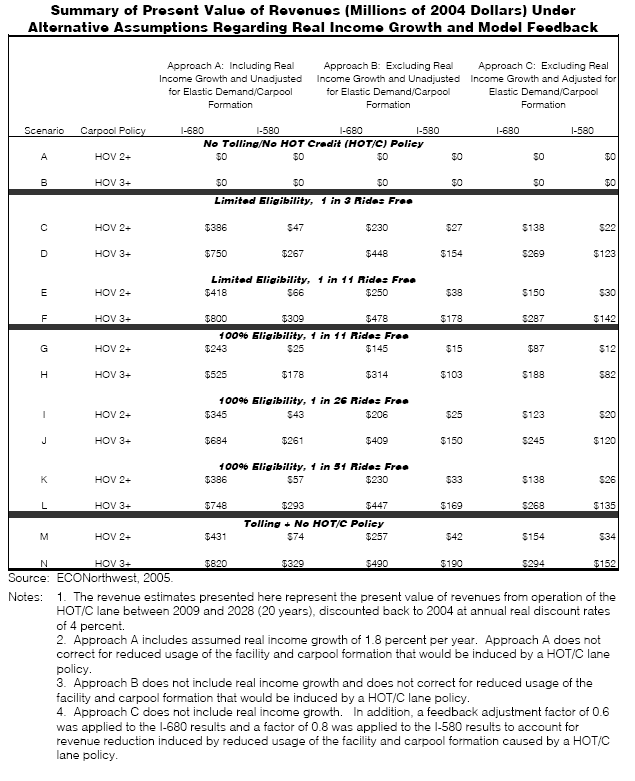
Table 20
Summary of Present Value of Revenues (Millions of 2004 Dollars) Under
Alternative Real Discount Rates
This section discusses the preliminary incremental cost estimates for implementation of HOT/C lanes on both the I-680 and I-580 corridors.
With respect to I-580, no detailed cost estimates have been completed for the cost of converting conventional HOV lanes into HOT lanes. The cost for adding a conventional HOV lane on I-580 is estimated by Caltrans to be approximately $200 million. The estimate to convert one HOV lane in each direction on I-580 from HOV to HOT is $31.9 million. This cost estimate for converting HOV lanes to HOT lanes on I-580 is derived by applying the existing Caltrans I-680 HOT lanes cost estimates and adjusting for bidirectional lanes and for a shorter corridor length. However, it should be emphasized that this estimate is highly conceptual and subject to significant modification as planning for the addition of HOV lanes on I-580 proceeds. In any case, this estimate or conversion of HOV to HOT for I-580 has no bearing on the cost estimate presented in the rest of this chapter, because this is concerned only with the incremental cost of conversion of HOT lanes into HOT/C lanes.
The cost estimate is for the incremental costs for implementation of HOT/C lanes under the Limited Eligibility HOT/C policy. For the purposes of this study, eligible HOT/C lanes customers are defined as those corridor users with incomes at or below 200 percent of the federal poverty index. In these relatively affluent corridors, the number of eligible users is quite low.
For both corridors, the following key assumptions were made: (1) Full integration with regional FasTrak electronic toll collection system, including account maintenance, transponder replacement, etc.; (2) Contract with California Highway Patrol for two additional patrol units daily, the cost of these patrols already being absorbed in the HOT lanes project and not an incremental cost for HOT/C lanes policy ; (3) Additional readers to cover all GP lanes; (4) Cost of each toll transaction is the same as current costs as reported by the Bay Area Toll Authority, which manages the FasTrak system; (5) Additional staffing for HOT/C lanes oversight and reporting; (6) Cost of additional software to implement HOT/C lanes concept to be shared equally by the two corridors; (7) Additional antennas and readers, including truss and foundation to support them, spanning the GP lanes, so that HOT/Celigible vehicles with transponders can be read and their accounts credited.
HOT/C lanes implementation assumes the existence of the HOT lane. Implementation of a HOT/C policy requires that motorists in the GP lanes be given some amount of credit upon their use of these lanes during peak periods when tolls are being charged on the HOT lane. To monitor this usage, motorists would have to own transponders that would be read via the FasTrak system already in place in the San Francisco Bay Area for the toll bridges in the region. Under the HOT/C lanes scheme, reading the transponder of an eligible GP lane user would not result in debiting a prepaid account, but instead would provide a credit to the user’s account. This would require that equipment be installed above each of the GP lanes, as well as other system modifications to keep track of the accounts. Accrued credits would be used towards future use of the HOT lane.
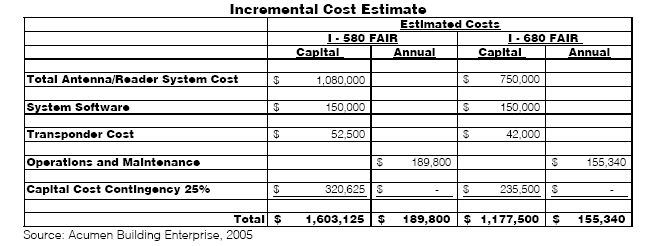
The total estimated incremental capital cost to implement HOT/C lanes on I-680 is $1,177,500. For I580, the estimated incremental capital cost is $1,603,125. These estimates are presented in Tables 21 and 22, with a summary table for both corridors in Table 23. Both corridor estimates include itemized capital components, plus a 25 percent contingency. The estimated incremental capital cost for implementing HOT/C lanes system on I-580 and I-680 HOT lanes combined is $2,780,625. The incremental O&M cost of implementing the HOT/C lane policy on both I-580 and I-680 HOT lanes combined is $345,140.
Table 21
I-580 HOT/C Lanes: Incremental Cost Estimate
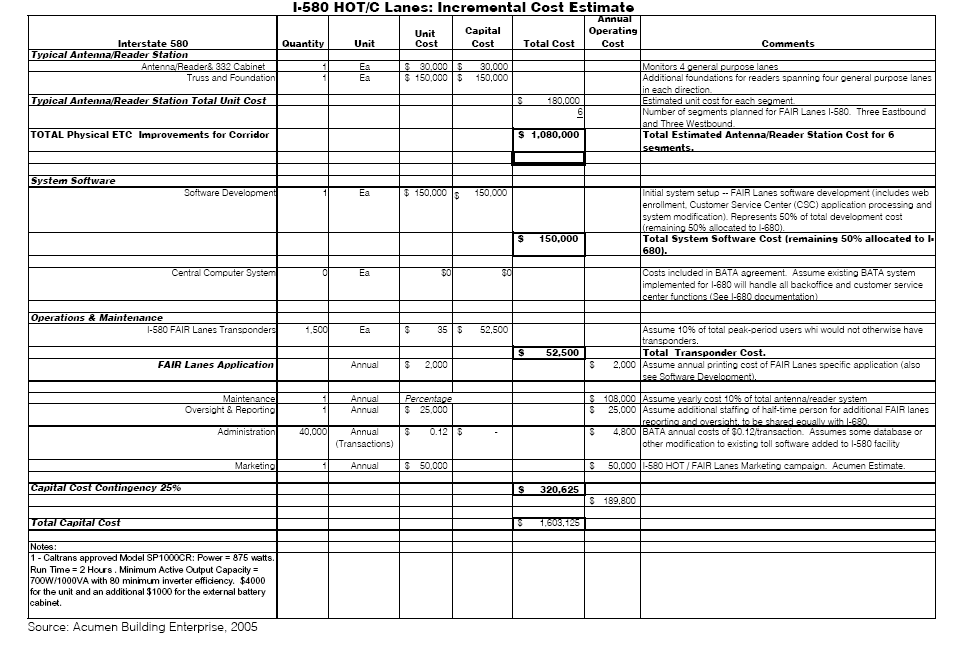
Table 22
I-680 HOT/C Lanes: Incremental Cost Estimate
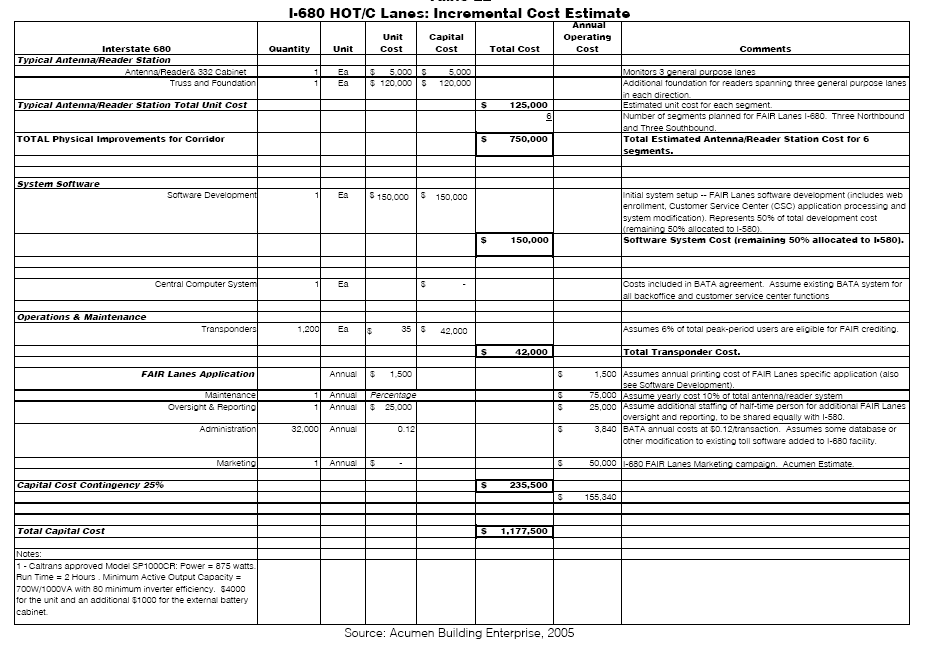
Table 23
Incremental Cost Estimate
Hardware Cost Implementation of HOT/C lanes on the corridors requires transponders to be read in the GP lanes in addition to the HOV lane. The HOV lane toll collection system consists of a reader and antenna. In order to provide the overlay of HOT lanes to account for the HOT/C lanes concept, three additional antennas on I-680 and four additional antennas on I-580 would be required (one for each GP lane) at each tolling location. The reader is a multi-channel device which has the capability to receive signals from the four antenna set at each monitoring segment. There are a total of six tolling segments on I-680, three southbound and three northbound. The antennas are installed on a cantilever truss. This allows the placement of an antenna directly above each lane. This antenna/reader system at each segment of the corridor has provisions for complete communications, battery back-up system, truss foundation, trenched conduit for electrical wiring, pull boxes, power conductors, and a metering cabinet. The antenna/reader system incremental cost for I-680 is $750,000 for I-680 and $1,070,000 for I-580. The difference between the two corridors is a result of the need to span four GP lanes in each direction for I-580, while I-680 requires spanning only three GP lanes in each direction.
Software Cost HOT/C lanes require the development of a crediting system to process transponder transactions in the GP lanes. This requires software development or enhancement to the current Electronic Toll Collection System (FasTrak) software. The change to the current software to implement a crediting system is the reverse of the debiting function of FasTrak. HOT/C lanes require that a credit be given to the FasTrak account as a result of a transaction. This credit would accrue based on a predefined rate, assumed for the purposes of this study to be a percentage of the HOT lane toll rate at the time of GP lane usage. When the user has accumulated sufficient credits, the transponder would allow the motorist free passage in the HOV lane. A precise algorithm is needed to allow credits to accrue and the integration with the FasTrak software. The development cost would be non-recurring. This software cost is assumed to be shared equally by both the I-580 and I-680 projects for a total of $300,000, split into $150,000 each for I-680 and I-580 respectively.
Operations and maintenance (O&M) cost estimates include both the administrative components and physical components. For the purposes of this study, only the low-income HOT/C lanes options are estimated, because that is considered to be the far more likely option to be adopted by policy-makers in this region. If all GP lane users were eligible rather than just low-income users, the number of transponders, accounts and transactions would be increased by an order of magnitude; the cost for that unlikely scenario is not estimated in this study.
The total annual O&M cost estimate is $155,340 for I-680 and $189,800 for I-580. The difference is accounted for by the one additional GP lane in each direction on I-580 and the higher percentage of eligible low-income users on I-580.
HOT/C Lanes Applications The HOT/C lanes application process would require slight modifications to the current administrative processes. There would be two different costs associated with adding questions of self certification to the application process: the cost for printing new application forms and the cost for revising current processes, e.g., web-based enrollment, mail or in-person customer service center (CSC) application processing procedures, and modification to the service center’s review process. Rather than revising the existing application forms, a new/separate application form specially designed for low-income persons applying to use HOT/C lanes would be developed. There would be an estimated annual cost of $3,500 to print application forms for both corridors combined.
Most new FasTrak enrollments are completed at the CSC’s website. Since verification documents (e.g., tax return or pay stubs) would have to be submitted as part of the application process, HOT/Celigible applicants would not be able to apply online. Instead, they would be instructed to obtain a special application form, attach verification documents, and mail in the application and verification documents to the CSC for processing. The cost to make the above revisions to the website would be incorporated into the software cost, included above.
The CSC application processing procedures, which is handled by CSC staff, would require several extra minutes to verify and process the HOT/C lane application; the verification would likely be done on a random spot-check basis rather than verification of each application. According to the operators of the FasTrak system, this would be done at negligible extra cost and thus is not included as a line-item in this estimate.
Transponders It is estimated that there would be a total of 1,200 new transponder accounts to implement HOT/C lanes on I-680 and 1,500 on I-580; the difference is accounted for by the slightly higher percentage of low-income eligible users on the I-580 corridor. With a current estimated cost of $35/transponder, a total transponder cost of $42,000 was derived for I-680 and $52,500 for I-580. It should be noted that transponder acquisition costs by other toll facilities in other parts of the U.S. have shown that this cost has been decreasing recently, as is often the case as new technology matures and finds a mass market. Thus, the $35/transponder estimate is conservative, and the cost is likely to be considerably less when a new system is eventually implemented.
Equipment Maintenance This estimate includes an annual maintenance cost of ten percent of the total antenna/reader system cost.
Other Administrative Costs This includes oversight, reporting and marketing. The HOT/C lanes scheme will require a modest incremental amount of additional staffing and marketing, though it would largely be subsumed into the HOT lanes budgets for those functions, because the ongoing HOT lanes program would include all of these functions. However, this estimate assumes one half-time person whose annual full-time salary and benefits are $100,000; therefore, the incremental cost of the HOT/C lanes program would be $50,000, split equally between the I-680 and I-580 projects. The same formula is used for the estimated annual marketing cost (extrapolated from the HOT lanes marketing cost estimated in the previous I-680 study); this cost is estimated at $100,000 annually, split equally between I-680 and I
580. The HOT/C lanes marketing cost would include special outreach efforts to low-income corridor communities to make them aware of the HOT/C lanes benefit and to assist them in making applications.
The purpose of this analysis is to provide a discussion of operational characteristics of several alternatives for the HOV/HOT lanes under consideration for I-580 and I-680. This analysis provides input into how the lane functions operationally as a HOT lane, HOT/C lane or simply a conventional HOV lane. With the information and resources currently available, a full operational analysis is not feasible, so a qualitative evaluation and limited quantitative evaluation of two of the 14 scenarios is provided, first for I-580, then for I-680. The two scenarios selected for study of each facility represent the extremes, the least and most usage (most extreme traffic conditions) of the proposed lane configurations under consideration. The rationale for selecting the two extreme scenarios is to establish a range of impacts for analytical purposes. In the event that a HOT or HOT/C lane project moves forward, significant additional operational analysis will need to be prepared. It should be noted, however, that the 100 Percent Eligibility HOT/C lane was not included in this analysis, because it is deemed highly unlikely to be implemented. The two scenarios selected for analysis are:
Demand volumes were initially provided for each of the two alternatives by the MTC travel demand model and then processed using the TOM economic model. Originally, the volumes were forecast as AM peak two-hour volumes, but for this operational analysis, the one-hour peak volumes were needed to better evaluate level of service, so they are estimated from the two-hour volumes. Since this analysis is a mostly qualitative analysis, the two-hour volumes were divided in half. It should be noted that assuming equal volumes for the two hours of the peak period may be more appropriate for the Year 2025 volumes, than for the Year 2000 volumes, since increasing demand in 2025 may imply a fully saturated two-hour peak at that time. The model results do not include feedback effects, such as potential diversion to other routes; however, the relative lack of alternative routes indicates that this feedback effect is likely to be minor.
It also should be noted that the volumes for both the 2000 and 2025 years appear to be lower than volumes for other recent studies using other models. Having different demand volumes from different models is certainly expected, but it is noteworthy here, because some of the volumes produced by the MTC/VTA model for the eastern edge of the study area are well below generally accepted operational capacities.
Tables 24 and 25 provide summaries from the key travel demand forecasting/TOM modeling results used in the operational analysis for the two alternatives selected for analysis. The results are for both HOT lanes and GP lanes at selected locations in the I-580 and I-680 corridors summarizing vehicle volumes during the AM one-hour period for the peak direction only, Volume/Capacity (V/C) ratios, and peak hour travel speeds. Table 24 provides results for Scenario M representing a year 2000 HOT lane with 2+ carpool policy and zero HOT/C credit Scenario M). Table 25 provides results for Scenario C representing a year 2025 HOT lane with 2-person policy and 1 in 3 trips HOT/C credit.
Table 24
Forecast Results at Selected Locations for Scenario M in Year 2000
| Location | Volumes | V/C | Travel Speed | ||||
|---|---|---|---|---|---|---|---|
| HOT | GP | Total | HOT | GP | HOT | GP | |
| I-580 | |||||||
| West of Vasco Rd | 746 | 4,872 | 5,618 | 0.43 | 0.68 | 64.81 | 61.47 |
| East of Isabel Ave | 746 | 6,288 | 7,034 | 0.43 | 0.87 | 64.80 | 51.38 |
| West of Airway Blvd | 990 | 7,432 | 8,422 | 0.57 | 1.03 | 63.95 | 37.73 |
| West of Tassajara/ Santa Rita | 753 | 5,733 | 6,486 | 0.43 | 0.80 | 64.79 | 56.41 |
| I-680 | |||||||
| South of Rte 84 | 940 | 6,910 | 7,850 | 0.54 | 1.28 | 64.22 | 17.95 |
| North of SR 237 | 874 | 7,008 | 7,882 | 0.50 | 1.30 | 59.46 | 37.71 |
| Source: Dowling Associates, Inc. 2005. | |||||||
Table 25
Forecast Results at Selected Locations for Scenario C in Year 2025
| Location | Volumes | V/C | Travel Speed | ||||
|---|---|---|---|---|---|---|---|
| HOT | GP | Total | HOT | GP | HOT | GP | |
| I-580 | |||||||
| West of Vasco Rd | 1,590 | 7,251 | 8,841 | 0.91 | 1.01 | 50.62 | 40.05 |
| East of Isabel Ave | 1,590 | 7,564 | 9,154 | 0.91 | 1.05 | 50.62 | 36.05 |
| West of Airway Blvd | 1,928 | 9,281 | 11,209 | 1.10 | 1.29 | 34.18 | 17.38 |
| West of Tassajara/ Santa Rita | 1,088 | 7,363 | 8,451 | 0.62 | 1.02 | 63.17 | 38.62 |
| I-680 | |||||||
| South of Rte 84 | 1,420 | 7,184 | 8,604 | 0.81 | 1.33 | 56.81 | 15.07 |
| North of SR 237 | 1,188 | 6,764 | 7,952 | 0.68 | 1.25 | 56.74 | 40.60 |
| Source: Dowling Associates, Inc. 2005. | |||||||
The HOT/FAIR lane access nearest the future Isabel Avenue interchange was selected for the I-580 analysis location. This is chosen primarily because the Isabel Avenue interchange is located at the crossroads of two major state routes. This location produces significant traffic transfers with the potential to develop more operational issues on both the mainline from/to the HOT/C lane than the rest of the I-580 corridor.
There are two primary considerations for operational characteristics of traffic where the accesses are for a HOT or HOT/C lane. One consideration is the general capacity for the mainline to accept the total number of vehicles entering, or to accommodate vehicles leaving. The other consideration is the number of vehicles desiring to access the HOT or HOT/C lane itself.
In general, the first consideration is less significant to address in this context, because the HOT/C lane is not significantly increasing traffic to the mainline, and the operational impacts to the mainline would have been addressed in the I-580 HOV or other freeway studies. The only notable aspect of this issue related to the HOT or HOT/C lane concept is that, with limited access points, some number of vehicles will choose to use an interchange ramp different from one they would otherwise use under an unlimited, continuous access policy. Under Scenario C, the highest volume of traffic entering I-580 to use the lane would be about 340 vehicles (at Isabel). Many of these vehicles would use this interchange anyway, even without the HOT or HOT/C lane. If it is assumed that approximately half of these would have otherwise used one of the adjacent interchanges (Airway or North Livermore) in order to enter I-580 (25 percent each interchange), this could mean that up to 170 vehicles would be diverting to the Isabel interchange for the purpose of using the HOT or HOT/C lane.
However, since vehicles entering upstream of Isabel (at North Livermore) would still be able to enter the lane after traveling the distance from North Livermore to the Isabel access point, it is reasonable to assume that some of them will do so. Assuming half of the vehicles that would otherwise use North Livermore would indeed use it, this would mean a maximum diversion of vehicles to Isabel (and consequentially an increase in the on-ramp volume at Isabel) of about 130 vehicles (170 potentially divert; all 85 Airway Boulevard vehicles would divert; half of the 85 North Livermore vehicles would divert; 85+43=128, say 130). This maximum number would represent about one additional vehicle every half minute, which would not appear to be significant.
The second consideration involves atypical traffic operations. Under ordinary circumstances, with no special lane, vehicles entering a freeway merge into the right-hand lane and they either stay in that lane or merge when they believe it is safe to do so in order to use the other lanes as they see fit. With a continuous access HOV lane, HOV vehicles also merge into the right-hand lane, then as their comfort level allows, merge to the left until they reach the HOV lane. For a limited-access lane, however, vehicles must merge within a certain limited distance in order to reach the lane before passing the access point. This increases the urgency of merging to some degree and can potentially cause more congestion than a standard HOV lane whenever a merging vehicle performs a more dramatic merging maneuver.
In order to evaluate this situation, it is important to understand what typically happens at a merge point. Some distance upstream of an on-ramp, some of the vehicles will merge to the left to avoid potential conflicts from the entering traffic. The Highway Capacity Manual (HCM) ramp junction methodology includes, as part of the steps to determine level of service, a calculation of the total volume present in Lanes 1 and 2 (the right-hand lanes). Under a typical on-ramp situation for a four-lane (one direction) freeway segment, the ratio of volume in Lanes 1 and 2 to the volume in Lanes 3 and 4 might be on the order of 40:60.
For illustrative purposes, a four-lane mainline segment is carrying a total flow of 5,000 vehicles per hour (vph). At the point where an on-ramp joins the mainline, say the estimate of volume in Lanes 1 and 2 turns out to be about 2,000 vph. This means that there is a volume of 3,000 vph in Lanes 3 and
4. So Lanes 3 and 4 are each carrying a volume of 1,500 vph and Lanes 1 and 2 are each carrying a volume of 1,000 vph in this example.
The part of this analysis that is relevant is the volume of the lane into which HOT or HOT/C lane traffic is merging. As it merges into Lane 1 (and subsequently into Lane 2), it is merging into a volume about 2/3 that of Lanes 3 and 4. This is an important observation because as volumes increase overall, the volume in Lanes 3 and 4 begins to approach capacity.
Under Scenario M at the I-580/Isabel location, the freeway volume forecast upstream of the on-ramp is 6,234, and the HOT/C component of on-ramp traffic is 276. Using a 40:60 ratio of Lanes 1-2 to 3-4 would result in lane volumes of about 1,250 vehicles per hour per lane (vphpl) and 1,870 vphpl. Adding the 276 vph to the Lanes 1-2 volumes would leave the volume well below a typical capacity of 2,000-2,200 per lane. Adding that volume to Lanes 3-4, however, would put the volume in each of those lanes at or near capacity, at about 2,150 vph. Some slowing and congestion would therefore be expected at that location. It would also be expected, as the 276 vehicles merge into Lanes 3 and 4 (causing the volume in those lanes to approach capacity), that the 1-2:3-4 split would change. Some vehicles in lanes 3-4 would observe the better operating conditions in Lanes 1-2 and would merge to the right.
Under Scenario C at I-580/Isabel, the forecast freeway volume upstream of the on-ramp is 7,056, and the HOT/C component of on-ramp traffic is 339. Under these conditions, with a higher freeway volume, a more balanced split of traffic between Lanes 1/2 and 3/4 would be expected, so a 45/55 split is assumed. This would result in 1,940 vphpl in Lanes 3 and 4 and 1,590 vphpl in Lanes 1 and
2. Adding the 339 HOT/C vehicles into Lanes 3 and 4 would result in lane volumes of 2,280 vphpl. This value is about at capacity or slightly over, and with the other non-HOT/C traffic entering the freeway flow would likely begin to break down with this volume.
In addition to the operation of the entire facility, the operation of the HOT or HOT/C lane itself must also be considered. The capacity of the HOT lane could vary widely, depending on the physical characteristics of its construction. Ordinary HOV lanes tend to operate significantly less than the usual capacity of a freeway lane because the much slower (even stopped) vehicles in the adjacent lane cause drivers to drive much more cautiously than under mixed-flow conditions. But a separated or buffered HOT or HOT/C lane could have a higher capacity if sufficient shoulder widths are included and if visual distractions of the GP lanes are somehow minimized. In any case, this evaluation assumes a HOT lane capacity of 1,800 vph.
Under Scenario M, the highest forecast volume along I-580 is 990, so such a lane would operate well under capacity. The highest forecast volume along I-580 for a special lane under Scenario C would be 1,928, which is higher than the capacity stated above. This condition could result in several potential situations:
Operational conditions along I-680 would differ from I-580. For purposes of this study, fewer access points are assumed along I-680, and fewer vehicles would be joining the HOT or HOT/C lane. If anything, vehicles would be exiting. Under peak congested conditions, vehicles entering or exiting the HOT lane experience similar operational conditions; however, during the shoulder of the peak, exiting is somewhat simpler operationally than entering. This is because exiting vehicles are already traveling at prevailing speeds and are looking ahead for gaps in slower traffic to exit, while vehicles entering a freeway find it more difficult as they must accelerate to reach the prevailing speeds, and drivers are looking backwards for available gaps. Therefore, this analysis focuses only on the capacity of the HOT/C lane itself. Similar to the I-580 special lane, the highest Scenario M forecast volume along I-680 is well below capacity at 940 vph. The highest I-680 Scenario C forecast volume for the special lane is higher, at 1,420. This volume is still well within capacity. Therefore the HOT/C lane would operate at an acceptable LOS D or better.
The Scenario C (maximum usage) demand volumes appear to be close to or slightly over capacity for I-580, but not on I-680, while the Scenario M (minimum usage) demand volumes seem to be well below capacity. It is reasonable to assume that ramp metering will be in place by the time any such lane is constructed, so it is likely the volumes could be controlled enough to keep actual volumes within capacity.
One key element to successful operations would be the physical construction of the lane, such as the (type of buffer separating the HOT lane from the adjacent lanes and width of the shoulders.) Another element would be the locations of the access points relative to the access interchanges. The location of entry points should be as far as is feasible from the interchange that nominally serves the lane, but upstream enough from the next interchange’s on-ramp.
By focusing the operational analysis on the two alternatives representing the extremes of the proposed HOT/C lane configurations (least usage and most usage), the analysis has bracketed the range of potential impacts. The analysis shows that the concepts studied in the report would function adequately for all the scenarios, using the proposed access locations, HOV policies and future transportation network and land use assumptions. Some of the scenarios, specifically 2025 with HOV-2 free and generous HOT/C crediting policy, may strain the lane and produce service levels worse that LOS D, but this performance would still be better than the freeway mainline.
While there are no specific methods for evaluating LOS on HOT lanes, there are concepts in the HCM used in freeway operations that could be applied to single lane HOT lanes. Freeway LOS is related to vehicle density and this could be simply applied to HOT lanes using the V/C ratio measure. If the V/C ratio for a given period exceeds 0.93, the facility would transition from operating at LOS D to LOS
E. Some monitoring system would be implemented (electronic vehicle counting) when the HOT lane is operational to measure usage and adjust the tolls to maintain the desired operating LOS.
This chapter describes the key findings of the HOT/C lanes alternatives and presents conclusions based on the study’s analysis. This chapter also presents the challenges associated with implementation of the HOT/C lanes proposal.
The implementation of HOT/C lanes on I-580 and I-680, as an additional feature of a HOT lanes program, faces several major challenges. A HOT/C lanes system on both freeways would need to satisfactorily address the following issues.
Alsnih, Rahaf and Peter R. Stopher. ‘Environmental Justice Applications in Transport: The International Perspective,” Handbook of Transport and the Environment, Elsevier (www.elsevier.com), pp. 565-584. 2003.
Association of Bay Area Governments (ABAG). Projections 2000. December 1999. BART. “Patron Survey.“ 1998. Buckeye, Kenneth R. and Lee W. Munnich, Jr. Value Pricing Outreach and Education: Key Steps in
Reaching High Occupancy Toll Lane Consensus in Minnesota. TRB Paper No. 04-3169. California Department of Transportation District 4, “HOV Lanes in the Bay Area.” 2002. California Department of Transportation District 4, Office of Highway Operations. Information
Memorandum: Year 2002 Bay Area Freeway Congestion Data.
DeCorla-Souza, Patrick. FAIR Lanes: A New Approach to Managing Traffic Congestion.” ITS Quarterly, Spring 2000 Issue. Vol. VIII Number 2.
DeCorla-Souza, Patrick. Clearing Existing Freeway Bottlenecks with Fast and Intertwined Regular Networks: Costs, Benefits and Revenues. Prepared for presentation at the TRB Annual Meeting in January 2004. Paper No. 04-3993. November 15, 2003.
DeCorla-Souza, Patrick and William G. Barker. “Innovative Public-Private Partnership Models for Road Pricing/BRT Initiatives.” Journal of Public Transportation, Vol. 8, No. 1. 2005.
DeCorla-Souza, Patrick. “FAST Miles: Thinking Outside the HOT - New Multimodal Strategy Guarantees Congestion-Free Highways.” Urban Transportation Monitor. June2005.
Eno Transportation Foundation. The Role of Fast and Intertwined Regular (FAIR) Lanes in the New York Metropolitan Region. Conference on September 6, 2001 in New York, New York.
Litman, Todd. Evaluating Transportation Equity: Methods for Incorporating Distributional Impacts into Transport Planning. Victoria Transport Policy Institute. March 30, 2005.
Parsons Brinckerhoff, ECONorthwest, and TJKM Transportation Consultants. Interstate 680 Value Pricing Feasibility Study. Prepared for Alameda County Congestion Management Agency, September 2003.
San Joaquin Partnership and San Joaquin Council of Governments. “Altamont Pass Commuter Survey.” October 2000.
Sullivan, Edward et al. Evaluating the Impacts of the SR 91 Variable-Toll Express Lane Facility, Final Report. State of California Department of Transportation. May 1998.
SR 91 Express Lanes, available: http://www.91expresslanes.com.
Orange County Transportation Authority, available: http://www.octa.net.
Minnesota Department of Transportation MnPASS Project, available: http://www.mnpass.net.
San Diego Association of Governments, available: http://www.sandag.cog.ca.us. I-15 FasTrak Online, available: http://argo.sandag.org/fastrak//faq.html. Metropolitan Transit Authority of Harris County, Texas, available: http://www.hou
metro.harris.tx.us/services/quickride.asp. Interstate 10 Katy Freeway, available: http://www.katyfreeway.org/.
E-Z Pass New Jersey Customer Service Center, available:
http://www.ezpassnj.com/static/info/discount.shtml. The Port Authority of New York and New Jersey, available: http://www.panynj.gov/tbt/TOLL_RATES.pdf.
Hubert H. Humphrey Institute of Public Affairs, University of Minnesota (Lee County, Florida bridges), available: http://www.hhh.umn.edu/centers/slp/projects/conpric/projects/leecty.htm.
This section presents an overview of the state-of-the-art of value pricing, describing the concept of value pricing, followed by examples of implemented pricing projects, public perceptions on value pricing, and opportunities and challenges related to the this study.
“Value pricing” (also referred to as “congestion pricing” or “variable pricing”) is a method that seeks to address urban highway congestion. The concept applies simple supply-and-demand economics to transportation operations, using price to signal the value of meeting traffic demand, especially during peak traffic time periods. Many aspects of our economy apply some version of the principle that access to a facility or service should reflect the demand placed on it at different times. Telephone service, for example, charges different rates for their prices by time of day or season - in some cases, seeking to shift demand from peak periods to off-peak, in order to improve efficient utilization of the facility and maximize revenue. Pricing in those contexts seeks to allocate scarce capital assets to meet demand over time. In that sense, value pricing on roads is simply a way to improve the management of limited road capacity by applying simple supply-and-demand principles. Other familiar examples are to be found in airline, hotel, electricity and movie ticket prices.
The full cost of an individual trip on a congested road includes not just a traveler’s own time and vehicle operating costs, but also the costs that each traveler imposes on all other travelers by adding to the overall level of congestion. A congestion price is a user charge based on a user’s perceived cost when entering the traffic stream and the actual congestion cost created by the traveler’s entry onto the system. Road pricing can result in more efficient use of limited road capacity by encouraging those who value their trips at less than their full cost to shift to off-peak periods, mass transit, carpooling, and/or less congested routes.
Determining optimal congestion prices is difficult. Estimates can be based on the traffic engineering research that deals with the relationship between travel delays and traffic volume. Analysts have derived estimates of current “optimal” congestion prices on the order of 15 to 30 cents per vehicle mile of travel on congested highways and expressways; off-peak prices are in the range of six cents per vehicle mile. However, actual optimal prices could vary widely for each local context, based on degree of congestion, local incomes, availability of alternate routes or modes, or other factors.
Implementation of value pricing may take a number of forms, but all share the objective of reducing traffic congestion. Types of value pricing applications include:
Examples of where single-facility pricing have been implemented include the State Route (SR) 91 Express Lanes in Orange County, California (opened in late 1995), the Interstate 15 (I-15) Toll Lanes in San Diego, California (opened in 1997), the New York and New Jersey metropolitan bridges and tunnels (instituted in 2001), and the I-394 MnPass Hot Lanes Project in Minneapolis, Minnesota (opened in May 2005).
Multiple-facility or area pricing has been implemented or is planned in a number of locations overseas, but not yet in the United States. Singapore, which was the first to implement value pricing in 1975, has a central city electronic toll collection system, as does downtown London, which implemented its system in 2003. The Netherlands, Norway, Sweden and New Zealand are also seriously undertaking pricing projects.
To provide a comparison for this study, which examines the application of single-facility pricing on I580 and I-680 in the San Francisco Bay Area, examples of value pricing projects implemented in the United States are described below, with information regarding:
This 10-mile privately funded and managed toll facility opened in December 1995. It consists of the four inside lanes of a freeway corridor, two in each direction, which are separated by a pyloned buffer from adjacent lanes. The remainder of the freeway is four GP lanes in each direction. There are no entrances or exits to the Express Lanes other than at the end points. In January 2003 the private company, California Private Transportation Company (CPTC), sold the facility to a public agency, the Orange County Transportation Authority (OCTA), for $207.5 million, but the private firm has continued as the facility operator.
The SR 91 freeway is extremely congested during peak commute hours, with heavy traffic in the morning in the westbound direction (from Riverside County to Orange County) and in the eastbound direction in the afternoon and evening. The SR 91 Express Lanes charge users between $1.00 and $6.25 per trip ($0.625 per mile) depending on the time of day, to reflect the level of congestion delay avoided as compared to the adjacent free lanes. Since the Express Lanes were opened, tolls have been raised a total of six times. Once they are adjusted, tolls are frozen for at least six months. High occupancy vehicles (HOVs) with three or more occupants are allowed to travel for free, except when traveling eastbound, Monday through Friday between the hours of 4:00PM and 6:00PM. During that peak time, 3+ HOVs receive a 50 percent discount on the posted toll. This policy also applies to motorcycles. Large trucks with more than two axles are not allowed on the Express Lanes.
This project is the first fully electronic and automated toll road in the United States. All vehicles using the Express Lanes must have a transponder (similar to the San Francisco Bay Area’s FasTrak), including 3+ HOVs which use a separately designated entrance/access lane. The Express Lanes are physically separated from the parallel unpriced freeway by a 4-foot wide painted buffer area, consisting of two sets of double yellow lines and permanently placed 24-inch plastic traffic pylons located at 20-foot intervals. The “wall” of pylons makes it difficult for violators to traverse the painted buffer. As a part of an agreement with the State of California, the California Highway Patrol (CHP) provides enforcement services on the Express Lanes, including enforcement of traffic laws pertaining to speed, carpool, and toll evasion violations. In addition to officers stationed at the entrances to the Express Lanes, photo surveillance is also used for enforcement, whereby license plate photos are taken of all vehicles entering the Express Lanes to identify toll violators.
New state legislation sponsored by OCTA and recently signed into law, stipulates that toll revenue can only be spent on general toll road operating expenses, ongoing maintenance to the lanes, and improvements in the 91 Freeway corridor. When OCTA acquired ownership of the Express Lanes, the non-compete clause with the California Department of Transportation (Caltrans) was removed, allowing improvements to be made on the unpriced freeway lanes. Caltrans completed construction of an auxiliary lane on the westbound SR 91 freeway between the Riverside County line and the Eastern Toll Road (SR 241). OCTA is currently examining additional improvements to the corridor to address increased traffic congestion.
In December 1996 an existing 8-mile, barrier-separated, underutilized 2-lane reversible HOV facility was converted to high-occupancy toll (HOT) lanes. At the beginning of the experiment, a limited number of drivers were offered the opportunity to purchase “Express Pass” permits for a monthly fee of $50, which was then increased over several months to $70 due to high demand. The permits allowed a single-occupant vehicle to use the HOV lanes during peak hours. Due to the popularity of the program, the demand for permits far exceeded the number sold.
Electronic tolling was implemented in late 1997, and in 1998 the program began using “dynamic pricing.” Dynamic pricing means that, instead of a predetermined toll rate, the rate fluctuates according to the amount of traffic actually on the road during that particular time of day. Tolls may change as often as every six minutes. An electronic message board displays the fare to drivers at the entrance. The average peak-period price is approximately $4.00 ($0.50 per mile), though on rare occasions (usually when a serious traffic incident causes severe congestion) the price can be as high as $8.00, the maximum allowed. HOVs and motorcycles continue to ride for free. Commercial trucks are not allowed on the HOT lanes.
By the nature of the reversible operation, the HOT lanes are separated from adjacent lanes by permanent concrete barriers, with ingress and egress only available on either end. The HOT lanes are open to southbound traffic in the morning between 5:00AM and 11:00AM, closed for up to an hour between 11:00AM and 12:00PM to reverse directions, and reopened to northbound traffic between 12:00PM and 7:00PM. The facility is closed at night on weekdays and open 24 hours during the weekend. CHP officers, working voluntary overtime shifts, provide enforcement services on the HOT lanes. The officers stationed at the entrance of the toll zone visually inspect carpool vehicles and FasTrak customers. An electronic monitor tells officers if a solo motorist is a qualified FasTrak customer who has paid a toll.
The approximately $2.4 million in annual toll revenues collected from the HOT lanes are used to fund operations, enforcement, planning studies, and bus service improvements in the corridor. Currently, the San Diego Association of Governments (SANDAG) is undertaking a $750 million I-15 Managed Lanes Project, including a 12-mile extension of the HOT lanes on I-15, for a total of 20 miles at build-out; four-lane, two-way reversible operations; and movable barriers. The project, which is being developed in three phases, began construction in November 2003 and is planned for completion by 2010-2015.
Minnesota’s Department of Transportation opened its first toll lane in May 2005 on I-394. The toll operation converts the existing I-394 carpool-bus lanes into pay lanes, allowing solo drivers to pay a fee to use the express lanes between the western suburbs and downtown Minneapolis. Specifically, the MnPASS toll lanes extend for approximately eleven miles on I-394 from I-94 to just west of I-494. The lane separation between HOT and general purpose lanes is striping for approximately eight miles and a reversible physical barrier for the remaining three miles. Initial reports indicate that it is performing well and has been accepted by the public, but it is too early in the implementation phase to make any evaluation.
The project was developed and completed through a public/private partnership involving the State of Minnesota and service vendor Wilbur Smith Associates. The private firm will fund 20 percent of the project's estimated $10 million price tag.17
MnPASS Toll Lanes are special-use "express" lanes that provide additional capacity. Drivers can pay a toll to use the MnPASS lane to achieve more reliable travel times, or they can choose to use the adjacent non-toll lanes.
The lanes will remain free for carpools, bus riders and motorcycles. MnPASS drivers can lease a small electronic transponder that attaches to their windshield behind the rear view mirror. The toll is automatically deducted from their pre-paid Mn/PASS account, by toll recording equipment located on the road. Fees may vary in amount by time of day and the level of traffic congestion. The prices are dynamically set as often as every three minutes to keep traffic flowing in the MnPASS lanes. Thus far, full trip rates from I-494 to I-94 have ranged from $0.25 to $4.50 ($0.06 to $0.56 per mile).
In terms of enforcement, two kinds of violators will be ticketed $130 per offense: drivers using the lanes without opening a toll account and those crossing the double white line that will divide the toll lanes from GP lanes. The Minnesota Department of Transportation has budgeted $200,000 for enforcement by officers during the first year of the toll lanes.
Although the goal of the project is to maximize capacity in the I-394 corridor, MnPASS provides drivers with a choice, helps control congestion on metro area roadways and provides a new source of revenue for transportation.
Mn/DOT is working on a program that will engage private partners to share in the cost of developing toll lanes on other congested routes. Once these new lanes open, MnPASS transponders will work for them as well.
Similar to the San Diego program, in January 1998 the Metropolitan Transit Authority and Texas Department of Transportation (TXDOT) opened a 13-mile reversible, barrier-separated HOV lane on the Katy Freeway (Interstate 10) to two-person carpools for a fee during the most heavily congested AM and PM peak hours. Ingress and egress are at either end of the HOV lane (no intermediate access).
Carpools of three or more ride for free, and single-occupant vehicles are not eligible to use the lane. Previously, carpools of two or more were permitted to ride for free, but the policy was changed to three-plus to reduce traffic on the HOV lane due to overcrowding by two-person carpools. The Quickride lane uses windshield transponders to charge $2.00 per trip.
The reversible HOV/HOT lane is separated from GP freeway lanes by three-foot high concrete barriers. In support of police enforcement, drivers are asked to report HOV lane violations such as insufficient occupancy, speeding or improper passing by calling the HERO Hotline at 713-921-HERO (4376). Drivers are requested to provide information such as vehicle license plate number, vehicle description, date, location and time the violation occurred.
Based on the experience of the Katy Freeway, Houston extended the Quickride application to another HOV lane facility on US 290, also allowing two-person carpools to buy into the lane. It has also begun reconstructing the Katy Freeway and considering expanding the toll lanes. Toll revenues are used for toll lane operating and maintenance costs.
In November 1997 the Florida Department of Transportation installed electronic toll collection on two existing toll bridges (Cape Coral and Midpoint Bridges) and the next year introduced a 50 percent discount for use during non-peak traffic hours. Under the pricing plan, a 50 percent toll discount is provided for trips made during the half-hour period before the morning peak (7:00AM – 9:00AM) and in the two-hour period following the morning period. In the evening, the discount period is two hours before the evening peak (4:00PM – 6:30PM) and one-half hour after the peak. The pricing strategy has caused drivers to shift trips to the shoulders of the peak, leading to improved service for bridge users. Lee County is now considering a priced “queue-jumping” lane.
In March 2001 the Port Authority of New York and New Jersey instituted a mild form of variable pricing for all bridges and tunnels between the two states. The price variations were available only to users of electronic toll collection equipment. The policy had a dual purpose: 1) encourage use of electronic transponders to ease collection and improve traffic flow; 2) encourage a shift in travel from the peak period to the shoulder or off-peak. The toll structure is: $4 off-peak, $5 peak, $6 for cash payers. Preliminary indications showed a modest shift (about 4-7 percent) shift from peak to off-peak trips, but a significant increase (from 46 percent of transactions before variable pricing to 79 percent after) in the use of electronic toll technology and in carpool transactions (21 percent). The New Jersey Turnpike instituted a similar program with slight discounts for those using electronic transponders during both peak and off-peak periods. The electronic toll rate is generally 25 percent lower than the cash rate during off-peak periods, and generally 15 percent lower than the cash rate during peak periods (between 7:00AM - 9:00AM and 4:30PM - 6:30PM on weekdays, and all day on weekends). Analysis is underway to assess the long-range impact of these programs.
Other applications of value pricing in the United States, albeit with very modest variations in price, include the toll roads in Orange County (the 73, 241, 261 and 133 Toll Roads). These toll roads are owned and maintained by Caltrans, but managed by two legally separate government agencies. The San Joaquin Hill Transportation Corridor Agency manages the 73 Toll Road and the Foothill/Eastern Transportation Corridor Agency oversees the 241, 261 and 133 Toll Roads. Tolls on these facilities vary between peak and off-peak, as well as between FasTrak and cash payment. For example, the toll structure on the 73 Toll Road (Catalina View Mainline) is: $2.50 FasTrak off-peak, $3.00 FasTrak peak (Monday-Friday: northbound 7:00AM – 9:00AM, southbound 4:00PM – 7:00PM), $3.00 cash off-peak, and $3.50 cash peak.
In addition to the implemented projects there have been a number of pre-implementation studies done around the nation. They include major studies in the San Francisco Bay Area, Santa Cruz, Los Angeles, New York City, Colorado and Oregon.
As value pricing on roads is still a relatively new concept in the United States, public perceptions on this issue are mixed but shifting towards greater acceptance as the public actually experiences the facilities. Public opinion of toll facilities in Southern California has been generally positive, and the number of transponder accounts continues to increase for these facilities, including the SR 91 Express Lanes, I-15 HOT Lanes, and toll roads in Orange County. In Lee County, Florida, more than 70 percent of respondents in a 1999 user survey favored the variable pricing program on the toll bridges. Early efforts in the 1990’s to implement value pricing in Minnesota were met with local opposition. However, the emergence of political champions from a Value Pricing Task Force in Minnesota enabled the passage of 2003 legislation supporting conversion of HOV lanes into HOT lanes, specifically on above-mentioned I-394 in Minneapolis.
Studies conducted for SR 91 Express Lanes show that frequency of use was somewhat correlated with income, but there were users at all incomes. While many high-income travelers use the Express Lanes frequently, a substantial number also report they infrequently or never use the toll lanes. In addition, some low-income travelers use the toll lanes frequently and more use the lanes with lower frequency. Results of public outreach and survey research for the I-15 HOT Lanes indicate that congestion pricing is considered effective and fair by all income groups. Equity was not perceived to be a problematic issue for either users or non-users; and there were no significant differences among the survey responses based on income or ethnicity.
In the mid-Atlantic region, there has been opposition to value pricing on the basis of equity, until recently. According to a Washington Post article on December 29, 2003, “AAA dubbed such toll lanes ‘Lexus lanes,’ favoring more affluent motorists” and “Former Maryland governor Parris N. Glendening (D) canceled the region's only study of such lanes in 2001 after calling them economically unfair.”18 However, the article also states that, “…with money tight and traffic growing worse, HOT lanes are now widely viewed as one of the most feasible, affordable ways to better manage, if not ease, traffic congestion in the short term while generating money for long-term relief.” AAA has reconsidered its position on value pricing and the Maryland and Virginia state governments are now promoting HOT lanes on various highways in the region, though none is yet in operation. The Governor of Maryland, Robert Ehrlich, is favorably disposed to value pricing and is promoting further studies and application of the concept.
Benefits of value pricing to users include improved reliability by maintaining free flow on the toll roads and travel time savings. HOT lanes in California and Texas also gained support among motorists who did not use them regularly, because they were seen as diverting more vehicles from the general purpose lanes.19
Based on study findings, travelers were selective in deciding when and under what conditions to use the SR 91 Express Lanes. About half of the customers used the lanes once a week or less. According to focus groups conducted for the toll roads in Orange County, drivers like knowing that the toll roads are available, even though they do not use them every day.
According to surveys conducted for toll facilities in Southern California, female commuters are significantly more likely than male commuters to be frequent users. Safety and reliability are cited as important factors to this trend. The 1999 surveys in Lee County, Florida also show women are more likely to take advantage of the variable pricing program on the toll bridges.
Based on the state-of-the-art review of value pricing, a summary of opportunities and challenges pertinent to this study are presented below.
Many recent forces and policy goals have caused transportation authorities to consider value pricing. These include:
Furthermore, in February 2003 the Reason Foundation issued a report advocating a nationwide network of HOT lanes.20 The Reason Foundation proposal postulates a HOT lane network in eight major metropolitan areas, including conversion of existing HOV lanes and new facilities to HOT/Bus Rapid Transit (BRT) lanes. The proposed benefits of a HOT lane network include: “congestion insurance” for all drivers in the metropolitan area, allowing them the option to bypass congestion when needed; greater productivity than underutilized HOV lanes; and a major new funding source for urban transportation infrastructure.21
The “Congestion Pricing Pilot Program” was established initially by the Intermodal Surface Transportation Efficiency Act (ISTEA) in 1991 and continued in the Value Pricing Program in the subsequent federal authorization legislation in 1998, known as TEA-21. Provisions on road pricing in the versions of the latest federal transportation reauthorization legislation propose to: reinstate the limit to the number of projects to not more than 25 projects, require that any project that involves collection of tolls should include a program to “permit low-income drivers to pay a reduced toll amount,” and require that $3 million of funds made available for the program be available “only for congestion pricing pilot projects that do not involve highway tolls.” The bill is pending Senate-House conference committee review, agreement, and the President's signature or veto.
The challenges and issues related to value pricing on roads apply equally to any HOT lanes proposal, including the HOT/C lanes variants. The HOT/C lanes concept adds further issues.
The methodology for the forecasting of HOT/C lanes followed a two-phase approach that included both travel demand modeling and economic analysis. The travel demand modeling provided input to the economic analysis. The economic analysis resulted in toll structures that were tested using the demand model.
The forecasting methodology used the MTC/VTA model as modified for use in the previous I-680 Value Pricing Feasibility Study (2003). The model has network and land use assumptions for 2000 and 2025. The networks are consistent with the MTC 2001 Regional Transportation Plan (the 2005 RTP was not yet approved at the time that study was completed) and the socio-demographic data (land use) is based on ABAG Projections 2000. Enhancements were made to the mode choice process in order to test the HOT/C lanes concept with various crediting levels for low-income users.
Alternatives for testing with the travel demand model and subsequent Toll Optimization Model (TOM) were defined and are described in Chapter 4. The scenarios are based on the Alternatives Definition. The focus in comparing alternatives was on how economic features impact travel demand and behavior. The primary objective was to develop alternatives that are distinct enough to yield meaningful results for testing the HOT/C lanes concept. This entails creating a range of results by providing a high or generous credit on one end of the spectrum and a very low credit at the other end. The baseline run assumes limited access in terms of location, but all vehicle classes (including single-occupant vehicles and HOVs) may use the lane with no tolls; this is a theoretical configuration that will actually not be implemented in the field.
This configuration allows for full demand to be measured and provides input to the subsequent economic modeling (hereafter called the "seed run"). The 2000 and 2025 alternatives include:
2000
2025
The alternatives include the uniform features and assumptions described in Chapter 4 as appropriate for each alternative. These include corridor segments, lane separations, ingress, egress, toll collection, enforcement, credits and HOV definitions.
In addition to the alternatives described above, a number of iterations are required for each active alternative between the demand model and the TOM model in order to derive optimal tolling parameters that are consistent with the regional model.
Limited access locations were previously identified for the I-680 corridor during the recently completed I-680 Value Pricing Feasibility Study. The access locations included entry and exit points at each end of the corridor and one intermediate access location for each direction of travel. Table B-1 describes the access locations on I-680. These access locations were determined to be suitable for testing of the HOT/C lanes concept on I-680.
Table B-1
HOT Lanes Access Locations on I-680
| Location | Access | Access Type | |
|---|---|---|---|
| SR 84 (Vallecitos Road) | west-bound on | east-bound off | Start - wb / End - eb |
| Auto Mall Parkway/ Durham | west-bound on west-bound off |
east-bound off east-bound on |
Intermediate Access/Egress |
| Landess Ave/Montague Exp | west-bound off | east-bound on | Start - eb / End - wb |
| Source: Dowling Associates, Inc. 2005 | |||
An evaluation was conducted to determine suitable access locations for the I-580 portion of the HOT/C lanes. The evaluation relied on existing ramp counts supplemented by a select link analysis to determine key travel paths. The I-580 corridor has numerous interchanges with an additional one planned at Isabel Avenue in the future. Due to the characteristics of the corridor, the analysis identified a number of possible access locations. Caltrans staff provided input on the final selection of access locations. The access locations on I-580 are identified in Table B-2.
Table B-2
HOT Lanes Access Locations on I-580
| Location | Access | Access Type | |
|---|---|---|---|
| Greenville Road | west-bound on | east-bound off | Start - westbound/End - eastbound |
| Vasco Road | west-bound on west-bound off |
east-bound off | Intermediate Access/Egress |
| Isabel Avenue | west-bound on west-bound off |
east-bound off east-bound on |
Intermediate Access/Egress |
| Tassajara/Santa Rita Road | west-bound on west-bound off |
east-bound on | Intermediate Access/Egress |
| Hopyard/ Dougherty Road | east-bound on | Start–eastbound | |
| I-580/I-680 | west-bound off | End–westbound | |
| Source: Dowling Associates, Inc. 2005 | |||
The existing year 2000 MTC model was compared to counts in the study area and validated to provide a closer match. The validation was conducted for the AM peak 2-hour period. Table B-3 shows a summary comparison of counts and model results at selected locations on both the I-580 and I-680 corridors. During the AM peak 2-hour period, the results show the model is predicting relatively close to actual traffic counts in the overall corridors while there is generally greater variation on individual links.
Table B-3
Model Validation Results
| Location | Peak Direction – West/South-Bound | |||
|---|---|---|---|---|
| Count | Volume | Difference | % Difference | |
| I-580 West of Vasco Road | 12,155 | 11,683 | -472 | -3.89% |
| I-580 West of Airway Blvd | 16,331 | 15,839 | -492 | -3.02% |
| I-680 North of Rte 84 | 9,160 | 11,302 | 2,142 | 23.38% |
| I-680 North of Mission Blvd | 11,873 | 12,625 | 752 | 6.33% |
| I-680 North of Scott Creek Road | 14,532 | 13,174 | -1,358 | -9.34% |
| Total | 64,052 | 64,623 | 571 | 0.89% |
| Location | Peak Direction – East/North-Bound | |||
| Count | Volume | Difference | % Difference | |
| I-580 West of Vasco Road | 9,995 | 7,912 | -2,083 | -20.84% |
| I-580 West of Airway Blvd | 11,165 | 10,585 | -580 | -5.20% |
| I-680 North of Rte 84 | 6,146 | 6,599 | 453 | 7.37% |
| I-680 North of Mission Blvd | 6,996 | 7,600 | 604 | 0.00% |
| I-680 North of Scott Creek Road | 10,516 | 11,086 | 570 | 5.42% |
| Total | 44,819 | 43,782 | -1,037 | -2.31% |
| Source: Dowling Associates, Inc. 2005 | ||||
The MTC/VTA demand model was implemented for 2000 and 2025 conditions for all non-toll alternatives. The non-toll alternatives included no-build, HOV, and full demand (this configuration operates as a separate one-lane facility that functions as a GP lane with limited access and was modeled purely for seeding of the HOT/C lane). These alternatives were primarily run for comparison and as seed runs for the economic modeling. The tolled alternatives, including HOV/Toll and HOT/C alternatives were analyzed using the economic modeling. The following tables compare key results, with Table B-4 showing corridor travel times and Table B-5 showing forecast segment volumes, for the non-tolled alternatives for 2000 and 2025 for the AM 2-hour period. The tables include separate summary results for both the HOV and the GP lanes.
Table B-4
Forecasting Results – AM Peak 2-Hour Travel Time (in minutes)
| Year | Corridor Travel Times | I-580 | |||
|---|---|---|---|---|---|
| WB | EB | ||||
| Restricted Use Lane | General Purpose Lanes | Restricted Use Lane | General Purpose Lanes | ||
| 2000 | No-Build | 0.0 | 13.6 | 0.0 | 10.6 |
| HOV | 10.3 | 12.0 | 10.2 | 10.3 | |
| Full Demand | 12.7 | 11.8 | 10.5 | 10.2 | |
| 2025 | No-Build | 0.0 | 27.0 | 0.0 | 12.3 |
| HOV | 14.0 | 18.7 | 10.2 | 11.3 | |
| Full Demand | 37.0 | 18.1 | 12.8 | 11.1 | |
| Year | Corridor Travel Times | I-680 | |||
| SB | NB | ||||
| Restricted Use Lane | General Purpose Lanes | Restricted Use Lane | General Purpose Lanes | ||
| 2000 | No-Build | 49.1 | 36.1 | 0.0 | 23.9 |
| HOV | 30.2 | 39.7 | 20.0 | 23.5 | |
| Full Demand | 43.9 | 38.3 | 20.1 | 23.2 | |
| 2025 | No-Build | 33.8 | 34.3 | 0.0 | 31.2 |
| HOV | 35.6 | 46.7 | 21.3 | 29.4 | |
| Full Demand | 59.0 | 44.0 | 23.8 | 28.2 | |
| Source: Dowling Associates, Inc. 2005 | |||||
Table B-5
Forecasting Results – AM Peak 2-Hour Segment Volumes
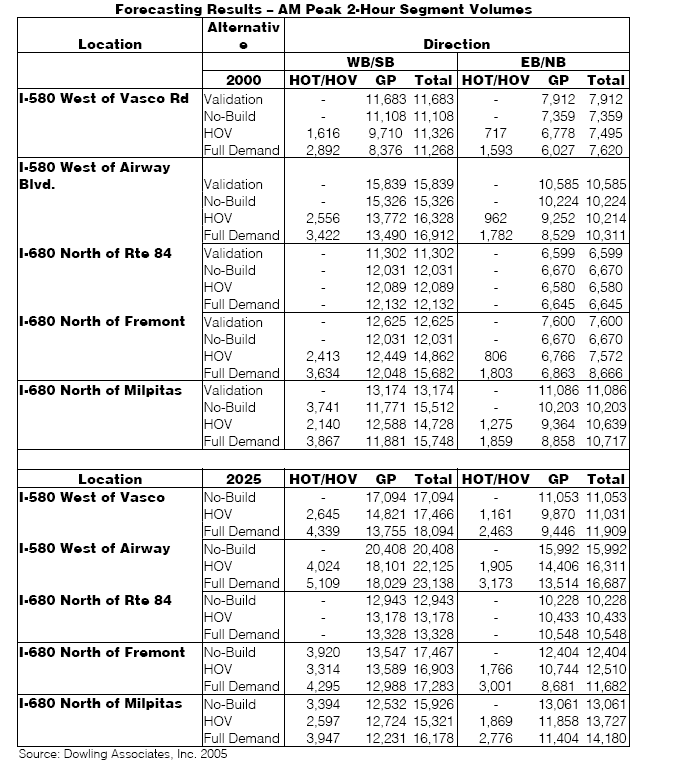

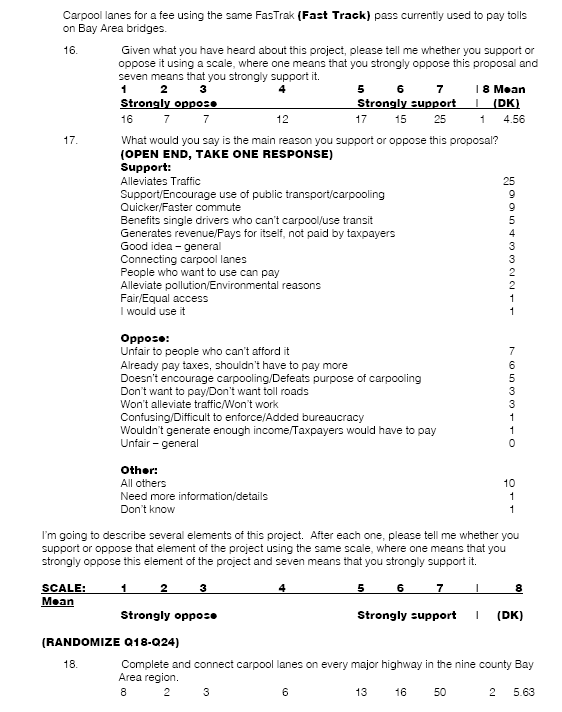
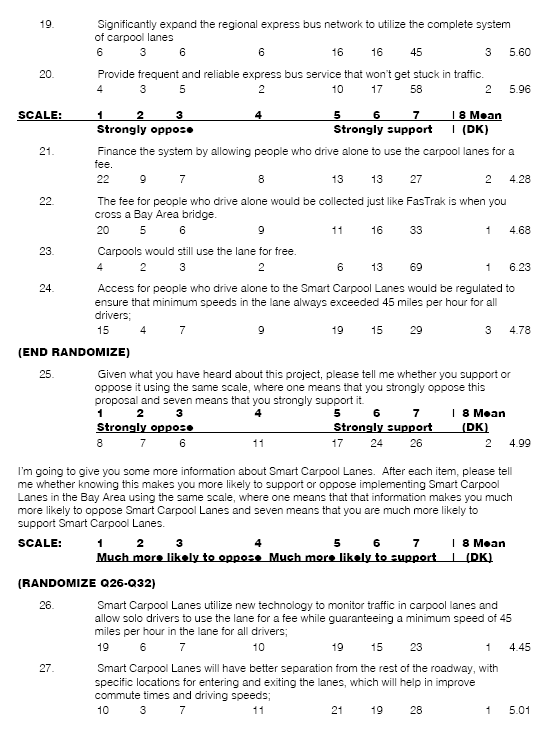
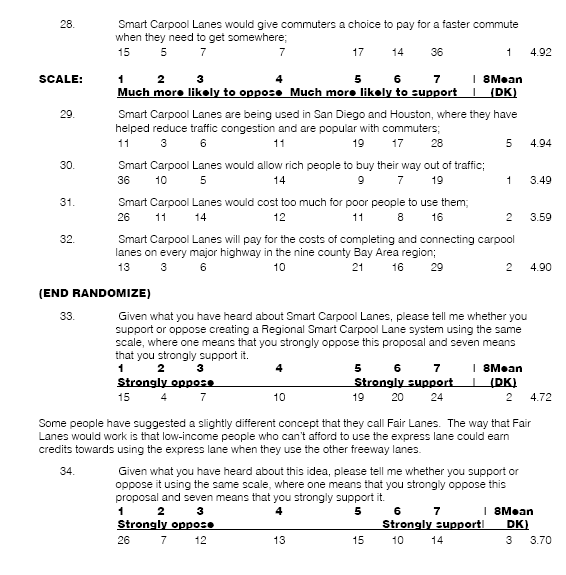
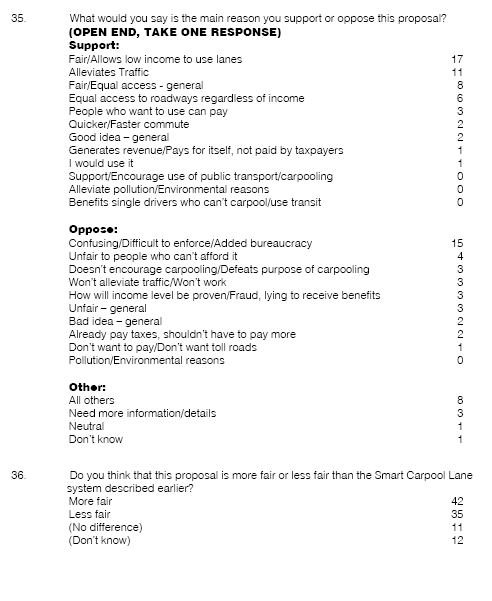
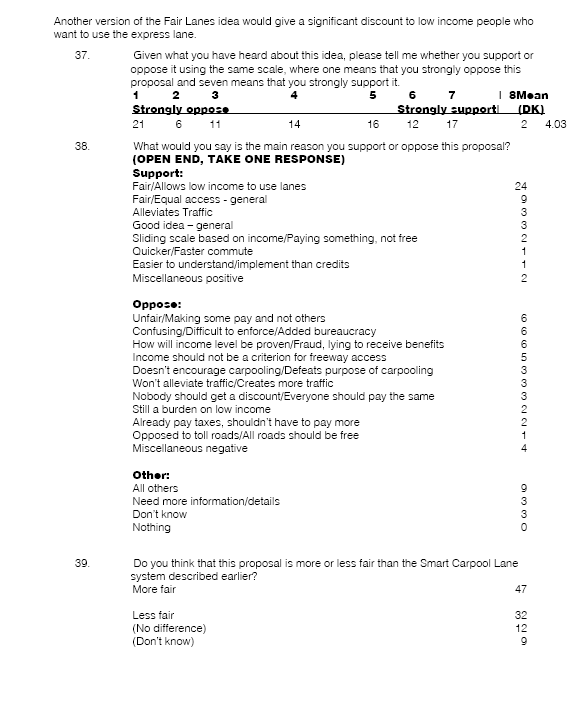
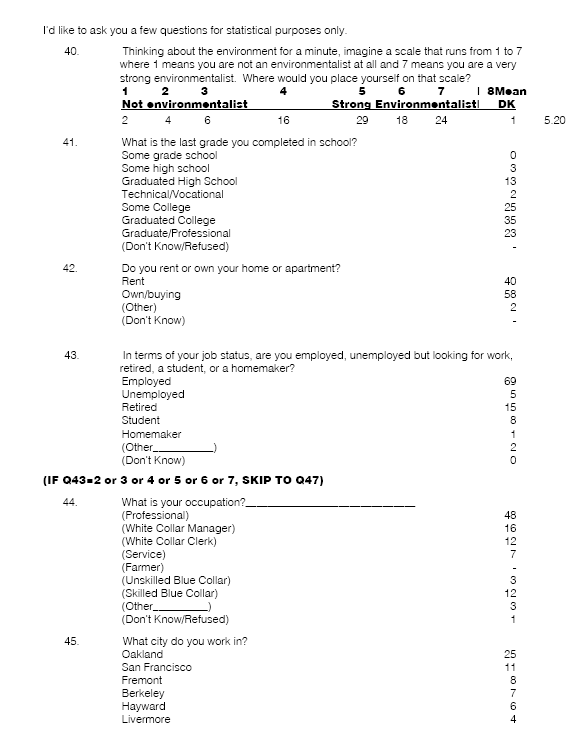
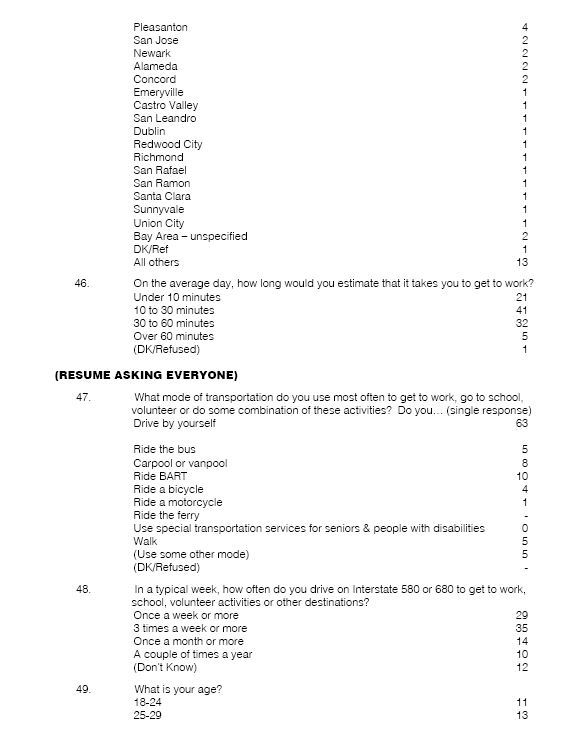
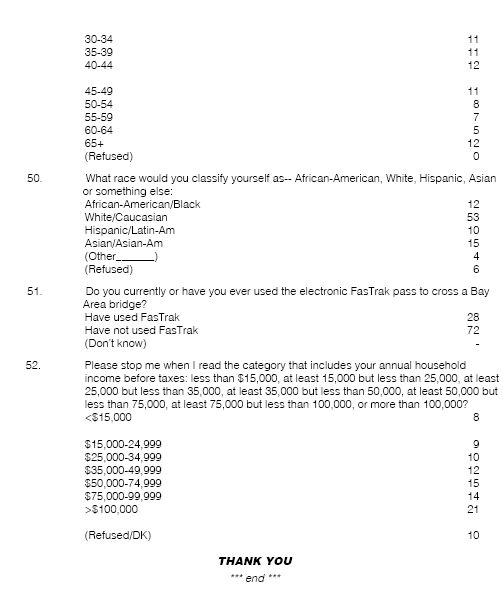
1 DeCorla-Souza, Patrick. "FAIR Lanes: A New Approach to Managing Traffic Congestion." ITS Quarterly, Spring 2000 Issue. Vol. VIII Number 2.
2 DeCorla-Souza, Patrick. Clearing Existing Freeway Bottlenecks with Fast and Intertwined Regular Networks: Costs, Benefits and Revenues. Prepared for presentation at the TRB Annual Meeting in January 2004. Paper No. 04-3993. November 15, 2003.
3 Eno Transportation Foundation. The Role of Fast and Intertwined Regular (FAIR) Lanes in the New York Metropolitan Region. Conference on September 6, 2001 in New York, New York.
4 "ALA 580 KP 15.6-28.9 (PM 936-17.9) HOV Lanes, EA: 29080K," Caltrans, 2001.
5 "I-680 Value Pricing Study Operations Analysis," Final Report, Alameda County Congestion Management Agency, September 19, 2003.
6 "Information Memorandum: Year 2001 Bay Area Freeway Congestion Data," Caltrans District 4 Office of Highway Operations.
7 "Information Memorandum: Year 2002 Bay Area Freeway Congestion Data," Caltrans District 4 Office of Highway Operations.
8 "HOV Lanes in the Bay Area," Caltrans District 4, 2002.
9 "2002 Annual Average Daily Truck Traffic on the California State Highway System," Caltrans, February 2004.
10 I-680 Value Pricing Study Feasibility Study, Alameda County Congestion Management Agency, 2003.
11 Phone conversation with ACE Commuter Rail representative, May 3, 2004.
12 "Quarterly Weekday Average Exits," 4th quarter of fiscal year 2002-03, BART, http://www.bart.gov/docs/stationexits.pdf
13 BART station data, March 2004.
14 Egalitarianism means treating everybody equally, regardless of factors such as race, gender or income.
15 Environmental justice is defined as the "equitable distribution of both negative and positive impacts across racial, ethnic, and income groups, with the environment defined to incorporate ecological, economic, and social effects" (Alsnih and Stoper, 2003).
16 The regional model runs which were utilized by ECONorthwest were received on 9/20/2004 (2025 run) and 10/15/2004 (2000 run) from Dowling and Associates
17 http://www.mnpass.org/394/index.html
18 A 2nd Look At Snubbed HOT Lanes: Traffic-Fighting Idea Gains Favor in Region, by Katherine Shaver, Washington Post staff writer, December 29, 2003.
20 HOT Networks: A New Plan for Congestion Relief and Better Transit, by Robert W. Poole, Jr. and C. Kenneth Orski, February 2003.
21 HOT Networks: A New Plan for Congestion Relief and Better Transit, testimony of Robert W. Poole, Jr. presented to the Joint Economic Committee, Dirksen Senate Office Building, May 6, 2003.
You may need the Adobe Acrobat Reader to view the PDFs on this page.
| US DOT Home | FHWA Home | Operations Home | Privacy Policy | ||