|
|
|
final report
Traffic Congestion and Reliability: Linking Solutions to Problems
Return to Appendix D
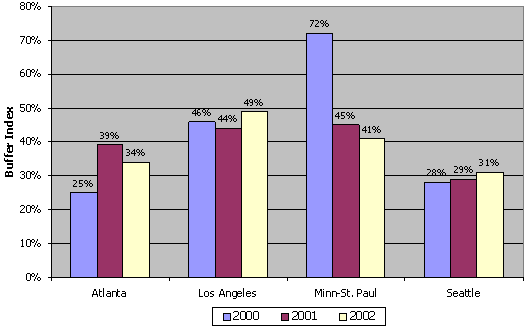
This figure shows annual trends for travel reliability (as measured by the buffer index) for Atlanta, Los Angeles, Minneapolis-St. Paul, and Seattle for the years 2000, 2001, and 2002. Travel reliability has improved in Minneapolis-St. Paul, but has gotten worse in the other three cities. For Atlanta, the buffer index values for 2000, 2001 and 2002 are 25 percent, 39 percent, and 34 percent, respectively. For Los Angeles, the buffer index values for 2000, 2001 and 2002 are 46 percent, 44 percent, and 49 percent, respectively. For Minneapolis-St. Paul, the buffer index values for 2000, 2001 and 2002 are 72 percent, 45 percent, and 41 percent, respectively. For Seattle, the buffer index values for 2000, 2001 and 2002 are 28 percent, 29 percent, and 31 percent, respectively.
Figure D.5 Reliability Trends in Four Cities
2000-2002