|
|
|
final report
Traffic Congestion and Reliability: Linking Solutions to Problems
D. City Level Trends in Reliability
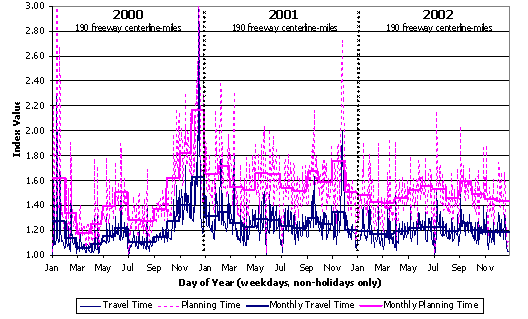
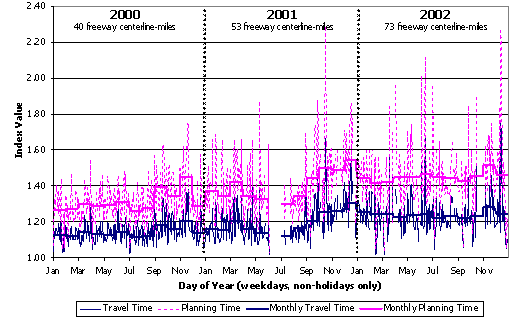
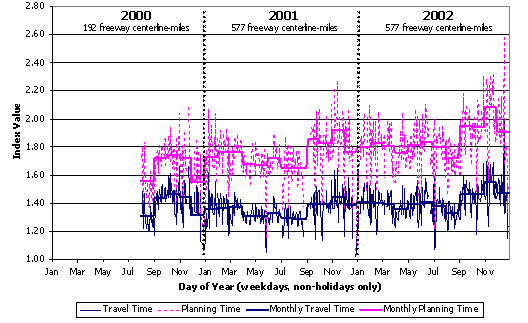
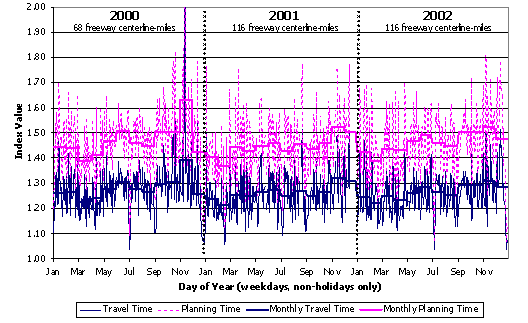
To supplement the TTI analysis, we have conducted a series of case studies using data from the Mobility Monitoring Program for four cities: Los Angeles, Minneapolis, Seattle, and Atlanta. These data come from instrumented freeways which tend to be the higher congestion locations. Figures D.1 through D.4 present congestion trends for the period between 2000 and 2002. In these figures, daily statistics ("travel time" and "planning time") are shown as the faint and highly variable background lines. (Planning time is the 95th percentile travel time, a measure of reliability.) Monthly summaries are also shown as means to determine long-term trends.
- Minneapolis showed a sharp upturn in both base congestion level and unreliability toward the end of 2000. Beginning in October, an experiment was conducted there to examine the effect of ramp metering by turning the meters off — this led to worsening of congestion and reliability. In December, the area was also hit with a series of winter storms. From 2001 to 2002, congestion eased very slightly.
- Atlanta has shown a steady increase in congestion and unreliable travel times from 2002 to 2002. Some of this may be the fact that the surveillance system has expanded to new highways over the period, but the base system covered in 2000 already includes some of the worst areas (e.g., the central Atlanta section discussed in Section 2.0).
- Congestion and unreliable travel times are on the increase in Los Angeles.
- Congestion in Seattle was relatively flat for the period 2000-2002. However, an interesting seasonal pattern is evident: congestion and unreliable travel times are lower early in the year and increase toward the end of the year.
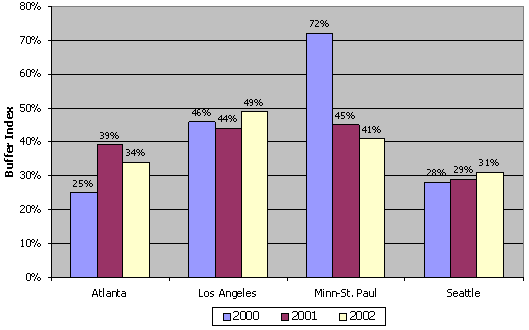
Another way to measure reliability is to consider the Buffer Index computed for the entire year (Figure D.5). Except in Minneapolis — where the effect of the "ramp meter shutdown" and winter storms in late 2000 caused extreme unreliability — the cities show a slow increase in unreliable travel times from 2000 to 2002.
Figure D.1 Congestion Trends on Minneapolis Freeways
Source: Analysis of data from FHWA's Mobility Monitoring Program.
Figure D.2 Congestion Trends on Atlanta Freeways
Source: Analysis of data from FHWA's Mobility Monitoring Program.
Figure D.3 Congestion Trends on Los Angeles Freeways
Source: Analysis of data from FHWA's Mobility Monitoring Program.
Figure D.4 Congestion Trends on Seattle Freeways
Source: Analysis of data from FHWA's Mobility Monitoring Program.
Figure D.5 Reliability Trends in Four Cities
2000-2002
![]()
Source: Analysis of data from FHWA's Mobility Monitoring Program.