2020 Urban Congestion TrendsPrintable version [PDF 8 MB]
U.S. Department of Transportation FHWA-HOP-21-010 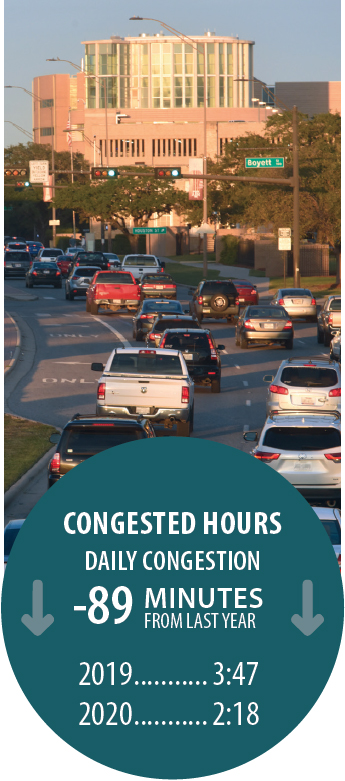 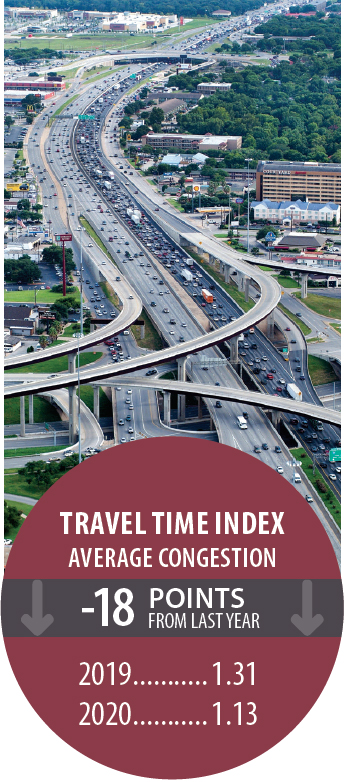 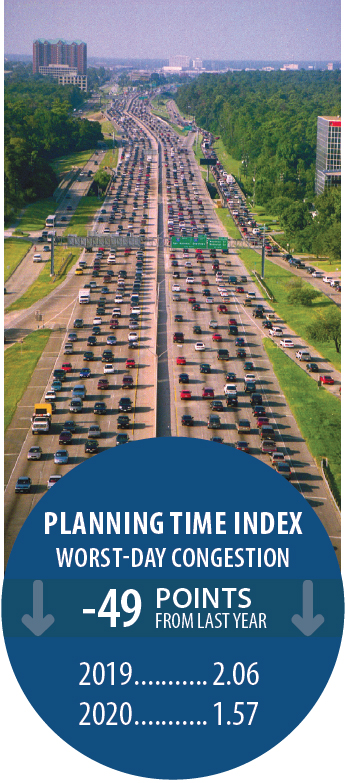 Photo credit: Texas A&M Transportation Institute Communications For more 2020 trend information, see Summary of Performance Measure Trends for Calendar Year 2020. Congestion Measure DefinitionsCongested Hours—average amount of time in hours when freeways operate in congested conditions during a day (congested conditions means at less than 90 percent of free-flow speed between 6 a.m. and 10 p.m.). Travel Time Index (TTI)—time penalty for a trip on an average day. A TTI of 1.30 indicates a 20-minute free-flow trip takes 26 minutes (20 × 1.30) in the rush hours (Weekdays 6 a.m. to 9 a.m. and 4 p.m. to 7 p.m.). Planning Time Index (PTI)—time penalty for a trip to be on time for 95 percent of trips (e.g., late for work on one day per month). A PTI of 1.60 indicates a 20-minute free-flow trip takes more than 32 minutes (20 × 1.60) one day per month. 
Photo credit: Texas A&M Transportation Institute Communications 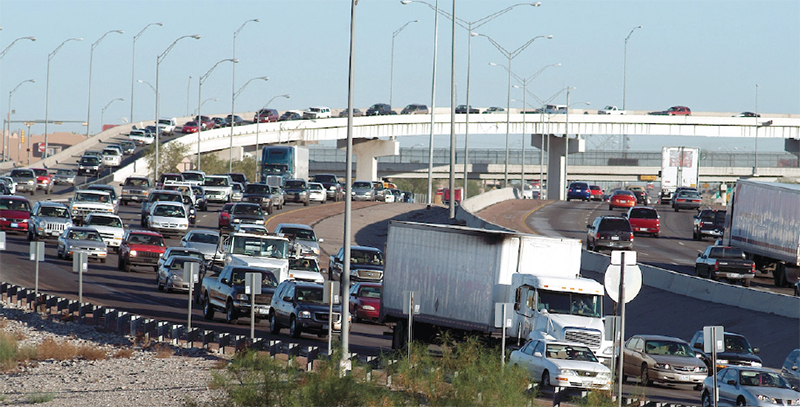
Photo credit: Texas A&M Transportation Institute Communications 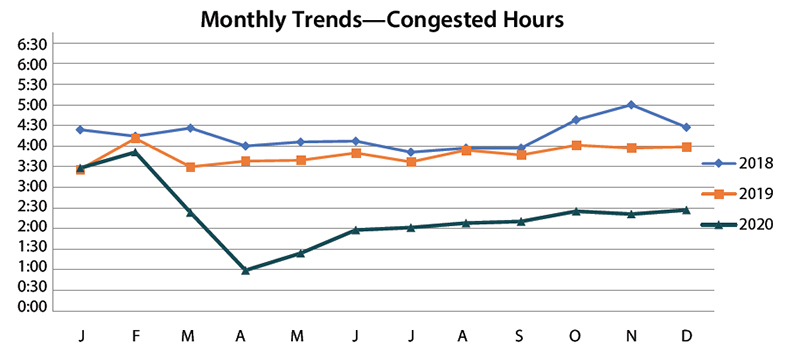 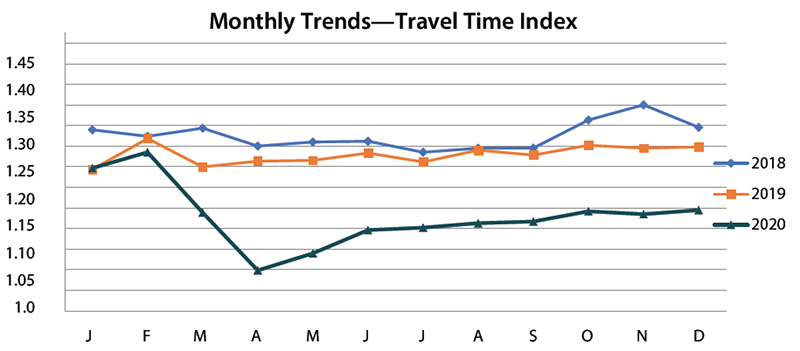 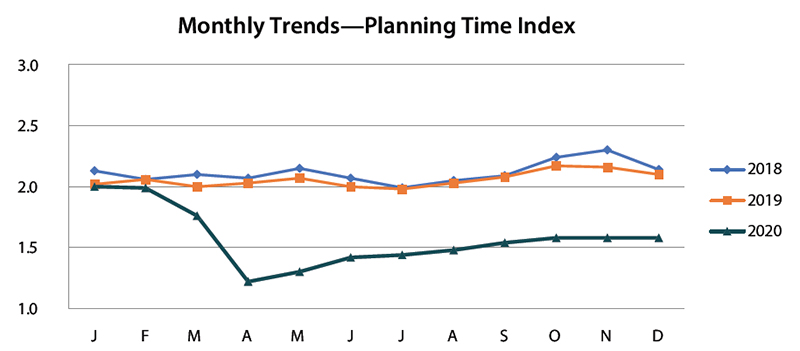 Monthly Trends - Planning Time Index graph. It shows nationwide Planning Time Index (PTI) for years 2018 through 2020. Planning Time Index values (which are associated with 95th percentile travel times, typically extreme events) for 2020 are significantly lower than previous years from March through December.
Urban Congestion Trends 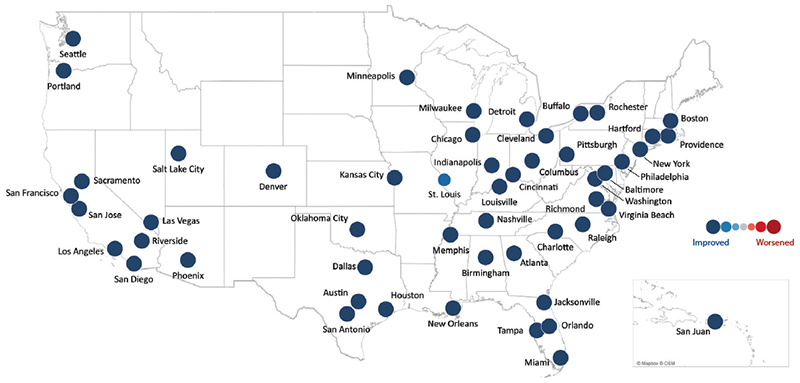
Urban Congestion Trends/Year-to-Year Congestion Trends in the United States (2019 to 2020). A map of the U.S. with representatively colored/sized dots on each of the 52 Metropolitan Statistical Areas (MSAs) indicating changes in the year-to-year congestion measures from 2019 to 2020.
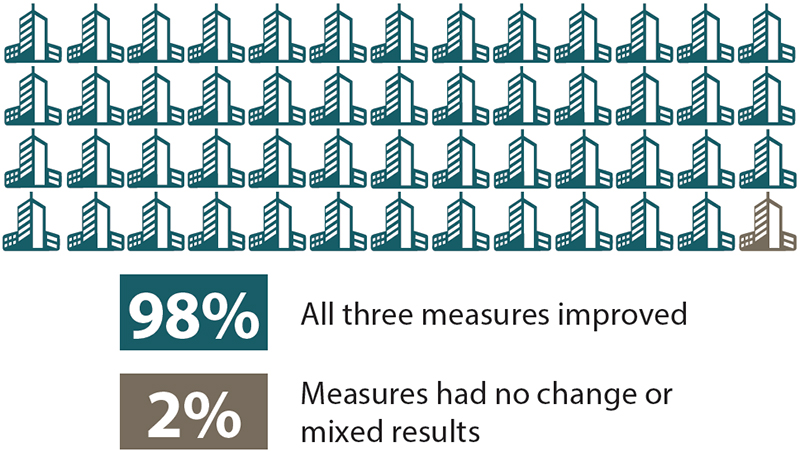 
Urban Congestion Trends/Year-to-Year Congestion Trends in the United States (2019 to 2020). 98 percent of the MSAs, all three measures (congested hours, Travel Time Index, Planning Time Index) improved and in 2 percent of the MSAs the measures had no change or mixed results.
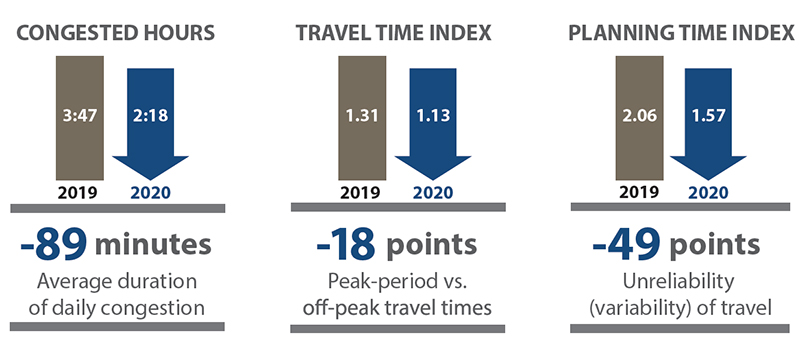
Urban Congestion Trends/Year-to-Year Congestion Trends in the United States (2019 to 2020). The graphic indicates that congested hours decreased 89 minutes from 3 hours and 47 minutes in 2019 to 2 hours and 18 minutes in 2020; the Travel Time Index decreased 18 points from 1.31 in 2019 to 1.13 in 2020; and the Planning Time Index decreased 49 points from 2.06 in 2019 to 1.57 in 2020.
NOTES Congestion Facts
Photo credit: Texas A&M Transportation Institute Communications National Performance Management Research Data Set ApplicationsA unique use of the National Performance Management Research Data Set (NPMRDS) is the application by the Sacramento Area Council of Governments (SACOG) for on-the-fly project assessment. SACOG is the metropolitan planning organization for the Sacramento, CA, area and is made up of 6 counties and 22 cities. SACOG conducts funding rounds to allocate funds to transportation projects based on available apportionments of regional Congestion Mitigation and Air Quality, Regional Surface Transportation Program, State Transportation Improvement Program, Active Transportation Program, and SACOG managed funds. Frequently, one component of analysis in the funding round is congestion and reliability. In an effort to evaluate the congestion metrics and reliability of the submitted road project, NPMRDS speed and travel time data are used to get an idea of how reliable and congested a road is by, in part, using the Project Performance Assessment (PPA) Tool (https://www.sacog.org/project-performance-assessment). The tool allows users to select average speeds or reliability metrics by time of day and present them visually on a color-coded map, as shown below. Graphic above and map below source: Project Performance Assessment, Sacramento Area Council of Governments (sacog.org) 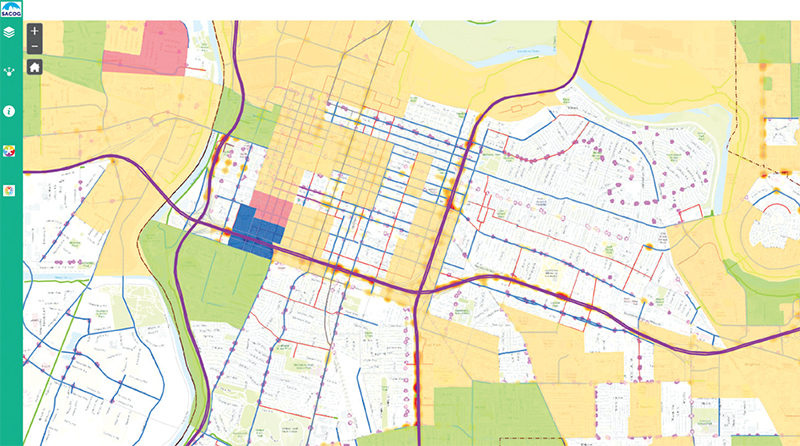
Map from the PPA Tool. For more information, contactDarren Conly, Analyst, SACOG, dconly@sacog.org. The NPMRDS includes actual, observed travel times on the National Highway System (NHS) for freight vehicles, passenger vehicles, and all vehicles. The NPMRDS is freely available for use by State departments of transportation and metropolitan planning organizations for their performance management activities. The travel time data have been used to calculate congestion and reliability metrics for the Federal Highway Administration (FHWA) Urban Congestion Report (UCR) since 2013. The Benefits and Costs of Implementing Automated Traffic Signal Performance MeasuresAutomated traffic signal performance measures (ATSPMs) is a suite of performance measures, as well as data collection and analysis tools to support objectives and performance-based approaches to traffic signal operations, maintenance, management, and design to improve the safety, mobility, and efficiency of signalized intersections for all users. The measures have been shown to greatly enhance an agency’s situational awareness regarding operation and maintenance of its signal system. 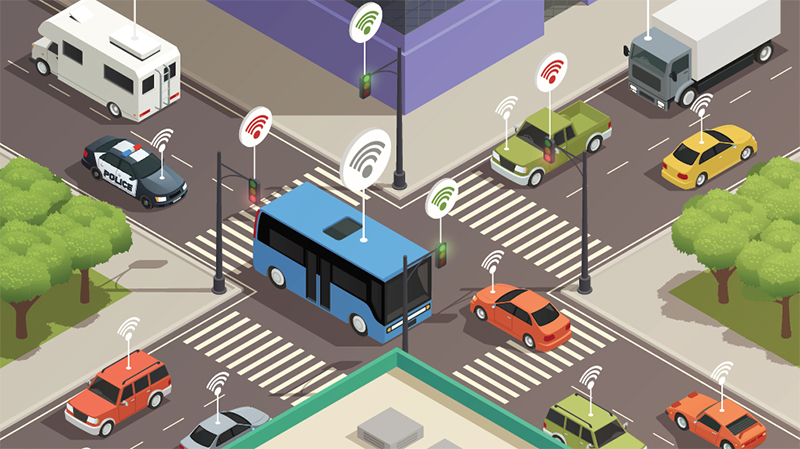
Graphic illustration credit: Shutterstock.com The Maricopa County Department of Transportation (MCDOT) and several cities and towns within Maricopa County recognized the need for the ability to make data-driven decisions that involve signal operations, so they decided to cooperatively implement ATSPMs. These agencies had previously used conventional retiming signal practices, undertaking about three coordination projects per year and developing new base timing plans every five years. Now that ATSPMs have been implemented, engineers will replace arbitrarily scheduled activities with data-driven retiming decisions using metrics derived from ATSPMs. The table shows anticipated benefits to the citizens and employees of Maricopa County. Cost/Benefit Table (Source: FHWA-HOP-20-003)
One of MCDOT’s immediate uses of ATSPMs was to proactively identify detector failures using the email alert system in the Utah Department of Transportation open-source ATSPM software. MCDOT is now able to quickly validate problems reported by the public without sending staff into the field. Previously, when a citizen complained about signal operations, MCDOT would observe operations using closed-circuit television (CCTV) or send a technician to the field to examine the problem. However, once the technician arrived at the intersection, it was possible the problem would not recur during the site visit. Remote observation and site visits were limited to the time when agency staff could attend to identified problems. In the near future, MCDOT plans to use ATSPMs for a performance baseline to assess the impacts of new technologies, such as adaptive signal control and connected vehicle (CV) applications. The ability to monitor such change is a core function of traffic signal systems that has not been available in the past with most systems. Currently, MCDOT is monitoring traffic conditions with pilot tests of CV applications in the Anthem, AZ, SMARTDrive test bed. For more information, contactEddie Curtis, Traffic Operations Specialist, FHWA, Eddie.Curtis@dot.gov. Summary of Performance Measure Trends for Calendar Year 2020Traffic performance measures calculated for the UCR all improved in 2020. Traffic volumes were lower for much of the year, and as shown in this report, speeds were up, indicating improvement for the three measures across the 52 MSAs. Hours of congestion across the MSAs decreased an average of 89 minutes compared to 2019 and were down nearly two hours when compared to the 2018 hours-of-congestion measure. Based on the TTI and a 20-minute trip at free flow for comparison purposes across years, travel time was down by about 4 minutes in 2020 compared to 2019. Similarly, based on the PTI and a 20-minute free-flow trip, in 2020, the longest trip out of 20 would have taken longer than 31 minutes. In 2019, the same longest trip out of 20 would have taken longer than 41 minutes. 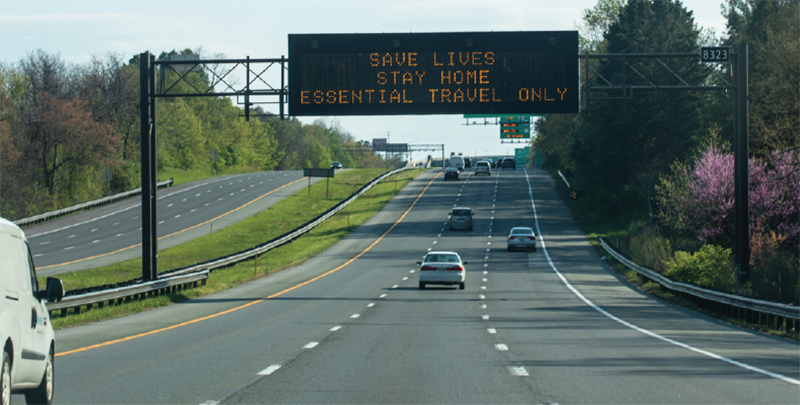
Photo credit: Nicole Glass Photography/Shutterstock.com The long, consistent collection of data and measures from the UCR program allows for trend analysis of the three measures. Future trend analyses may show 2020 to be an outlier. The FHWA 2020 Urban Congestion Trends report details trends and the current state of congestion and reliability on the NHS in 52 of the largest metropolitan areas in the United States. This report also includes examples of how agencies are using the NPMRDS for performance reporting and analysis, as well as for operational strategy evaluation and benefit calculation. 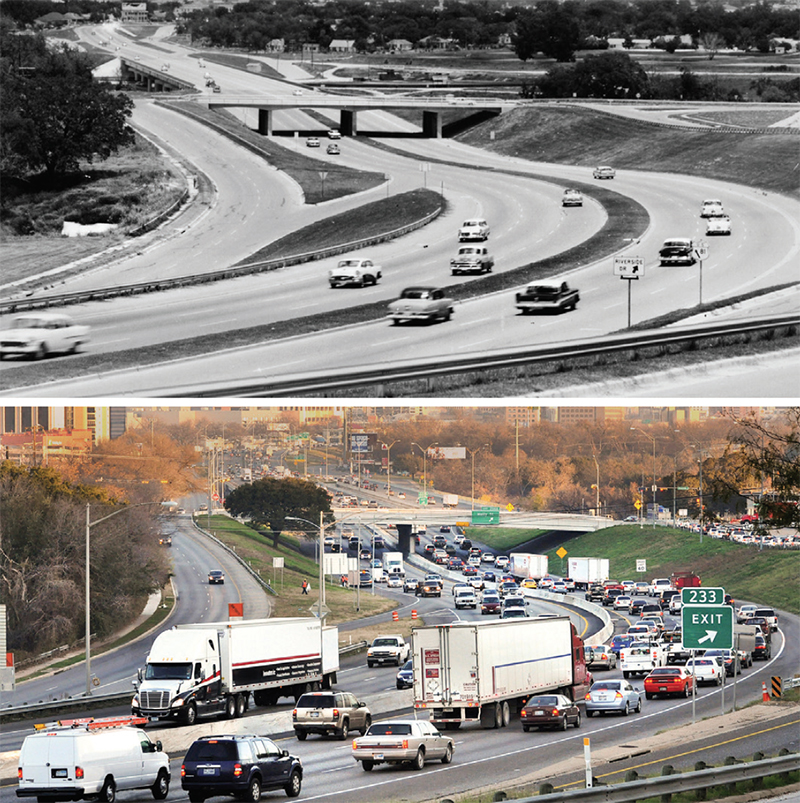
Photos by Texas Department of Transportation and Texas A&M Transportation Institute Communications Contact InformationVisit the Operations Performance Measurement Program Urban Congestion Reports web page for quarterly congestion trend updates: ops.fhwa.dot.gov/perf_measurement/ucr/index.htm. | |||||||||||||||||||||||||||||
|
United States Department of Transportation - Federal Highway Administration |
||