Mid-America Regional Council Pilot of the Data Business Plan for State and Local Departments of Transportation: Data Business Plan
Chapter 3. Data and Gap Assessment
This section presents an inventory of current mobility data collection efforts by regional stakeholders and the results of a data and gap assessment to identify issues related to the collection, management, governance, and use of mobility data in the Mid-America Regional Council (MARC) area.
Data Inventory
One of the Metropolitan Planning Organizations' (MPO) goals is to increase their knowledge of partner agencies' current and future data sources available to support performance-based planning. This section details several mobility data initiatives in the region, and it provides a comprehensive mobility data inventory for regional stakeholders. The information in this section was compiled based on the results of the stakeholder survey and follow‑up phone interviews.
Mobility Data Inventory
Table 3 and Table 4 provide a comprehensive mobility data inventory for external and internal regional stakeholders, respectively. The tables include the following information:
- Organization—The name of the organization responsible for collecting or managing mobility data.
- Mobility Data Collected—The type of mobility data being collected within the organization.
- Data Source—Whether the data is collected internally, obtained from another agency, purchased from vendors, or other data source.
- Network Type—Whether the data is collected on freeways, arterials, or other roads.
- Geographic Boundary—The geographic boundary for data collection.
- Data Collection Standards—Whether there are existing standards for data collection.
- Business Needs—Whether the data is meeting the organization's or division's business needs.
- Data Sharing—Whether the data is shared and with whom.
- Data Sharing Obstacles—Obstacles faced when trying to share data.
- Data Documentation—The availability and quality of data documentation.
- Data Management Structure—Whether there is an organizational structure in place to manage the data (Table 3 only).
- Collaboration—How the organization collaborates with other external organizations (Table 3 only).
Table 3. External mobility data inventory.
 |
Organization |
| City of Overland Park, KS |
Kansas City Area Transportation Authority (KCATA) |
MoDOT |
City of Olathe |
Johnson County, KS |
HERE North America |
City of Lee's Summit |
KCMO—Persons with Disabilities |
| Mobility Data Collected |
Bicycle volume, vehicular volume, vehicular speed |
Number of transit boardings by stop, transit on‑time arrival, transit ridership, transit travel time, and other data (including General Transit Feed Specification (GTFS), operational statistics, maintenance, etc.) |
Transit ridership, vehicular speed, vehicular volume, (vehicular class), freight speed, freight volume, (freight class) |
Pedestrian volume, vehicular speed, vehicular volume |
Bicycle/pedestrian infrastructure data, vehicular speed, vehicular volume |
Vehicular speed Freight speed |
Bicycle and pedestrian volume, transit ridership, vehicular speed, vehicular volume |
Bicycle and pedestrian volume, vehicular speed, vehicular volume |
| Data Source |
All are collected internally. |
All are collected internally |
Transit ridership is obtained from transit agencies. The rest is collected internally, but vehicular and freight speeds are also obtained from HERE. |
All data is collected internally, while vehicular volume is also obtained from other agencies (KDOT, KHP, and bordering cities). |
They coordinate data collection collaborating with cities inside the County, KDOT, KCATA, and county departments. |
They collect the data |
They collect data for all. Transit ridership and vehicular speed and volume are also obtained from others agencies (MoDOT, U.S. DOT, Operation Green Light, MARC, KCATA, OATS, school districts. Lastly, vehicular volume is often obtained from consultants that submit traffic impact studies. |
All datasets collected internally. |
| Network Type |
Arterials and collectors |
A variety of facilities, including local, arterials, and freeways. |
Vehicular and freight speed data is collected for freeways and arterials. The rest is collected on freeways, arterials, and collectors. |
Arterials |
All datasets are collected for freeways and arterials, except for bicycle/pedestrian data, collected for arterials and other roads. |
Freeways and arterials |
Vehicular speed and volume is gathered for freeways, arterials, and other roads. Bicycle/pedestrian volume and transit ridership are collected for arterials and other roads. |
Arterials |
| Geographic Boundary |
Overland Park |
KCATA Region |
Statewide |
City of Olathe |
Johnson County (and Johnson and Miami Counties for vehicular speed) |
Global |
All data is available within the boundary of City of Lee's Summit. |
Kansas City, Missouri |
| Data Collection Standards |
Yes |
Yes, but transit on‑time arrival is not adequate, and other datasets are uncertain regarding adequacy. |
Yes |
Yes |
All have standards, except for vehicular volume |
Yes |
Yes |
Yes = Pedestrian volume
No = Bicycle volume, vehicular speed, vehicular volume. |
| Meeting Business Needs? |
Yes for bicycle and vehicular volume. No for vehicular speed. |
Not for on‑time arrival. Undefined/unknown for the rest. |
Yes = transit ridership, vehicular speed, vehicular volume. No = Freight speed and freight volume. |
Yes |
Yes |
Yes |
Bicycle volume not meeting business needs. |
Bicycle volume not meeting business needs. |
| If No, why Not |
"The speed data is random (when residents complain about speeding in their neighborhood) and sometimes quite old data is used." |
"On‑time arrival information definition for data collection does not match the way public would see as on‑time. Some technical issues." |
Need more detailed data, as datasets are based on truck volume, but do not tell us what the truck is hauling, if it is empty or full, or its origin or destination. |
|
|
|
Currently the peak/commuter bicycle volume is counted, but this does not accurately reflect the demand or use to properly measure performance and consider improvements. Daily counts would be more useful, but more time consuming and expensive to obtain. Currently, the data collection is done at the same time as vehicle and pedestrian counts to efficiently gather information during the same opportunity. |
Needs a plan and resources for implementation. |
| Data Sharing |
The volume counts are shared with MARC and the general public. |
Ridership is publicly available. Other datasets are shared internally and with other organizations. |
All datasets are shared with MPOs, RPCs, and the Blueprint coalition. |
Pedestrian volume and vehicular speed are only shared internally. Vehicular volumes are shared with KDOT, the Chamber of Commerce, and the general public. |
All datasets are shared internally and with other organizations (public works, parks, cities, MARC, and Emergency Managements). In addition, bicycle/pedestrian data is shared with general public. |
Public-sector agencies, automotive industry, media, and others. |
Vehicular volume and transit ridership are shared with other organizations and with the general public. Vehicular speeds are shared with the general public. Bicycle and pedestrian counts are not shared with anyone. |
All datasets are shared with other city divisions. Pedestrian and vehicular volumes are shared with general public. |
| Data Sharing Obstacles |
|
There is no good structure or interface for sharing on an ongoing basis. |
|
|
The costs and restrictions of vehicular data are an obstacle. |
|
|
|
| Data Documentation |
|
Bad for on‑time arrival. OK for the rest. |
No documentation for freight data. "OK" documentation for the rest. |
OK = Pedestrian volume. Good = Vehicular speed and volume. |
Good = bicycle/pedestrian and vehicular speed
OK = vehicular volume |
Good = vehicular speed
OK = Freight speed |
Bad = bicycle/pedestrian volume
OK = vehicular speed
Good = Transit ridership and vehicular volume. |
OK = Bicycle volume and vehicular speed
Good = Pedestrian volume and vehicular volume |
| Data Management Structure |
To manage this data, certain individuals or work groups are tasked with developing count needs and deploying equipment |
No |
MoDOT has a Technology Steering Committee to review significant projects with respect to cost. |
No |
No |
Yes, through a license agreement. |
Agency has a management structure, defined data collection measures, defined data collection frequency targets, annual data reporting. Data measures and methods are derived from standards of practice (e.g., Federal Highway Administration (FHWA) performance metrics, HCM level of service methods). |
Unknown |
| Collaboration |
They have a quarterly meeting with the Johnson County Traffic Engineers to discuss common areas of interest. |
Currently working on a new regional dashboard. Collaboration with MARC and local jurisdictions, sharing data on an as-needed basis. |
MoDOT collaborates with MPOs and RPCs by email, webinar, and meetings. It does the same with MPTA with transit data. |
Communication with other agencies happens in the form of employees with similar duties talking in person, phone call, or email. |
They collaborate with other agencies through in‑person meetings, emails and webinars/conference calls. |
They work with agencies to better understand their needs. |
Lee's Summit collaborates with other organizations in assisting with data, planning and analysis. |
Limited collaboration. |
Table 4. Internal mobility data inventory.
| Mobility Data Collected |
Contact Name |
Data Source |
Network Type |
Geographic Boundary |
Data Collection Standards |
Meeting Business Needs? |
If No, Why Not? |
Data Sharing |
Data Sharing Obstacles |
Data Documentation |
| Bicycle Volume |
Performance Management Team (Jim Hubbell) |
Collected internally |
Arterials; trails and other off‑road facilities |
Metropolitan Planning Area |
Yes |
No |
More bicycle counts and locations are needed to develop regional, seasonal factors |
Shared with Internal/external stakeholders, and through public portal |
|
OK |
| Bicycle/pedestrian Planning (Kaitlyn Service) |
Collected internally |
Local roads |
MARC's MPO boundary with an emphasis in MARC's air quality planning boundary |
Yes |
No |
Need more resources to expand bicycle/pedestrian counting program by incorporating more counting equipment and establishing more involvement from local jurisdictions |
Shared internally and externally—with the City; in future with all jurisdictions within the MARC region |
|
OK |
| Traffic Operations (Ray Webb) |
Collected internally |
Arterials |
KC Metro Area |
Don't know |
Yes |
|
Other cities and consultants |
Compatibility: when data is not in Miovision format, it can get lost. |
Nonexistent |
| Pedestrian Volume |
Traffic Operations (Ray Webb) |
Collected internally |
Arterials |
KC Metro Area |
Don't know |
Yes |
|
Other cities and consultants |
|
Nonexistent |
| Performance Management Team (Jim Hubbell) |
Collected internally |
Arterials |
Metropolitan Planning Area |
Yes |
No |
More pedestrian counts and locations are needed to develop regional, seasonal factors |
Shared with internal/external stakeholders, and through public portal |
|
OK |
| Bicycle/Pedestrian Planning (Kaitlyn Service) |
Collected internally |
Local roads |
MARC's MPO boundary with an emphasis in MARC's air quality planning boundary |
Yes |
No |
Need more resources to expand bicycle/pedestrian counting program by incorporating more counting equipment and establishing more involvement from local jurisdictions |
Shared internally and externally—with the City; in future with all jurisdictions within the MARC region |
|
OK |
| Bicycle/pedestrian Facilities |
Geographic Information System (GIS) (Andrea Repinsky) |
Bicycle/pedestrian facilities come from city and county governments who own the facilities |
Freeways; arterials; other (shared use pathways, minor arterials and collectors) |
Not specified |
Yes |
No |
Not specified |
General public |
|
Bad |
| Transit On‑Time Arrival |
Modeling |
Obtained from transit agencies, State DOTs, and local cities |
Freeways; arterials |
KCATA |
Don't know |
Yes |
|
Shared internally |
|
OK |
| Performance Management Team (Jim Hubbell) |
Obtained from State DOTs and local agencies |
Arterials |
Metropolitan Planning Area |
Yes |
No |
There are inconsistent definitions of transit on‑time arrival across different agencies |
Shared with internal/external stakeholders, and through public portal |
|
Nonexistent |
| Transit Other—Routes, Frequency, Days of service |
GIS (Andrea Repinsky) |
Obtained from transit agencies |
Freeways, arterials, other |
Not specified |
Don't know |
No |
Not specified |
Shared internally |
|
Not specified |
| Transit Ridership |
Modeling |
Obtained from transit agencies, State DOTs, and local Cities. |
Streets and highways |
KCATA |
Don't know |
Yes |
|
Shared internally |
|
OK |
| Performance Management Team (Jim Hubbell) |
Obtained from State DOTs, and local agencies |
Streets and highways |
Metropolitan Planning Area |
Yes |
Yes |
|
Shared with internal/external stakeholders, and through public portal |
|
Nonexistent |
| GIS (Andrea Repinsky) |
Obtained from transit agencies |
Streets and highways |
Not specified |
Don't know |
Yes |
|
Shared internally |
|
Not specified |
| Transit speed |
Modeling |
Obtained from transit agencies, State DOTs, and local cities. |
Streets and highways |
KCATA |
Don't know |
No |
Difficult to obtain, and the reliability of the tracking system might not be optimal. |
Shared internally |
|
Bad |
| GIS (Andrea Repinsky) |
Obtained from transit agencies |
Streets and highways |
Not Specified |
Don't Know |
No |
Not specified |
Shared Internally |
|
Not specified |
| Vehicular speed |
Modeling |
INRIX |
Freeways, arterials |
MARC Regional Planning Boundary, except Ray County |
Don't know |
No |
Transferring speed to transportation model networks can be burdensome |
Shared internally |
Proprietary restrictions |
OK |
| Traffic Operations (Ray Webb) |
Collected internally |
Arterials |
KC Metro Area |
Don't know |
Unknown |
|
Other cities and consultants |
|
Nonexistent |
| Performance Management Team (Jim Hubbell) |
HERE (NPMRDS) and INRIX |
Freeways, arterials |
Metropolitan Planning Area |
Yes |
Yes |
|
Shared internally and with member organizations upon request |
License agreements for speed/travel time data limit sharing to some extent |
Good |
| Vehicular volume |
Modeling |
Obtained from State DOTs and local cities. |
Freeways, arterials |
MARC Regional Planning Boundary, except Ray County |
Don't know |
Yes |
|
Shared internally and with the general public |
|
OK |
| Performance Management Team (Jim Hubbell) |
Obtained from State DOTs and local agencies |
Freeways, arterials |
Metropolitan Planning Area |
Yes |
No |
Would be helpful to have more consistent regional data for vehicular volumes |
Not shared |
MARC does not manage/maintain vehicular or truck volume data in a way it can be easily shared |
Nonexistent |
| Traffic Operations (Ray Webb) |
Collected internally |
Arterials |
KC Metro Area |
Don't know |
Unknown |
|
Other cities and consultants |
|
Nonexistent |
| Freight speed |
Modeling |
Obtained from State DOTs and local cities |
Freeways |
MARC Regional Planning Boundary, except Ray County |
Don't know |
No |
Transferring speed to transportation model networks can be burdensome |
Shared internally |
Proprietary restrictions |
OK |
| Performance Management Team (Jim Hubbell) |
HERE (NPMRDS) |
Freeways, arterials |
Metropolitan Planning Area |
Yes |
Yes |
|
Shared internally and with member organizations upon request |
License agreements for speed/travel time data limit sharing to some extent |
Good |
| Freight volume |
Modeling |
Obtained from State DOTs |
Freeways, arterials |
MARC Regional Planning Boundary, except Ray County |
Don't know |
Yes |
|
Shared internally and with the general public |
|
OK |
| Performance Management Team (Jim Hubbell) |
Obtained from State DOTs and local agencies |
Freeways, arterials |
Metropolitan Planning Area |
Yes |
No |
Would be helpful to have more consistent regional data for truck volumes |
Not shared |
MARC does not manage/maintain vehicular or truck volume data in a way it can be easily shared |
Nonexistent |
Data Assessment
The stakeholder outreach process was used to identify stakeholder needs related to the collection, management, governance, and use of MARC's mobility data programs, stakeholder coordination, and current capability/maturity. Table 5 summarizes stakeholder needs within each of these assessment areas. The results of the assessment will help prioritize data systems for enhancements or replacements to support mobility planning, operations, and performance measure activities.
Table 5. Stakeholder needs and challenges.
| Dimension |
Stakeholder Need |
Source |
| Data Systems |
Need to have more consistent regional data for vehicular and truck volumes. |
Survey |
| The practices with regards to file storage and organization vary tremendously among departments and staff, and there are no formal standards. |
Survey |
| Desire to expand bicycle/pedestrian collaboration effort between MARC and local jurisdictions to a regional scale. |
Workshop |
| There are inconsistent definitions of transit on‑time arrival across different agencies. Need to have standards. |
Survey |
| Transferring probe speeds to transportation model networks can be burdensome. Developing and adopting a universal network or a linear referencing system (e.g., ARNOLD) might be the solution. |
Survey |
| Need to ensure compatibility of Miovision data with others for traffic operations data. |
Survey |
| Need better, more and systematic automation of data collection and assembly processes. There are certain core databases that are the ones in need of automation. MARC needs to identify them. |
Workshop |
| Need to maintain vehicular or truck volume in a way it can be easily shared. |
Survey |
| Need to determine a model to obtain buy in from cities as to why they need to share. |
Workshop |
| Technology & Tools |
Need software and skills to enable development of performance measures over time. |
Workshop |
| Need tools to work with large datasets that are part of the Digital Transportation. |
Workshop |
| Data Governance |
Need to develop ideas and structure for memorandums of understanding (MOU), business rules to get everything in place. |
Workshop |
| Need to be prepared for the future—i.e., evolving data sources and the world of Digital Transportation. |
Workshop |
| Need to have awareness in license agreements. License agreements for probe speed data limit sharing. |
Survey |
| There is strong need to create awareness and exposure to examples of good data management practices across the agency. |
Survey |
| Data Governance |
Need to ensure better systems for data. Eliminate the "one-off" data projects, instead ensuring they are part of a Data Master Plan. |
Workshop |
| Need to establish an internal collaboration mechanism for data coordination, including plan for quarterly meetings and agenda items. |
Workshop |
| Need a better form of regular communication and collaboration among data users and collectors within MARC. |
Workshop |
| Need to develop a data catalog to list all data, source, and where it is housed (and who is responsible). |
Workshop |
| Need to change data culture through staff training, management support, and organizational structures. |
Workshop |
| Need clarity of priorities, systems and action items. |
Workshop |
| Desire to show how data management adds value. |
Workshop |
| Desire to have the ability to develop mobile apps. |
Workshop |
Assessment of Capability
An assessment of the MARC region's capabilities for collecting, managing, governing, and using mobility data was conducted using a capability maturity model. A maturity model helps agencies assess their current capabilities with respect to data management and governance, and identify next steps in achieving the goals and objectives of the Data Business Plan (DBP). The maturity model defines levels of maturity for each of the following assessment areas:
- Data Collection, Management, and Technical Standards: What mobility data are collected? Are the data sufficient to support mobility planning, operations, and performance measure activities? Are there overlaps or redundancies in data collection or management efforts? Are business processes for data collection, updating, quality assurance, data processing, and use documented? Is there an inventory of available mobility data systems (in a data registry)? Are adequate data collection standards and metadata in place?
- Data Analysis Tools and Uses: Do users have access to the business analysis tools they need to support mobility planning, operations, and performance measure activities? Are technology and tools to support data management and analysis consistent, standardized, and updated?
- Data Management and governance: Is there a governance structure for mobility data programs in place? For example, are roles, responsibilities, and processes for managing data formalized and documented? Is there a designated data governance board, data stewards, and data owners?
- Data Interoperability and Expandability: To what extent are mobility data sets linked to support performance measurement and asset management purposes? Are existing mobility data systems expandable as new technologies and tools are developed?
There are three distinct levels of capability for each assessment area:
- Level 1—Initial/Under Development. Activities and relationships are largely ad hoc, informal, and champion-driven, substantially outside the mainstream of other activities. Alternatively, the capability is under development, but there is limited internal accountability and uneven alignment with other organizational activities.
- Level 2—Defined/Managed. Technical and business processes are implemented and managed, partnerships are aligned, and training is taking place.
- Level 3—Optimized. Data management and governance is a full, sustainable program priority, with continuous improvement, top-level management support, and formal partnerships in place.
Figure 1 presents the draft results of the capability assessment. The hollow circle (  ) indicates current level of capability within the assessment area, which was determined based on the list of stakeholder needs. The solid circles indicate the target level of capability, and they are color coded to reflect the degree of gap. For example, the green circle ( ) indicates current level of capability within the assessment area, which was determined based on the list of stakeholder needs. The solid circles indicate the target level of capability, and they are color coded to reflect the degree of gap. For example, the green circle (  ) indicates no gap, in which the desired level of capability is the same as the current level. The yellow circle ( ) indicates no gap, in which the desired level of capability is the same as the current level. The yellow circle (  ) indicates a small gap (e.g., one level difference) between current and desired levels of capability. The red circle ( ) indicates a small gap (e.g., one level difference) between current and desired levels of capability. The red circle (  ) indicates a large gap (e.g., two levels) between current and desired levels of capability. ) indicates a large gap (e.g., two levels) between current and desired levels of capability.
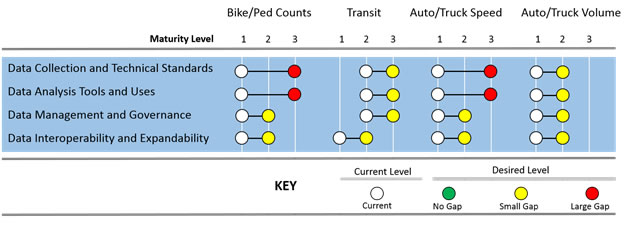
Figure 1. Chart. Assessment of capability.
(Source: Cambridge Systematics, Inc.)
Summary of Gaps
The content below summarizes the gaps that exist in program activities by data type. The FHWA recommends that MARC address these gaps to advance the region from current to desired levels of capability within the assessment areas:
- Bicycle/Pedestrian Counts.
- The overall model of data sharing is good (see bicycle/pedestrian case study in appendix G for more information). MARC staff desire to expand this effort to a regional scale by encouraging more municipalities to join through data-sharing partnerships.
- Transit:
- MARC gathers transit data—including ridership and on‑time arrival—from various agencies. However, since their role is to support regional partners rather than collecting data, MARC does not have control of the quality and standards of the data.
- Auto/Truck Speed:
- MARC collects speed data through various mechanisms in an ad‑hoc manner when needed.
- Floating Car: MARC collects before-after travel runs to assess projects.
- Probe Speed: MARC acquires probe speed (NPMRDS and INRIX) on an as‑needed basis.
- MARC needs better resources (staff and tools) to analyze probe speed data.
- Staff: Need to develop level of data proficiency for all staff.
- Tools: Tools should enable less technically savvy people to analyze and understand data.
- Vehicle/Truck Volume:
- Similar to transit data, MARC simply gathers data from other agencies. They do not have a way to validate the volume data they receive; and yet, the data is used to support their modeling efforts.
- There could be opportunities for MARC to establish data volume standards (e.g., develop standard definitions or data-sharing schema).
- For freight volume, there is no automatic process in place.
- Data Systems: Gaps related to data systems, data elements, data collection methods, duplicative data collection efforts, data storage environments, quality of data, data standards, data integration, data analysis, documentation, and system access.
- Interoperability and Expandability for All Data Types:
- Currently, MARC's data often consists of separate, siloed databases or spreadsheets. There needs to be better systems of data collection, standards, and governance.
- Need to demonstrate how sharing data and agreeing on standardization benefits partner agencies.
- Need to link data to business needs.
Improvement Strategies
This section summarizes strategies for MARC and its partner agencies to improve mobility data systems, data collection methods, data storage environments, data quality standards, data integration, data analysis, and analytical tools. The recommended improvement strategies to address each assessment dimension and gap identified above will be prioritized in section 5, as shown in Table 6.
Table 6. Improvement strategies.
| Area of Improvement |
Strategies |
| Data Systems |
Reach out to local governments to determine how to have more consistent regional data for vehicular and truck volumes, and how to make this data easier to share. |
| Reach out to relevant stakeholders to determine a common definition of transit on‑time arrival across different agencies. |
| Reach out to local governments to expand bicycle/pedestrian collaboration effort. |
| Determine steps to develop and adopt a common network or a linear referencing system. |
| Determine standards regarding file storage and organization among departments. |
| Identify core datasets that are ripe for automation. |
| Technology & Tools |
Determine what tools are needed now and in the future to conduct performance management and work with Digital Transportation data. |
| Data Governance |
Develop ideas and structure for MOUs, business rules to get everything in place. |
| Determine what steps could be taken to improve the limitation that license agreements put in data sharing. |
| Consider the creation of a Data Master Plan that ensures projects are planned programmatically. |
| Define an internal collaboration mechanism for data coordination, including plan for quarterly meetings and agenda items. |
| Define a system of better communication and collaboration among data users and collectors within MARC. |
| Develop and use a list of questions to test whether data initiatives/projects are valid and possibly use the list of questions in the quarterly data coordination meetings: Is the data already collected? What is the data for? Who else could use it? Is there a list of metadata? Etc. |
| Develop a data catalog to list all data, source, where it is housed, and who is responsible for maintaining/updating it. |
| Determine what needs to change for: 1) communication, 2) staff training, 3) job descriptions, and 4) organizational structures in order to change data culture within MARC. |
| Consider having a mechanism to show how data management adds value—for instance, conduct a risk assessment (what if MARC does not have the data or it is not integrated?). |
| Consider hiring someone able to develop mobile apps or create an open data platform so the public can do so. |
|