Transportation Systems Management and Operations in ActionPrintable Version [PDF, 2MB]
U.S. Department of Transportation FHWA-HOP-17-025 October 2017 [ Notice and Quality Assurance Statement ] [ Technical Report Documentation Page ] [ SI Conversions ] [ Acronyms ] Table of ContentsList of FiguresList of TablesIntroductionWhat Is Transportation Systems Management and Operations?Transportation systems management and operations, or TSMO, encompasses a broad set of strategies that aim to optimize the safe, efficient, and reliable use of existing and planned transportation infrastructure for all modes. TSMO is undertaken from a systems perspective, which means that these strategies are coordinated with related strategies and across multiple jurisdictions, agencies, and modes. TSMO strategies range from regional traffic signal systems management to shared-use mobility initiatives (refer to Table 1 for an expanded list of strategies). TSMO includes efforts to operate the multimodal transportation system and activities to manage travel demand. TSMO proactively addresses a variety of transportation system user needs by:
TSMO strategies are supported by both institutional and technology-based activities. For example, TSMO is enabled by memorandum of agreement between agencies, operational policies and procedures, and shared resources (e.g., interoperable communications systems, centralized traffic signal operations, and closed circuit television video sharing). What Are the Benefits of Transportation Systems Management and Operations?TSMO strategies have allowed transportation agencies to address transportation issues in the near–term, with lower-cost solutions. TSMO strategies deliver a variety of benefits. These include:
Transportation Systems Management and Operations Strategies Relevant To CorridorsMany TSMO strategies are applicable and effective at the corridor level. Table 1 lists TSMO strategies that agencies can consider when looking to improve the operation of their corridors.
TSMO = transportation systems management and operations.
This brochure will provide an overview of TSMO strategies through recent examples of deployment of such strategies across the country. It is divided into the following sections:
[ Return to top ] Chapter 1. Freeway ManagementFull Virtual Traffic Management Center, OklahomaThe Oklahoma Department of Transportation (ODOT) in partnership with the University of Oklahoma Intelligent Transportation Systems Laboratory, designed and deployed a low-cost, fully virtual traffic management center (TMC). The virtual TMC consists of a geographically distributed fault-tolerant network of desktops referred to as "ITS Pathfinder" or "ITS Consoles," which are capable of controlling intelligent transportation system (ITS) devices visible on the statewide private ITS network.1 Cost-effective Solution. ODOT considered implementing an integrated, multi-agency, centralized TMC, but it was not feasible due to the costs associated with building, operating, and maintaining such a facility. As a result, ODOT opted for the low-cost, distributed, virtual TMC using commercial off-the-shelf desktop computers and an open source GIS mapping software. Interagency Collaboration. Currently, there are 45 agencies participating in this endeavor. ODOT has in place a memorandum of understanding with each agency. ODOT provides stakeholder agencies with ITS Consoles. These can be deployed even in rural areas where there are no fiber optics, provided that there is an Internet connection capable of supporting a secure virtual private network. The ITS Consoles consist of various protocols including closed circuit televisions, dynamic message signs, road weather information system, traffic sensors, and event management, which are integrated into a single system. There are 200 miles of statewide coverage with ITS devices. Most of the devices are located within the Oklahoma City, Tulsa, Lawton, and McAllister areas. ODOT monitors, maintains, and supports the system and also provides training to all partner agencies on an ongoing basis. User privileges are set up by ODOT personnel. For more information contact: Oklahoma Department of Transportation, https://www.ok.gov/odot/ or the Center for Intelligent Transportations Systems, University of Oklahoma, http://its.ou.edu/. Reversible "Flex" Lanes, Taylorsville, UtahIn 2012, the Utah Department of Transportation (UDOT) installed its first flex lane project on 5400 South in Taylorsville, Utah. Flex lanes (also called reversible lanes) are a congestion management tool used to accommodate heavy traffic by changing the direction of one or more lanes during peak hours. This strategy is most effective when there is traffic congestion in one direction during peak travel times. The section of 5400 South carries about 40,000 vehicles per day. By switching the direction of traffic of one of the lanes during peak hours, UDOT saw improvements in traffic flow. The flex lane project allowed four eastbound lanes, a left turn lane, and two westbound lanes during the morning rush hour. During the evening peak, four westbound lanes, a left turn lane, and two eastbound lanes are provided. During all other times, there are three lanes in each direction. 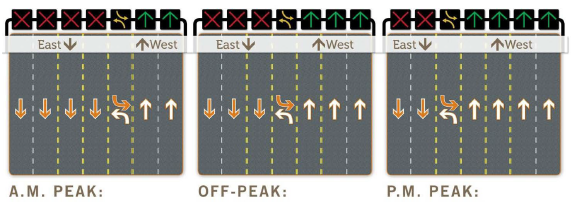 Figure 1. Illustration. Example of flex lane configurations. Source: Utah Department of Transportation Positive Measurable Results. The before and after study of the flex lanes indicate an overall benefit.2 During the AM and PM peak periods in the peak directions, travel times were reduced by 45 seconds and 50 seconds, respectively. Using the travel time savings, the research team estimated that the flex lanes could save users a total of $792,000 per year and reduce emission toxins by 1.24 tons per year. For more information contact: Utah Department of Transportation, https://www.udot.utah.gov/main/f?p=100:pg:0:::1:T,V:191. Dynamic Speed Limits And Dynamic Lane Assignment, Washington StateWashington State Department of Transportation (WSDOT) uses an active transportation and demand management (ATDM) strategy that consists of overhead lane signs to provide motorists with advance notice of traffic conditions. The system reduces the likelihood of collisions and improves traffic flow by using signs that display variable speed limits, symbols to direct drivers to change lanes when a lane is blocked, and messages to warn drivers of congestion or crashes ahead. 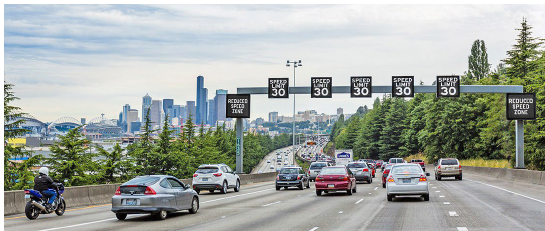 Figure 2. Photo. Variable message signs showing traffic alerts and speed limits for individual lanes. Source: DKS Associates, courtesy of KLiK. One of the first State transportation agencies to use this type of ATDM system, WSDOT implemented it in 2010 on sections of Interstate 5, Interstate 90, and State Route 520. The State's emergency responders report high compliance with the lane control symbols. Law enforcement officers patrolling the corridors also report feeling safer when working on the roadway.3 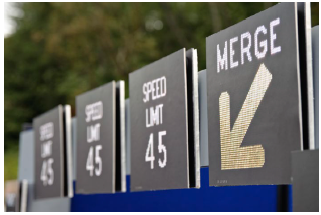 Figure 3. Photo. Example of overhead dynamic speed limit signs. Source: Washington State Department of Transportation Positive, Measurable Results. WSDOT completed a before-and- after crash study to evaluate the ATDM system on Interstate 5.4 They used 3 years of before and after data. The analysis showed a 1.3 percent reduction in weekday collisions and a 14 percent reduction in weekend collisions. WSDOT believes that the ability to provide real-time information to drivers who are unfamiliar to the area may account for the larger weekend reductions. For more information contact: Washington State Department of Transportation, http://www.wsdot.wa.gov/. Transportation Operations Coordinating CommitteeThe Transportation Operations Coordinating Committee (TRANSCOM) is a coalition of the 16 major transportation and public safety agencies in the New York, New Jersey, Connecticut metropolitan region. Its member agencies include major State and city departments of transportation, toll authorities, transit agencies, and State police. In addition to the member agencies, TRANSCOM works with more than 100 other entities, including county and municipal police, fire, and offices of emergency management; metropolitan planning organizations; motor carrier associations and private bus operators. Members are responsible for operating limited access highways and major arterials, commuter rail, subways and light rail, urban and suburban bus systems, tunnels and bridges, airports, marine terminals and bus terminals. Founded in 1986 to facilitate coordination of construction projects on a regional basis, TRANSCOM's role has expanded to include regional traffic and transit incident management, special events management and the implementation of regional intelligent transportation systems (ITS). These activities are supported through TRANSCOM's 24/7 operations information center, which collects and disseminates real-time incident, construction, and special event information to member and non-member agencies. TRANSCOM's information networks include the integration of multi-agency highway and transit travel times, multi-agency video, and historic travel time and event data. This information not only supports member agency traveler information systems, but it is provided free to hundreds of private, government, and academic entities for use in their own applications. TRANSCOM's networks are essential elements for the current implementation of integrated corridor management (ICM) in the region. TRANSCOM works on a cooperative model of decision making, based on robust integrated information and strong working relationships with member and non-member agencies at all levels. It has a formal structure based on a multi-year membership agreement, by-laws and a strategic plan. Positive Results. TRANSCOM has had a clear impact on transportation systems operations. Participants consistently note reduction in incident-related delays and more efficient travel during construction and major events due to TRANSCOM's resources and services. Cost savings and scale economies have resulted due to compatible, regional implementation of ITS systems, resource sharing, and improved information for travelers and shippers. TRANSCOM's combination of relationships and data has been particularly important during severe regional events, such hurricanes and blizzards, where multi-agency decision making is critical. TRANSCOM has become a national model of how separate agencies can work cooperatively to serve the travelling public and it has been a resource to its peers nationally and internationally. For more information contact: TRANSCOM, http://www.transcom.com/. I-44/Route 13 Diverging Diamond Interchange, Springfield, Missouri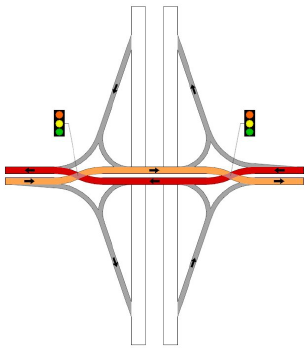 Figure 4. Illustration. Diverging diamond interchange configuration. Source: Missouri Department of Transportation The I-44/Route 13 interchange had a number of issues including: traffic congestion, left-turns backing up and blocking thru traffic, and above average crash frequency. The Missouri Department of Transportation (MoDOT) had limited funds to improve this location and considered three options:
The DDI option was the cheapest to build and maintain, and the quickest to build because it utilized the existing bridge and required no additional right of way. Even so, it was tough to sell the idea to leadership and the public because it would be the first DDI in the United States. To get public buy-in, the project staff utilized an enhanced level of traffic analysis and public outreach including a simulation model and project video designed to showcase how a DDI operates. The project engineer championed the idea to leadership and convinced MoDOT's Central Design staff that the pedestrian access would work well through the middle of the DDI. Thus, in 2009, MoDOT implemented a $3.2 million project to convert the existing interchange into a DDI. Positive, Measurable Results. The DDI yielded multiple benefits. Left-turn movements experienced a noticeable decrease in delay and queuing, although through movements had a slight increase in travel time. The new interchange design improved overall traffic flow and eliminated the previously typical 1-mile backups during the morning and afternoon and the 2-3 mile backups during weekends and holidays. In terms of safety, total crashes decreased by 46 percent in the first year of operation and left-turn right angle crashes decreased by 72 percent. For more information contact: Missouri Department of Transportation, http://www.modot.org/. Rural Queue And Delay Warning System, MissouriThe Missouri Department of Transportation (MoDOT) experienced great success with their Smart Work Zone, and their accident warning dynamic message signs (DMS). MoDOT built upon these two proven tools and launched the Rural Queue and Delay Warning System on I-70 in January 2016. The system uses real-time HERE probe segment speeds to automatically update rural DMS boards with information that is crucial for motorists. The speed data is updated every minute of the day across the entire length of I-70. As speed decreases, the system automatically formats and posts a single phase DMS board message. This automated message tells motorists if they should expect slowed or stopped traffic, where they should expect to encounter it, and how long of a delay they should expect because of it.5 Once the traffic management center operator confirms the details of the cause of the delay, they can execute the response plan and post a second phase to the message board, providing additional information 1. to the motorist about the cause of the delay. The alert system is also tied into MoDOT's Field Alert Traffic System, which provides MoDOT employees with text or email updates of delays for pre- determined routes.6 The alert system, while designed for use by MoDOT staff, has been shared with contractor personnel working on MoDOT rights of way as well as law enforcement partners. There are currently around 200 users of the system. In 2016, MoDOT won ITS America's Best of ITS Heartland Project Award for using urban traffic solutions to manage rural queues. To date, traveler feedback on the system has been positive. For more information contact: Kansas City Scout, http://www.kcscout.com/. See also, MoDOT, http://www.modot.org/. [ Return to top ] Chapter 2. Arterial ManagementRegional Traffic Signal Retiming Program, North Central Texas Council Of Governments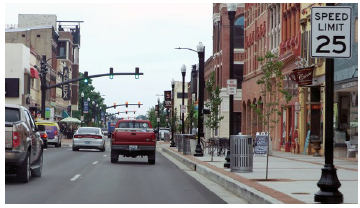 Figure 5. Photo. Example of series of signalized intersections Source: Federal Highway Administration This program, originally named the Thoroughfare Assessment Program (TAP), was launched in 2003 by the North Central Texas Council of Governments (NCTCOG). It was renamed the Regional Traffic Signal Retiming Program (RTSRP) in 2010. More than 1892 traffic signals in various cities in the region were retimed under TAP. RTSRP has multiple phases. Phase I is completed and three other phases are still being implemented. The goal of the program was to reduce vehicular emissions and improve mobility. The program systemically develops, implements, and optimizes 200 traffic signal timing plans along 25 miles of arterial streets in the cities of Arlington, Dallas, and Grand Prairie. Intersection timing plans were analyzed on a system level by organizing them into designated corridors. RTSRP Phase I was implemented in Arlington, Grand Prairie, Dallas, Carrollton, Fort Worth, Lake Worth, Flower Mound, Frisco, Irving, Plano, Hurst, Colleyville, Wylie, Richland Hills, Keller and Watauga. A total of 435 traffic signals were retimed under this phase. To perform signal timing analysis, NCTCOG collected intersection peak-hour turning movements and volume data. It also used an instrumented vehicle to measure travel time for 2,300 miles along the corridors. Four period-based timing plans were developed, namely, weekday AM, midday, PM peaks, and midday weekend peak. After the timing plans were operational, NCTCOG performed extensive fine-tuning to improve on-street performance. Positive, Measurable Results. NCTCOG travel time analysis shows a 7.3 percent overall reduction in travel time and a 31.1 percent overall reduction in number of stops. Synchro™ models also estimated a 14.3 percent reduction in fuel consumption and 4.9 percent reduction in emissions. The estimated user benefit for all corridors comes to approximately $25.7 million in annual savings. In summary, the implementation of this project has benefited the users of these corridors and achieved the goals of reducing emissions and improving mobility. For more information contact: North Central Texas Council of Governments, http://www.nctcog.org/. Adaptive Signal Control Technology, Pinellas County, FloridaIn 2012, Pinellas County installed adaptive traffic control systems (ATCS) along SR 580. ATCS are designed to overcome the limitations of pre-timed and pattern-matching-based control by responding to changes in traffic flow on a continuous basis and adjusting signal timing in accordance with fluctuations in traffic demand. The ability of the system to react to changes in volume is expected to result in reduced delays, shorter queues, and decreased travel times. The SR 580 corridor is a major arterial with segments reaching an average daily traffic count of 44,000 vehicles. The county sought to improve progression along the main line without reducing service levels to minor movements. A nine-intersection corridor along SR 580, spanning approximately 2.3 miles, was selected for ATCS installation. Positive, Measurable Results. Before and after installation, an independent study examined changes in travel time, average speed, and delay by using cameras mounted at each intersection. The study concluded that the operation of the ATCS yielded an increased level of service to the users of SR 580 due to overall reductions in travel times, delays, and the number of stops during the peak hours. Cross street delay results were mixed. The study estimated that average daily vehicle hours traveled declined by 244 hours and daily fuel consumption decreased by 294 gallons. Total annual benefit was estimated at $1.4 million with an overall benefit cost ratio of 20:1.7 For more information contact: Pinellas County Public Works and Transportation, http://www.pinellascounty.org/PublicWorks/ITS.htm. Traffic Estimation and Prediction System, UtahThe Utah Department of Transportation (UDOT) implemented weather-responsive traffic signal timing systems just outside Salt Lake City on the Riverdale Road corridor in Ogden, Utah, a congested non-freeway corridor that carries about 47,000 vehicles a day. The objective of the project was to make UDOT's traffic signal system more responsive to changes in traffic demands and travel speeds during severe weather conditions. UDOT created three special traffic signal timing plans: (1) using no recalls, (2) using minimum recalls on all phases, and (3) using maximum recalls on all phases. The timing plans were downloaded to each of the 11 signalized intersections in the corridor and deployed only when weather events were expected to have a significant impact on traffic operations for an extended period or duration.8 UDOT also installed a road weather information system station in the corridor which collected information on road and weather conditions. The agency fed information, along with traffic counts from loop detectors and roadside sensors, into a traffic estimation and prediction system, which analyzed the data continuously to provided real-time estimates of traffic conditions, network flow patterns, and routing information to traffic signal operators.9Once aware of the impending travel flow deterioration, the system allows the operators to deploy traffic signal timing plans that best match the prevailing travel conditions in the corridor. Positive, Measurable Results. The weather responsive timing plans were deployed a total of 13 times during different winter weather events in early 2013. In over half of these events, the operators' assessment indicated either an average or above average improvement in traffic operations as a result of the weather-responsive timing plans. Before-and-after analyses also showed that UDOT was able to maintain a high level of progression on the corridor by implementing weather-responsive traffic signal timing.10 For more information contact: Utah Department of Transportation, Traffic Signal Program, https://www.udot.utah.gov/main/f?p=100:pg:0:::1:T,V:2960,. Gateway Signal Optimization, Baltimore, MarylandThe City of Baltimore, Maryland, optimized approximately 175 traffic signals along 9 arterials to reduce delay and improve travel time for motorists commuting to and from downtown Baltimore City. Commuters were experiencing significant delays due to closely spaced and poorly coordinated signals. The city identified a need to optimize signal timing plans to serve both the directional commuter peak as well as local traffic patterns, but lacked the resources and experience to undertake the project. Using both local funds and Congestion Mitigation and Air Quality Program funds, they hired a contractor to complete the Baltimore City Gateways Signal Optimization Project. The Baltimore City Gateways Signal Optimization Project included data collection, evaluation of existing conditions, traffic modeling, timing plan development, field implementation and testing, travel time studies, and recommendations. The City of Baltimore later carried out timing optimization on additional roads and the Central Business District; the results were similar and very encouraging. Positive, Measurable Results. The project was an overall success for the City of Baltimore. Optimization of the traffic signals produced a benefit to cost ratio of 51:1 in the first year. Benefits included reducing stops, delays, fuel consumption, and emissions (see table below). The estimated equivalent monetary benefit was approximately $20.4 million in the first year.11
For more information contact: City of Baltimore, Transportation Department, http://transportation.baltimorecity.gov/ 55th Street "Road Diet," Chicago, IllinoisIn 2011, an announcement from Chicago's mayor that the city would install 100 miles of separated bicycle lanes was the starting point that led to the Road Diet on 55th Street. From Cottage Grove Avenue to Dorchester Avenue, this 0.8-mile Road Diet transformed a four-lane roadway with parking on both sides to a three-lane roadway with parking-separated bicycle lanes. 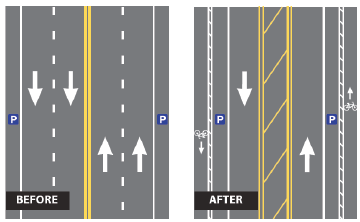 Figure 6. Illustration. Before and after configurations of a roadway treated with a Road Diet. Source: Road Diet Case Studies. Federal Highway Administration. The Chicago Transit Authority (CTA) has a primary bus route along this road, with headways ranging from 5 to 20 minutes throughout the day. The city coordinated extensively with the CTA on the design of the Road Diet. The overall design and layout of the bus stops in coordination with the separated bicycle lanes was a critical issue to maintain efficient bus operation.12, 13 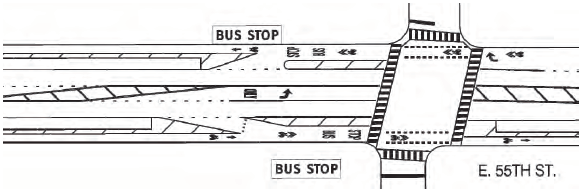 Figure 7. Illustration. Design for the 55th Street Road Diet in Chicago. Source: Road Diet Case Studies. Federal Highway Administration Positive Measurable Results. The 55th Street Road Diet experienced the following results after installation.
For more information contact: Chicago Department of Transportation, https://www.cityofchicago.org/city/en/depts/cdot.html. Neighborhood Greenways, Portland, OregonOver the last decade, the Portland Bureau of Transportation has worked to expand Portland's network of Neighborhood Greenways, or bicycle boulevards, in order to encourage walking and bicycling. These greenways are streets with low traffic volume and speed where bicycles, pedestrians, and neighbors are given priority. Portland currently has over 70 miles of greenways.14 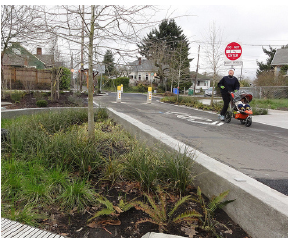 Figure 8. Photo. A neighborhood greenway in Portland, Oregon. Source: Greg Raisman, Flickr. Portland's operational performance guidelines for greenways include:
Positive, Measurable Results. Neighborhood greenways have contributed to the increase in bicycling in the city. Since 2000, the number of Portlanders riding bicycles to work has increased nearly 250 percent. In some census tracts of Northeast and Southeast Portland, bicycle commuting approaches 25 percent of all trips to work. For more information contact: Portland Bureau of Transportation, PDX Streets and Infrastructure, https://www.portlandoregon.gov/transportation/72744 [ Return to top ] Chapter 3. Traffic Incident ManagementCoordinated Highways Action Response Team, MarylandThe Coordinated Highways Action Response Team (CHART) is a joint initiative of the Maryland State Highway Administration, Maryland Transportation Authority, Maryland State Police, Federal Highway Administration, University of Maryland Center for Advanced Transportation Technology and various local governments. The program began in the mid-1980s in an effort to improve travel to and from Maryland's Eastern Shore. It has evolved into a multi- jurisdictional and multi-disciplinary program. Today, this advanced traffic management system is enhanced by a command and control center called the Maryland Statewide Operations Center, the "hub" of the CHART system, functioning 24 hours per day, 7 days per week, with four satellite traffic operations centers located across the State to handle peak-period traffic. 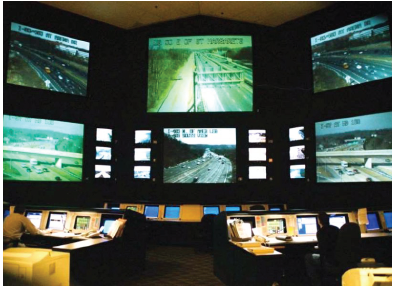 Figure 9. Photo. Maryland Statewide Operations Center. Source: Maryland Coordinated Highways Action Response Team. CHART's mission is to improve "real-time" operations on Maryland's highway system through teamwork and technology. To meet this objective, CHART oversees traffic monitoring, incident response, dissemination of local traveler information via website, traffic management, and severe weather and emergency operations. In 2015, CHART recorded over 77,800 emergency response cases. Data elements for each case included the location of each incident, type of incident, number of lanes closed, incident and disabled vehicles by time of day, source and time of incident detection, and time and duration of incident response. Positive Measurable Results. A benefit analysis was conducted to evaluate the effectiveness of CHART's incident detection, response, and traffic management operations on Interstate highways and major arterials. Monetary benefits were estimated at $1,293 million in reduced delay time, $18.5 million in fuel consumption savings, and $44.7 million in emissions reduction. Although costs were not analyzed or provided, it can be assumed from the benefits that CHART is effective in achieving its mission to improve Maryland's operations. For more information contact: Coordinated Highways Action Response Team, http://www.chart.state.md.us/, or Maryland State Highway Administration, http://www.roads.maryland.gov/Home.aspx. Traffic Incident Management Effort, IndianaFor every minute that a freeway travel lane is blocked during the peak travel period, 4 minutes of delay are generated. Thus, an incident lasting 60 minutes during rush hour will cause a 240 minute delay before normal flow is restored. Chances of a secondary crash increase by 2.8 percent for each minute the primary incident is not cleared. Roadway incidents are estimated to cause 54 percent of congestion in urban areas.15 To help improve incident clearing times, the Indiana State Police and Indiana Department of Transportation with support from the Federal Highway Administration – Indiana Division created the Indiana Quick Clearance Working Group in the fall of 2007. This group changed its name to Indiana's Traffic Incident Management Effort (IN-TIME) in January 2009.16 IN-TIME is a multi-disciplinary effort that enables traffic incident responders from all disciplines to follow agreed-upon multi-lateral policies and procedures while applying the "Open Roads Philosophy." The concept behind this philosophy is that all first responders, after ensuring their own personal safety and the safety and security of any incident victims, should make it their secondary priority to reduce the congestion that leads to higher risk of secondary incidents, which negatively impact both responder and road user safety.17 Innovative Solution. One of the components of IN-TIME is to encourage the training and use of photogrammetry, or the process of making surveys and maps through the use of aerial photographs. With photogrammetry, IN-TIME can use a computer-based program that creates scale diagrams of crash scenes based on digital photographs. The results are accurate to within 1/8th of an inch. By comparison, a fatal crash scene may take several hours for investigators to collect evidence and measurements utilizing traditional methods. Now, with photogrammetry, the same crash scene can be documented in a fraction of the time, sometimes less than 30 minutes. It is estimated that photogrammetry saves an average of 1 hour and 47 per incident as compared to current traditional methods.18 For more information contact: Indiana Traffic Incident Management Effort (IN-TIME), http://www.in.gov/intime/index.htm. [ Return to top ] Chapter 4. Road Weather ManagementRoad Condition Reporting Application, WyomingWyoming Department of Transportation (WYDOT) partnered with the Federal Highway Administration's Road Weather Management Program to develop and implement a weather responsive traffic management strategy called the Road Condition Reporting Application (the "App").19, 20 The objectives of the Wyoming App project were to:
The App was developed to run on a tablet computer that uses Wyoming's communication system. It is used by WYDOT maintenance personnel to report road weather information to the TMC, recommend variable speed limit changes, report snow performance measures, and report a number of different traffic incidents, including crashes and road hazards. The App is also used to share information with maintenance employees, including the road conditions that are reported to the public, variable speed limit information, weather information, messages posted on dynamic message signs, and map-based asset location information. Positive, Measurable Results. Overall, the evaluations indicate improved effectiveness and efficiency of road condition reporting and TMC activities and capabilities during weather events. Furthermore, WYDOT noted improvements in the TMC data management systems, frequency of road reports, field information accuracy, and situation awareness of maintenance employees. For more information contact: Wyoming Department of Transportation, GIS Group, http://gis.wyoroad.info/ Weather Responsive Traveler Information System, MichiganIn partnership with Federal Highway Administration's (FHWA) Road Weather Management Program, Michigan Department of Transportation (MDOT) developed a weather-responsive traveler Wx-TINFO.21, 22 The Wx-TINFO system integrates multiple weather data sources into one program to enable transportation operation center (TOC) staff to provide more accurate, timely, and effective messaging to travelers, thereby improving operating conditions during weather events. The objectives of the Wx-TINFO project included:
The Wx-TINFO application processes the weather data and 4 generates travel alert information, which is linked to dynamic message signs and delivered to the advanced traffic management system automatically. The TOC operators have the ability to approve or override messages, as necessary. Overall, the Wx-TINFO system has improved the traffic management capabilities of MDOT TOC staff during weather events and has provided benefits to travelers by improving the timeliness and content of updates to the public. Positive, Measurable Results. Evaluations of the Wx-TINFO system implementation show an increase in the average number and percentage of dynamic message signs displaying weather alerts. The benefits to travelers include more specific weather- related information messages and statewide decreases in user delay costs between 25 and 67 percent during National Weather Service Advisories and Warnings. For more information contact: Michigan Department of Transportation Intelligent Transportation Systems, http://www.michigan.gov/its. Regional Traveler Information System, South DakotaThe South Dakota Department of Transportation (SDDOT) implemented a weather responsive traffic management (WRTM) strategy that involves mobile data collection and traveler information dissemination during weather events.23, 24 Assisted by the Federal Highway Administration's Road Weather Management Program, SDDOT developed the regional traveler information system in order to help simplify data collection by snow plow drivers and provide expanded and improved traveler information to motorists. The objectives of this WRTM project were to:
An onboard application allows plow drivers to directly enter road conditions into the integrated roadway information system instead of using the radio to inform someone in the office or entering it at the end of a shift. Another element of the project focuses on providing motorists with road condition information on the SafeTravelUSA website, 511 phone system, and mobile phone applications. The 24-hour road condition forecasts come directly from the SDDOT maintenance decision support system and are provided to the public as possible future "threats" when road conditions might be considered unsafe. The new information also includes additional National Weather System alerts and related information. Positive, Measurable Results. A user survey indicated that travelers value the new and improved road condition information. After viewing road condition forecasts, 60 percent of travelers changed the timing of their travel, 53 percent decided to take alternate routes, and 76 percent reported feeling more prepared. For more information contact: South Dakota Department of Transportation, http://www.sddot.com/. Automated Wind Warning System, OregonOne challenge facing rural travelers is the presence of weather hazards such as sustained high winds that can cause high-profile vehicles to overturn, and lower-profile vehicles to leave their lanes, jeopardizing motorist safety. To address localized high cross-wind challenges, the Oregon Department of Transportation (ODOT) used intelligent transportation system installations to alert motorists of dangerously windy conditions automatically. Such a system is known as an automated wind warning system (AWWS).25 How it Works. The AWWS system is designed to warn drivers either to pull over and wait until conditions improve or to take an alternate route. The system connects wind gauges (anemometers) to roadside static message signs. Flashing lights are activated when average wind speeds reach predetermined threshold levels. The system automatically records the severity of the crosswinds and notifies traffic operators of system status. Once wind conditions are verified by the traffic operations center, additional warnings are posted on the ODOT TripChek website. The warning messages are deactivated when wind speeds drop below threshold levels. Positive, Measurable Results. In 2006, ODOT conducted evaluations of AWWS at the following two sites:
The study accounted for reductions in motorist-delay and improvements in safety for motorists and maintenance personnel during high wind events. The benefit-to-cost ratios for the South Coast System and Yaquina Bay Bridge system were 4.13:1 and 22.80:1, respectively. The Yaquina Bay Bridge system had a higher 4 benefit-to-cost ratio reflecting the higher frequency of cross winds in the area and heavier traffic volumes compared to the South Coast System.26 For more information contact: Oregon Department of Transportation Intelligent Transportation Systems, http://www.oregon.gov/ODOT/Pages/index.aspx.[ Return to top ] Chapter 5. Planned Special Event ManagementSuper Bowl, New JerseyIn February 2014, Trenton, New Jersey hosted Super Bowl XLVIII which brought with it an entire week of events and transportation challenges. The event was designated as a National Special Security Event, the highest rating by the Department of Homeland Security for security. Many things made this event challenging:
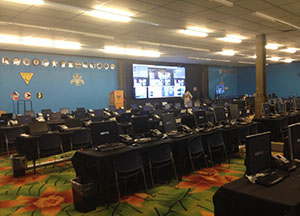 Source: NJDOT. Figure 10. Photo. New Jersey Department of Transportation Command Center. The New Jersey Department of Transportation (NJDOT), New Jersey Turnpike Authority, Port Authority, Port Authority of New York and New Jersey, and the New Jersey State Police (NJSP) Department were charged with traffic management responsibility. Each partner agency was responsible for its own infrastructure. The Super Bowl Transportation and Traffic Subcommittee (STAT) was formed and co-chaired by NJSP and NJDOT. This subcommittee reported up to the NJ Superbowl Working Group (Governor level). Planning began over a year in advance. During that time, the agencies routinely came together and developed a "Play Book" to document all plans, resources, and responsibilities. Some of the most noteworthy solutions that came out of their planning efforts included:
A risk assessment was performed using a probability/impact matrix. Items highlighted were:
The involved agencies worked exceptionally well together throughout the planning, operations, and implementation of traffic management for Super Bowl XLVI and in doing so, strengthened their existing relationships. The lessons learned and collaborative networking will benefit the region's transportation operations for years to come.27 For more information contact: New Jersey Department of Transportation Traffic Operations, Phone: 732.697.7360; http://www.state.nj.us/transportation/ San Sebastian Street Festival, San Juan, Puerto RicoThe San Sebastian Street Festival takes place every January in the historic section of San Juan, Puerto Rico. This part of the city, called Old San Juan, is located on a small island that is only accessible from the mainland by three bridges. The San Sebastian Street Festival brings together more than 200,000 people in less than four days each year. Due to the lack of significant parking spaces in Old San Juan, the narrow streets, and the influx of hundreds of thousands of people converging from all over Puerto Rico, it became necessary to implement a transportation plan.  Figure 11. Photo. San Sebastian Street Festival. Source: leftbank_5, Flickr. Puerto Rico's Department of Transportation and Public Works, Integrated Transportation Authority, Metropolitan Bus Authority, Maritime Transportation Authority, Highways & Transportation Authority, Urban Train, and the Municipality of San Juan joined efforts to develop a collective transportation plan. The plan temporarily closes vehicular access to the San Juan Islet; encourages the public to park in any of the 2,605 parking spaces scattered throughout the Tren Urbano rail stations; and provides 100 buses to transport people from the nearest Tren Urbano station or parking lots to the event, a distance between 4 and 6 miles. Ferry service to the San Juan Islet is also provided from Cataño. The traffic management center (TMC) serves also as the hub for the coordination of these efforts. TMC also collects transportation data and publishes it through the different transportation entities to manage resources according to demand. During the management of this special event, the Puerto Rican Police is also co-located at the TMC to improve interagency communication and coordination. A radio station informs drivers about traffic conditions and live camera feeds of the traffic are available online. Around the event, three streets are reserved for emergency access, and emergency services are on standby in key locations throughout the event. Over 250,000 people were mobilized during the four-day occasion, without any major incidents. The public provided feedback that the buses were reliable and fast and that the transportation strategies implemented during this type of special event have been beneficial to managing visitors demand. The authorities believe that the effective coordination between more than seven agencies was instrumental to the success of this event.28, 29 For more information contact: Department of Transportation and Public Works of Puerto Rico, Phone: (787-843-1125), http://www.dtop.gov.pr/index.asp. [ Return to top ] Chapter 6. Emergency Transportation OperationsNOLA Ready, New Orleans, Louisiana Figure 12. Illustration. Official logo of NOLA Ready. Source:@nolaready, Twitter. "NOLA Ready" is New Orleans' citywide preparedness campaign, managed by the Office of Homeland Security and Emergency Preparedness (NOHSEP). NOHSEP coordinates public safety preparedness campaigns and emergency operations for the City of New Orleans both in and out of hurricane season, working with local and State government agencies, non-profit agencies, and the citizens of New Orleans to help ensure the maximum possible safety of all people and property during a storm.30 As part of NOLA Ready, a day before the 2012 hurricane season began, New Orleans officials launched a website designed to be a one-stop shop for disaster preparation. The page, http://ready.nola.gov, includes registration portals for the city-assisted evacuation plan and the city's emergency notification system, which uses text, email messages, or phone calls to deliver alerts directly to residents.31 The city's website includes information about what to do and expect before a storm, during a storm, and after a storm. In the case of a minor storm, it provides detailed guidance for how residents should prepare their homes. In the case of a dangerous or severe storm, generally a Category 3 hurricane or higher, the city will call a mandatory evacuation. During a mandatory evacuation all citizens must leave New Orleans until officials have designated the city safe for reentry. The website provides information regarding mandatory evacuation procedures and where residents and tourists, who are unable to self-evacuate, can go to get free transportation assistance. The website also contains information on returning home after an evacuation and reopening a business. For more information contact: NOLA Ready, http://new.nola.gov/ready/. [ Return to top ] Chapter 7. Parking ManagementSFpark Demand-based Pricing Pilot, San Francisco, CaliforniaWhen parking is difficult to find, many people double park or circle to find a space, wasting time and fuel. Circling drivers are distracted drivers who are more likely to hit someone crossing the street, a cyclist, or another car. Parking also affects economic competitiveness; if very few spaces are available, fewer people can access commercial districts. As one part of dramatically improving the experience of parking, the San Francisco Municipal Transportation Agency (SFMTA) conducted the SFpark pilot program. The program tested a new parking management system at approximately 7,000 of San Francisco's 28,000 metered on-street spaces and approximately 12,000 spaces in 14 of 20 city-owned parking garages.32,33 Variably Priced Parking Meters. As part of the SFpark pilot, San Francisco deployed smart parking meters throughout the city. These meters allowed the city to adjust the price of parking periodically to match demand, ensuring that spaces remain available so that drivers can quickly locate parking. Demand-responsive pricing encourages drivers to park in underused areas and garages, reducing demand in overused areas. Demand-responsive pricing works to open up parking spaces on each block, reducing circling and double parking. Rates can vary by block, time-of-day, and day-of week, with a ceiling for amount and frequency. Rates can also be varied for events such that parking meters on blocks within walking distance of event or sports venues are priced higher while those events are occurring.34 SFpark Evaluation. In 2014, SFpark released its full evaluation, which demonstrated that demand-responsive pricing can improve parking availability and yield secondary benefits, including reduced congestion and mobile emissions. Demand-responsive rate adjustments continue in the SFpark pilot areas, and SFMTA will use the evaluation results to develop a proposal for expanding the SFpark approach to SFMTA's other meters, lots, and garages.For more information contact: SFpark; http://sfpark.org/. LA Express Park™ Performance Parking System, Los Angeles, CaliforniaA 4.5-square-mile area in Downtown Los Angeles supports LA Express Park™, a program that fuses technology and demand- based pricing into an innovative parking management strategy. LA Express Park began operations in May 2012 and was created as one component of the Los Angeles Congestion Reduction Demonstration, which received $15 million in grants from the U.S. Department of Transportation and $3.5 million in city funds. The program uses technology to help increasing the availability of limited parking spaces, reducing traffic congestion and air pollution, and encouraging use of alternative modes of transportation.35 Increase Parking Availability. LA Express Park was created to make traveling and parking downtown easier by making more parking available in the area and by giving drivers several ways to find where parking is available. The goals of the program were to increase the availability of on-street parking, reduce traffic congestion and associated pollution, encourage a shift in travel choices, and improve the customer experience. Smart parking meters and sensors were installed in all of the approximately 6,300 on-street parking spaces. The project used demand-based pricing for on-street parking and real-time parking availability to improve the utilization of parking spaces. In areas of high demand for on-street parking, the price was increased, and in areas of low demand, the price was decreased. The public was informed of parking availability and 7 current pricing through the parking guidance system. The implementation of a performance parking system in Westwood Village is an extension of the intelligent parking system developed for downtown Los Angeles. For more information contact: LA Express Park, http://www.laexpresspark.org/. 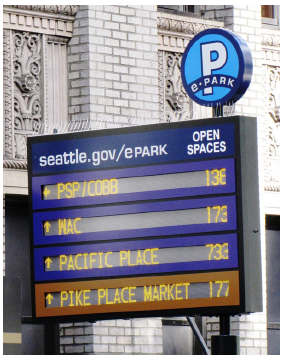 Figure 13. Photo. An e-Park dynamic message sign shows the number of open parking spaces at nearby parking facilities. Source: Seattle Department of Transportation. E-Park Dynamic Guidance System, Seattle, WashingtonParking plays a key role in a multimodal transportation system. The strategies and policies related to parking often directly impact the system as a whole. e-Park is a dynamic parking guidance system that provides travelers to Downtown Seattle with real-time parking availability information. It was conceived as a means to efficiently guide downtown visitors to available parking spaces in privately-owned garages, eliminating the uncertainty of finding a parking space, and to continue attracting visitors to downtown. This includes a system of dynamic message signs strategically placed at critical decision points for drivers as well as a mobile web interface allowing users to access more detailed information for participating garages including rates, access location, and current availability. The city has already made a significant effort in terms of parking wayfinding projects through implementation and completion of e-Park Phase 1. Phase 1 of the e-Park system was launched in September 2010 as a pilot project to determine if a parking guidance and wayfinding system would benefit Downtown Seattle. The system uses technology and marketing to directly guide customers and visitors to available parking. This initial phase included six privately owned garages and five dynamic message signs located along key entrance arterials into the downtown. An evaluation of Phase I saw that during the e-Park system's use from late 2010 through 2013, e-Park garages saw a 6 percent average utilization increase while other garages were down 2 percent. During the same time period, there was a congestion reduction of 33 fewer cars per hour on streets near e-Park garages as compared to streets with other garages. Phase 2 was implemented from 2014 through 2016 to help counteract increased congestion and lost parking spaces due to several major construction projects. It will incorporate e-Park garages within close proximity to those areas where the availability of parking is affected by construction. The city completed Phase 2 in 2016 bringing the total number of participating garages to 16 with over 8,000 parking spaces. E-Park now includes 12 on-street dynamic signs providing information for up to 4 garages or destination areas. Each participating garage also incorporates a smaller dynamic sign above their entrances that confirms space availability. To assist in wayfinding to each garage, 80 static signs guide motorists along designated routes between dynamic sign decision points and garages. In the future, the city looks to add additional garages to the system and upgrade the e-Park technology to continue to share available space information through advancing mobile technology and directly with Google maps and other applications. The Seattle Department of Transportation will also integrate the e-Park data with the current traveler information map system and deploy a common communication network with the intelligent transportation systems to 7 enable central management from the traffic management center.36 For more information, contact: Seattle Department of Transportation, e-Park; https://www.seattle.gov/transportation/projects-and-programs/programs/parking-program/e-park. [ Return to top ] Chapter 8. Work Zone ManagementDynamic Late Lane Merge System, MichiganMichigan Department of Transportation (MDOT) uses the dynamic late lane merge system (DLLMS) to help reduce delays in high- traffic work zones. Often called a "zipper merge," this system allows motorists to use both lanes until reaching the designated merge area, and then drivers "take turns" moving into the open lane. Using the DLLMS is not necessary for all projects or situations. Typically, MDOT chooses specific projects when closures are going to happen during peak hours or in high-volume locations. They have successfully deployed the DLLMS on many projects to help with traffic flow and reduce aggressive driving in work zones. Positive Measurable Results. In 2007, MDOT performed a study to evaluate the effectiveness of the DLLMS at freeway construction work zones.37The presence of the DLLMS improved the traffic flow. Some results are shown in the table below.
Note: Data collected pre-taper.
Source: Michigan Department of Transportation (MDOT), Evaluation of the Dynamic Late Lane Merge System at Freeway Construction Work Zones, RC-1500, September 2007. Available at: https://www.michigan.gov/documents/mdot/MDOT_Research_Report_RC1500_Part1_209842_7.pdf. For more information on all dynamic merge strategies, review 1. Guidance for the Use of Dynamic Lane Merging Strategies.38 The objectives of this document are to introduce innovative merging strategies and their benefits, discuss when and how to implement the merging strategies, and present other key aspects to consider before and during implementation. 2. Synthesis of Intelligent Work Zone Practices.39 The purpose of the project was to document the resources available as well as uses and benefits regarding the following intelligent work zone technologies: queue warning systems, dynamic merge systems, alternate routes, and variable speed limits in work zones. For more information contact: Michigan Department of Transportation, http://www.michigan.gov/mdot/. Work Zone Intelligent Transportation Systems, MissouriPortable intelligent transportation system (ITS) technologies such as dynamic message signs (DMS), highway advisory radio, and queue length detectors are often used by Missouri Department of Transportation (MoDOT) during construction projects to monitor traffic conditions and provide important messages to motorists. These work zone intelligent transportation systems (WZITS) collect data such as traffic speeds and lane occupancy. This information is sent to a computer, and the computer processes the data and determines messages to display on the DMS. At times, MoDOT also links these portable ITS technologies with its permanent ITS infrastructure (e.g., cameras, traffic sensors, transportation management centers) to help support major work zones. Primary Benefit: Using ITS in work zones can improve safety and reduce traffic delay. The technologies provide additional information that can be used to keep motorists advised of conditions ahead, support smooth traffic flow, and provide warnings of incidents or detours. For more information on how MoDOT uses WZITS on projects, refer to MoDOT's Engineering Policy Guide.40 For questions, contact MoDOT Work Zones, http://www.modot.org/workzones/ or MoDOT Intelligent Transportation Systems, http://www.modot.org/services/travel/intelligenttrasportationsystems.htm. [ Return to top ] 1 Federal Highway Administration (FHWA), Guidelines for Virtual Transportation Management Center Development, FHWA-HOP-14-016 (Washington, DC: December 2014). Available at: https://ops.fhwa.dot.gov/publications/fhwahop14016/fhwahop14016.pdf. [ Return to note 1. ] 2 Utah Department of Transportation, 5400 South Flex Lanes Before/After Evaluation, Bangerter Highway to Redwood Road, Taylorsville, Utah. June 24, 2013. [ Return to note 2. ] 3 Washington State Department of Transportation, "Benefits of ATDM." Available at: http://www.wsdot.wa.gov/Operations/Traffic/ActiveTrafficManagement/Benefits.htm. [ Return to note 3. ] 4 Washington State Department of Transportation, The 2014 Corridor Capacity Report, October 2014, p. 44. Available at: http://wsdot.wa.gov/publications/fulltext/graynotebook/CCR14.pdf#page=44. [ Return to note 4. ] 5 Missouri Department of Transportation News Release, "MoDOT Receives Governor Award for Quality and Productivity," last modified: October 28, 2016. Available at: http://www.modot.org/newsandinfo/District0News.shtml?action=displaySSI&newsId=208949. [ Return to note 5. ] 6 Missouri Department of Transportation, Transportation Planning, Field Traffic Alert System, April 2016. Available at: http://www.modot.org/innovationschallenge/documents/FieldTrafficAlertSystem.pdf. [ Return to note 6. ] 7 Rhythm Engineering, "Case Study: Pinellas County, FL," April 2013, 11228 Thompson Avenue, Lenexa, KS 66219[ Return to note 7. ] 8 Federal Highway Administration, "Weather Responsive Traffic Signal Timing in Utah Department of Transportation," FHWA-JPO-13-092 (Washington, DC: 2013). [ Return to note 8. ] 9 Federal Highway Administration, Implementation of a Weather Responsive Traffic Estimation and Prediction System (TrEPS) for Signal Timing at Utah DOT, FHWA-JPO-14-140 (Washington, DC: July 2014). Available at: http://ntl.bts.gov/lib/52000/52600/52623/FHWA-JPO-14-140_v2.pdf. [ Return to note 9. ] 10 Federal Highway Administration, "Weather Responsive Traffic Signal Timing in Utah Department of Transportation," FHWA-JPO-13-092 (Washington, DC: 2013). Available at: http://ntl.bts.gov/lib/51000/51000/51007/30EA885D.pdf. [ Return to note 1. ] 11 Federal Highway Administration, An Agency Guide on Overcoming Unique Challenges to Localized Congestion Reduction Projects, FHWA-HOP-11-034 (Washington, DC: 2011). Available at: http://www.ops.fhwa.dot.gov/publications/fhwahop11034/fhwahop11034.pdf. [ Return to note 11. ] 12 Federal Highway Administration, Road Diet Case Studies, FHWA-SA-15-052 (Washington, DC: 2015). Available at: https://safety.fhwa.dot.gov/road_diets/case_studies/roaddiet_cs.pdf. [ Return to note 12. ] 13 City of Chicago, Streets for Cycling Plan 2020. Available at: https://www.cityofchicago.org/content/dam/city/depts/cdot/bike/general/ChicagoStreetsforCycling2020.pdf. [ Return to note 13. ] 14 Portland Bureau of Transportation, "Neighborhood Greenways 101." Available at: https://www.portlandoregon.gov/transportation/article/554110. [ Return to note 14. ] 15 Indiana's Traffic Incident Management Effort, "INdiana – Traffic Incident Management Effort" brochure. Available at: https://www.allencounty.us/homeland/images/training_exercise/docs/INTIME_fact_sheet_ver_5_June_2013.pdf. [ Return to note 15. ] 16 State of Indiana, "Traffic Incident Management Effort" web page. Available at: http://www.in.gov/intime/2332.htm. [ Return to note 16. ] 17 Indiana's Traffic Incident Management Effort, "INdiana – Traffic Incident Management Effort" brochure. Available at: https://www.allencounty.us/homeland/images/training_exercise/docs/INTIME_fact_sheet_ver_5_June_2013.pdf. [ Return to note 17. ] 18 Indiana State Police, "Photogrammetry Technology Speeds Crash Investigations," Press Release. Last modified: June 19, 2009. Available at: http://www.in.gov/archivecalendar/EventList.aspx?fromdate=1/1/2009&todate=12/31/2009&display=Month&type=public&eventidn=24386&view=EventDetails&information_id=48848&print=print. [ Return to note 18. ] 19 Federal Highway Administration, "Wyoming Department Transportation (WYDOT) Road Condition Reporting Application for Weather Responsive Traffic Management," FHWA-JPO-16-271 (Washington, DC: 2016). Available at: http://ntl.bts.gov/lib/57000/57000/57049/FHWA-JPO-16-271_v2_-_WyDOT_Flyer.pdf. [ Return to note 19. ] 20 Federal Highway Administration, Wyoming Department of Transportation. Road Condition Reporting Application for Weather Responsive Traffic Management, FHWA-JPO-16-266 (Washington, DC: 2016). Available at: http://ntl.bts.gov/lib/56000/56800/56890/FHWA-JPO-16-266_v2.pdf. [ Return to note 20. ] 21 Federal Highway Administration, "Michigan Department of Transportation (MDOT) Weather Responsive Traveler Information (Wx-TINFO) System," FHWA-JPO-16-324, (Washington, DC: January 2016). Available at: http://ntl.bts.gov/lib/57000/57000/57050/FHWA-JPO-16-324_v1_-_MDOT_Flyer.pdf. [ Return to note 21. ] 22 Federal Highway Administration, Michigan Department of Transportation (MDOT) Weather Responsive Traveler Information (Wx-TINFO) System – Final Report, FHWA-JPO-16-323 (Washington, DC: January 2016). Available at: http://ntl.bts.gov/lib/58000/58000/58015/FHWA-JPO-16-323.pdf.[ Return to note 22. ] 23 Federal Highway Administration, South Dakota Department Transportation (SDDOT) Regional Traveler Information System for Weather Responsive Traffic Management, FHWA-JPO-16-325 (Washington, DC: 2016). Available at: http://ntl.bts.gov/lib/57000/57000/57051/FHWA-JPO-16-325_v1_-_SDDOT_Flyer.pdf. [ Return to note 23. ] 24 Federal Highway Administration, South Dakota Department of Transportation (SDDOT) Regional Traveler Information System for Weather Responsive Traffic Management, FHWA-JPO-16-269 (Washington, DC: 2015). Available at: http://ntl.bts.gov/lib/56000/56900/56952/FHWA-JPO-16-269_V1.pdf. [ Return to note 24. ] 25 M. Kumar and C. Strong, Comparative Evaluation of Automated Wind Warning Systems – Showcase Evaluation #15. Western Transportation Institute, February 2006. Available at: https://ntl.bts.gov/lib/25000/25100/25145/426705_Final_Report.pdf. [ Return to note 25. ] 26 M. Kumar and C. Strong, Comparative Evaluation of Automated Wind Warning Systems – Showcase Evaluation #15. Western Transportation Institute, February 2006. Available at: https://ntl.bts.gov/lib/25000/25100/25145/426705_Final_Report.pdf. [ Return to note 26. ] 27 New Jersey Department of Transportation, New Jersey: Touchdown for TSM&O – A Case Study, June 2014. Available at: http://www.transportationops.org/case-studies/new-jersey-touchdown-tsmo-case-study-super-bowl-xlviii. [ Return to note 27. ] 28 "DTOP: Over 250,000 transported to San Sebastián Street Festival," Caribbean Business, January 18, 2016. Available at: http://caribbeanbusiness.com/dtop-over-250000-transported-to-san-sebastian-street-festival/. [ Return to note 28. ] 29 "Special Transportation Service Offered for San Sebastián Street Festival," Caribbean Business, January 14, 2016. Available at: http://caribbeanbusiness.com/special-transportation-service-offered-for-san-sebastian-street-festival/. [ Return to note 29. ] 30 City of New Orleans, NOLA Ready. Available at: http://ready.nola.gov/home/.. [ Return to note 30. ] 31 Michelle Krupa, "New Orleans residents urged to visit ready.nola.gov to prepare for hurricane season," The Times-Picayune, May 31, 2012. Available at: http://www.nola.com/hurricane/index.ssf/2012/05/new_orleans_residents_urged_to.html. [ Return to note 31. ] 32 San Francisco County Transportation Authority, San Francisco Parking Supply and Utilization Study, November 2016, Accessible at: http://www.sfcta.org/sites/default/files/content/Planning/ParkingSupply_and_Utilization/Parking_Supply_final_report_11.29.16.pdf. [ Return to note 32. ] 33 San Francisco Metropolitan Transportation Agency (SFMTA), SFpark Pilot Project Evaluation: The SFMTA's evaluation of the benefits of the SFpark pilot project, June 2014. Available at: http://direct.sfpark.org/wp-content/uploads/eval/SFpark_Pilot_Project_Evaluation.pdf. [ Return to note 33. ] 34 SFpark. Available at: http://sfpark.org/. [ Return to note 34. ] 35 LA Express Park™. Available at: http://www.laexpresspark.org/. [ Return to note 35. ] 36 Seattle Department of Transportation, Task 4: Its Parking Strategies – Next Generation ITS, 2014. Available at: http://www.seattle.gov/documents/departments/sdot/freightprogram/task17_29_14.pdf. [ Return to note 36. ] 37 Michigan Department of Transportation, Evaluation of the Dynamic Late Lane Merge System at Freeway Construction Work Zones, RC-1500, September 2007. Available at: https://www.michigan.gov/documents/mdot/MDOT_Research_Report_RC1500_Part1_209842_7.pdf. [ Return to note 37. ] 38 American Traffic Safety Services Association, "Guidance for the Use of Dynamic Lane Merging Strategies," November 2012. Available at: https://www.workzonesafety.org/training-resources/fhwa_wz_grant/atssa_dynamic_lane_merging/. [ Return to note 38. ] 39 Michigan DOT, ENTERPRISE Pooled Fund Study TPF-5(231), "Synthesis of Intelligent Work Zone Practices," June 2014. Available at: http://enterprise.prog.org/Projects/2010_Present/iwz/ENT_SynthesisofIWZPractices_FINALReport_June2014.pdf. [ Return to note 39. ] 40 Missouri Department of Transportation, Engineering Policy Guide, "616.13.6.3 Work Zone Intelligent Transportation Systems (WZITS)," Accessible at: http://epg.modot.org/index.php?title=616.30_Work_Zone_Capacity%2C_Queue_and_Travel_Delay#616.13.6.3_Work_Zone_Intelligent_Transportation_Systems_.28WZITS.29. [ Return to note 40. ] [ Return to top ] | |||||||||||||||||||||||||||||||||||||||
|
United States Department of Transportation - Federal Highway Administration |
||