2016 Urban Congestion Trends
Using Technology to Measure, Manage, and Improve Operations
Printable Version [PDF, 5.6 MB]
You may need the Adobe® Reader® to view the PDFs on this page.
Contact Information: Operations Feedback at OperationsFeedback@dot.gov

U.S. Department of Transportation
Federal Highway Administration
Office of Operations
1200 New Jersey Avenue, SE
Washington, DC 20590
FHWA-HOP-17-010
May 2017
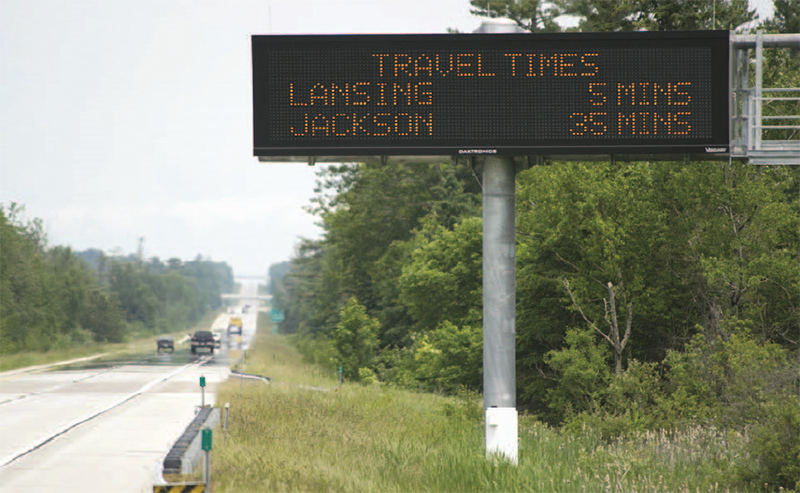
(left to right: Photo by: Bildagentur Zoonar GmbH/Shutterstock.com; Photo by: Ralf Gosch/Shutterstock.com; Photo by: Jeff Thrower/Shutterstock.com)
The 2016 Urban Congestion Trends Report provides the current status of congestion and reliability in 52 of the largest metropolitan areas in the United States. This report also highlights relevant successful operational strategies and performance management approaches implemented by State and local transportation agencies.
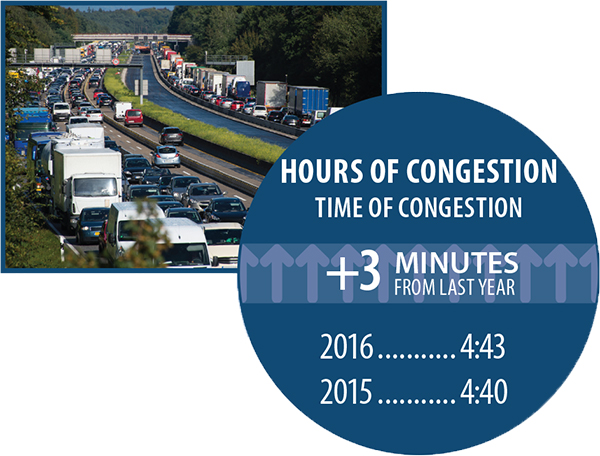
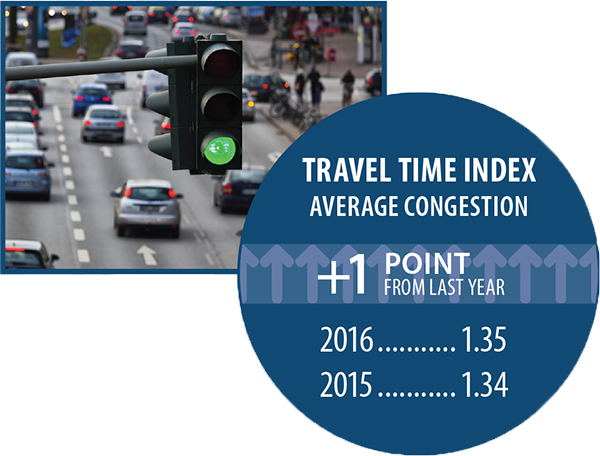
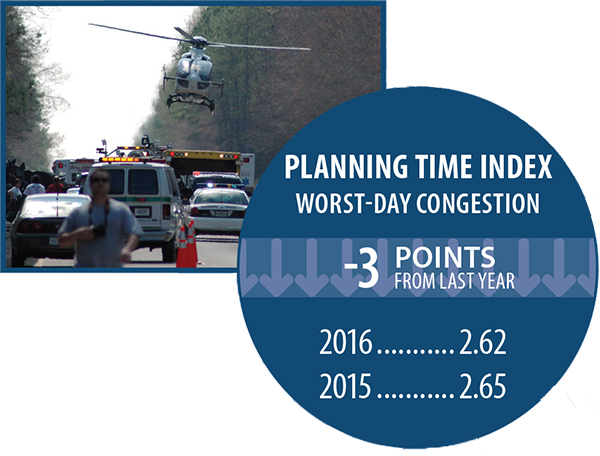
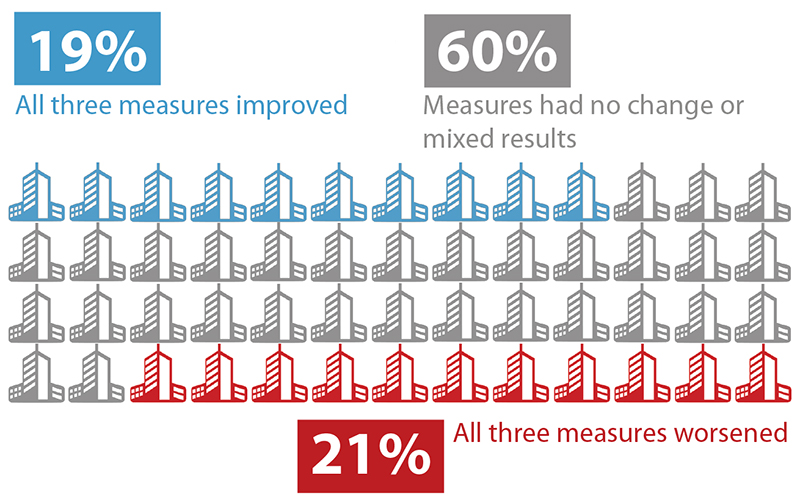
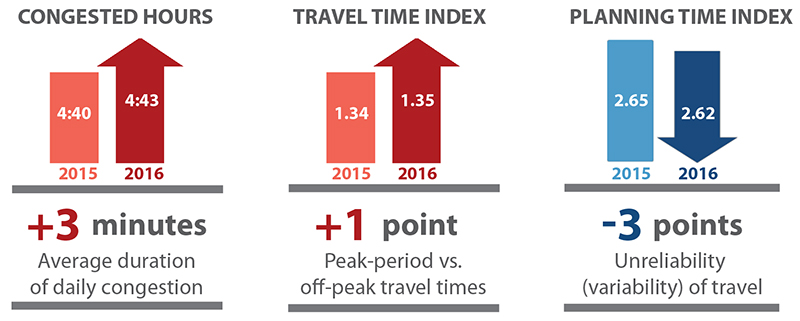
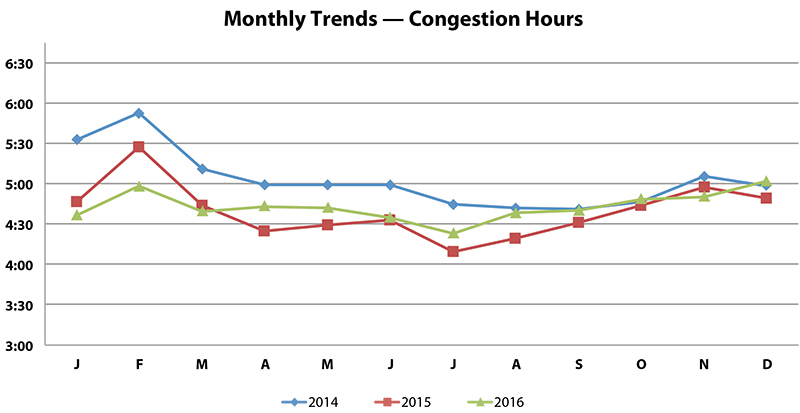
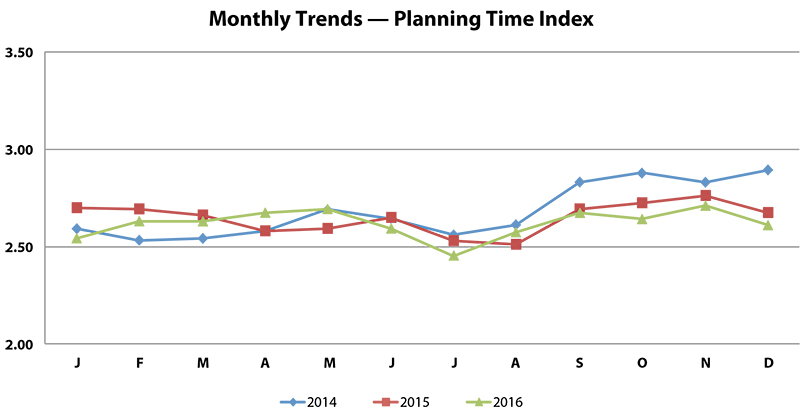
The graphic below provides 2015-to-2016 congestion trends from Federal Highway Administration's (FHWA) Urban Congestion Report (UCR). Overall, congestion has remained relatively flat, increasing by 3 minutes from 4:40 hours in 2015 to 4:43 hours in 2016. The national congestion measures across all 52 metropolitan statistical areas (MSAs) included in the UCR are mixed from 2015 to 2016. There is a slight increase in the time of congestion and average conditions, with a slight improvement in reliability across the nation in the 52 MSAs. Because the causes of congestion and factors impacting reliability are varied, there are equally numerous ways to address congestion and reliability. The focus of this report is how operational improvements and strategies can help address growing congestion while improving reliability.
For the third year, the National Performance Management Research Data Set (NPMRDS) has been used to calculate congestion and reliability metrics for the UCR. The data set includes actual, observed travel times on the National Highway System (NHS) and is freely available for use by State departments of transportation (DOTs) and metropolitan planning organizations (MPOs) for their performance management activities. This report documents a few examples from regional and local agencies using the NPMRDS to better understand and report on how their transportation system is operating. This report also includes selected examples of innovative ways States and local agencies throughout the United States have implemented effective operations and measured the impacts on congestion. The report concludes with a brief discussion of the capability maturity model as applied to Operations Performance Management.
Urban Congestion Trends
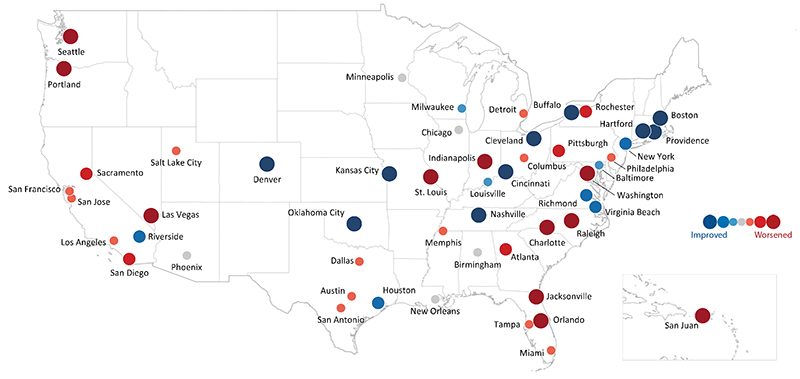
Year-to-Year Congestion Trends in the United States (2015 to 2016)
NOTES
The results in this map are annual congestion trends. Quarterly UCR data are available at http://www.ops.fhwa.dot.gov/perf_measurement/ucr/.
Each symbol ( ) represents 1 metropolitan statistical area.
Congestion Facts
- From 2015 to 2016, the congestion measures at the national level were mixed and generally flat. Small increases in congested hours (3 minutes) and 1 point for Travel Time Index were counter to the 3-point decrease in the Planning Time Index measure.
- Across the country, 19 percent (10) of the 52 reported-on MSAs improved in all three of the calculated measures.
- Twenty-one percent of the MSAs (11) deteriorated in all three congestion measures in 2016 compared to their 2015 values.
- The time penalty for a trip in an average day increased or remained the same in 75 percent (39) of the MSAs.
- Travel time on the worst day per month decreased or remained unchanged in 67 percent (35) of the MSAs.
Congestion Measure Definitions
- Hours of congestion—amount of time when freeways operate less than 90 percent of free-flow freeway speeds.
- Travel Time Index (TTI)—time penalty for a trip on an average day. A TTI of 1.30 indicates a 20-minute free-flow trip takes 26 minutes (20 × 1.30) in the rush hours.
- Planning Time Index (PTI)—time penalty for a trip to be on time for 95 percent of trips (i.e., late for work on one day per month). A PTI of 1.60 indicates a 20-minute free-flow trip takes more than 32 minutes (20 × 1.60) one day per month.
Previous year's performance measures have been updated using the most recently available (2013) national volume data.
Practical Applications of the NPMRDS
What Is the NPMRDS, and How Are Agencies Using It?
FHWA's Office of Operations acquired the NPMRDS for use in the UCR and freight performance measures programs. This national historical traffic speed data set covers the entire extent of the NHS. It includes observed measurements (collected 24 hours a day) and provides the user with day-to-day travel times in 5-minute intervals in three ways—trucks, passenger vehicles, and all vehicles.
FHWA has made the data set available to State DOTs and MPOs to facilitate the application and use of performance measures. There is no charge to access the data, and the data are archived and updated monthly.
Three examples of NPMRDS use are described here. First is an example of how the Great Lakes Regional Transportation Operations Coalition (GLRTOC) used NPMRDS to calculate some proposed measures from MAP-21. Second is how the Transportation Operations Coordinating Committee (TRANSCOM) is using the NPMRDS to assist with the review of traffic incidents. Finally, the Columbus, Georgia–Phenix City, Alabama Metropolitan Planning Organization (CPCMPO) uses NPMRDS data, where available, in its congestion management process, replacing data previously gathered by floating–car analysis.
Great Lakes Regional Transportation Operations Coalition
Through a project funded by the Multistate Corridor Operations and Management program, the GLRTOC has been generating mobility performance measures for member agencies in the Great Lakes mega-region, primarily using the NPMRDS. In preparing member agencies for the MAP-21 system performance measures, GLRTOC, working with the University of Wisconsin–Madison Traffic Operations and Safety Laboratory, developed documents and applications that assist members with interpreting and visualizing the proposed measures.
GLRTOC multi-state mobility performance reporting includes comparisons of measures and a mobility anomaly scanner that detects significant impacts to mobility such as those from major incidents, work zones, or winter weather. The scanner functions through a process control algorithm developed to scan tens of thousands of interstate miles each month to identify major disruptions to passenger and freight mobility. The data and web-based reporting mechanisms are used for after-action review of major incidents, including assessment and reporting of recovery time.
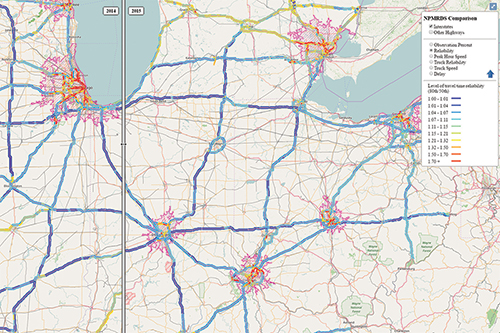
Top: Map with a dynamic slider comparing user-selectable measures.
Bottom: Excerpt of results that graphically display reliability measures.
Source: NPMRDS, 2014 and 2015 data, Great Lakes/Mid-America Region
For more information:
Pete Rafferty, prafferty@wisc.edu
http://www.glrtoc.org/operations/performance/
TRANSCOM
The TRANSCOM is a coalition of 16 transportation and public safety agencies in the New York/New Jersey/Connecticut tri-state region. TRANSCOM improves the mobility and safety of the traveling public by supporting its member agencies through interagency communication and the enhanced use of their existing traffic and transportation management systems. As a part of this mission, performance measurement tools have been developed to assist agencies with proposed measures from MAP-21. Analysis can be done by yearly, monthly, and quarterly time periods. Multi-year performance measures allow comparison across years using the NPMRDS starting from 2012.
TRANSCOM's MAP-21 tool allows users to select different areas for analysis and summaries by MPO, county, predefined trips, and dynamic origin-destination (user defined). The tool also has an interactive chart and map that allow users to view results for various performance measures for their selected area of interest. In addition to the visual component, there is a data export option for measures based upon user inputs.
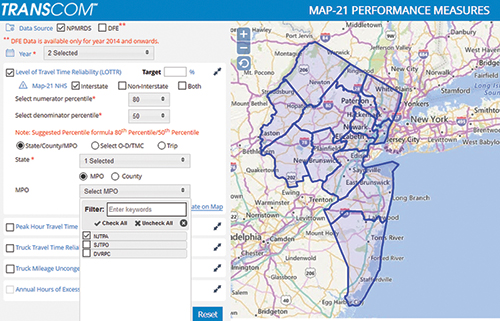
The MAP-21 tool has an interactive chart and map that allow users to view results for various performance measures.
For more information:
Rob Bamford, bamford@xcm.org
https://connectdot.connectsolutions.com/p5mspx9leq8/
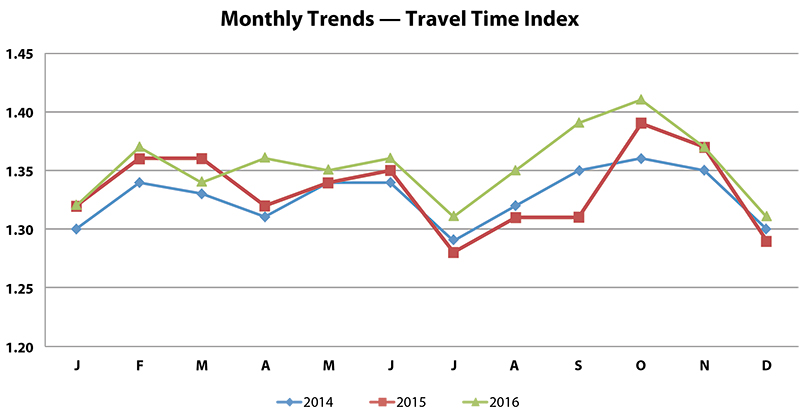
CPCMPO Congestion Management Process
Columbus-Phoenix City Metropolitan Planning Organization (CPCMPO) uses congestion measures, one of which is travel time/speed, as a part of it's congestion management process. In previous congestion management updates, the NPMRDS was not available, requiring CPCMPO staff to conduct floating-car analysis. The disadvantage of doing a floating-car survey is that the sample size is limited, and it requires significant staff time. With the NPMRDS, thousands of vehicles passively contribute travel time data, making the data set more robust and reducing the staff time required to obtain the data.
The metric CPCMPO used to define congestion was the travel time ratio. This is the average travel time using NPMRDS divided by the base free-flow travel time from the 2014 Georgia DOT Travel Demand Model. The thresholds used were developed with guidance from the Highway Capacity Manual.
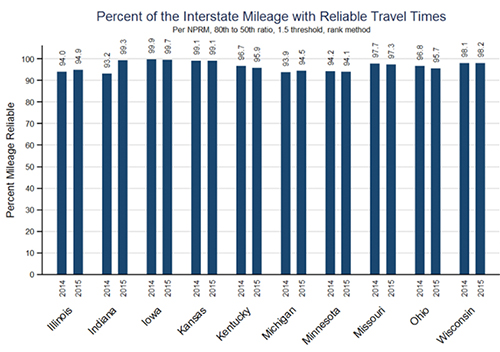
With these thresholds, CPCMPO is able to create charts highlighting the travel time ratio threshold for specific or requested NHS segments as well as to summarize the NHS roadways for its entire area.

Example chart highlighting the travel time ratio by threshold.
For more information:
Logan Kipp, lkip@columbusga.org
Operational Improvement Evaluations — Using Technology to Improve Operations
The evaluations that follow highlight innovative ways that agencies throughout the United States have improved performance through effective operations.
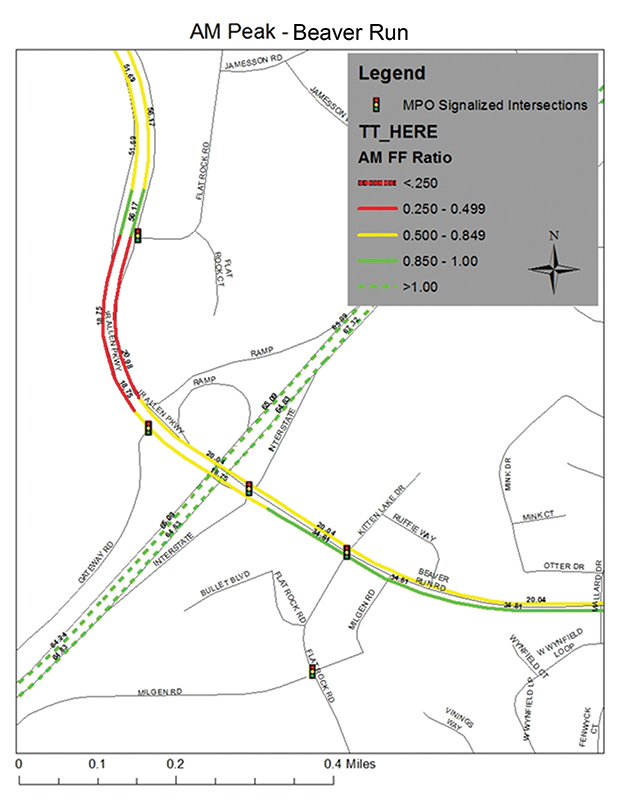
I-66 Active Traffic Management — Virginia Department of Transportation
Active Traffic Management
ATM produces positive operational and safety benefits across multiple measures
(Benefits: reduced congestion, increased safety, higher reliability, and decreased delay).
The Investment
Construction of a Virginia Department of Transportation project to install an active traffic management (ATM) system on I-66 was completed in September 2015. The project was constructed to improve safety and operations on I-66 through better management of existing roadway capacity. The main components of the ATM system were advisory variable speed limits, queue warning systems, lane use control signs, and hard shoulder running (HSR). A before-and-after study was conducted to quantify its effectiveness. The operational measures of effectiveness (MOEs) included the ATM utilization rate, average travel time, travel time reliability, and total travel time delay.
The Return
ATM produced positive operational benefits across multiple MOEs. ATM generally had limited operational impacts during the weekday peak periods, given that static HSR was already in use during weekday peak periods, but produced some impacts during the midday and off-peak weekday periods. Average weekday travel times typically improved by 2 percent to 6 percent during midday and in the off-peak direction during peak periods. Average travel times and travel time reliability improved by approximately 10 percent during the weekend peak periods.
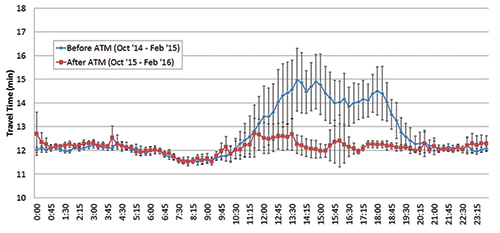
Westbound before and after average
weekend average travel time profile.
For more information:
Mike Fontaine, Virginia DOT, Michael.Fontaine@VDOT.Virginia.gov
http://www.virginiadot.org/vtrc/main/online_reports/pdf/17-r5.pdf
Weather-Responsive Traffic Management — Wyoming Department of Transportation
Weather-Responsive Traffic Management
Accuracy of field information was substantially improved along with the effectiveness and efficiency of reporting road conditions.
(Benefits: reduced delay, increased reporting, and improved safety).
The Investment
FHWA's Road Weather Management Program partnered with the Wyoming Department of Transportation (WYDOT) to develop a new software application to improve the way maintenance personnel report road and weather conditions to their statewide transportation management center (TMC) and recommend variable speed limit (VSL) changes. The Road Condition Reporting Application (the App) was built to run on a tablet computer that utilizes Wyoming's statewide communication system called WyoLink.
The primary goal of the WYDOT project was to improve maintenance staff road condition reporting. Specific objectives were to:
- Improve the efficiency of road condition reporting using a mobile application.
- Improve the efficiency of the TMC operations in taking actions based on the reported road conditions.
- Improve the timeliness of updated traveler information.
- Improve the situational awareness of maintenance staff in the field regarding road weather conditions.
The Return
The use of the App improved the effectiveness and efficiency of road condition reporting and TMC activities during weather events. Operators stated the App was easier to use than the radio. Accuracy of field information was substantially improved, specifically, road condition reports doubled, VSL and DMS change requests tripled, and location of incident reporting was more accurate.
For more information:
Vince Garcia, Wyoming DOT, vince.garcia@wyo.gov
http://ntl.bts.gov/lib/57000/57000/57049/FHWA-JPO-16-271_v2_-_WyDOT_Flyer.pdf
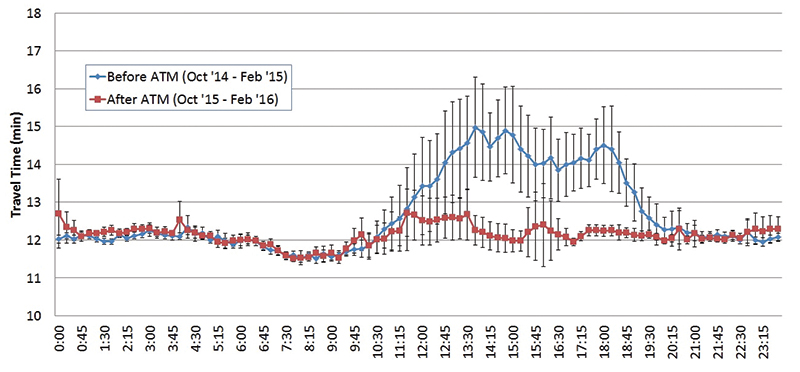
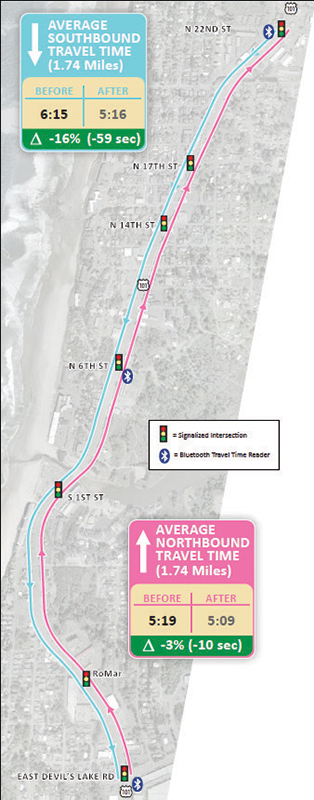
Adaptive Signal Control Technology — Oregon Department of Transportation
Adaptive Signal Timing System
Adjusting real-time splits, cycles, and offsets automatically based on volume conditions on a cycle-by-cycle basis
(Benefits: reduced delay, increased throughput, and reduced travel times).
The Investment
US 101 in Lincoln City, Oregon, experiences seasonal traffic volume fluctuations due to tourists visiting the coastal city during sunny summer days. The previous signal timing, operating in fixed time-of-day mode, could not detect the various changes in traffic demand as a result of local events, weather changes, or tourist traffic. The Oregon Department of Transportation (ODOT), also manually changed the cycle length to better match the summertime traffic conditions. As a result, the congestion condition on the arterials became greater.
To address the traffic fluctuations, ODOT installed an adaptive traffic signal system at seven intersections within Lincoln City. The system's signal timing runs autonomously and locally on the signal controllers. The traffic signal performance measures information is sent to a central server for data collection purposes. The project uses Bluetooth readers that were developed by Oregon State University and ODOT as well as using the 1/10th of a second Purdue, Indiana DOT high resolution detector data and signal performance measures developed by the American Association of State Highway and Transportation Officials (AASHTO) and Utah DOT.
The Return
The local adaptive traffic signal firmware adjusts real-time splits, cycles, and offsets automatically based on volume conditions on a cycle-by-cycle basis.
Travel time has been reduced in the range of 5 percent to 23 percent in the corridor. A mainline delay reduction of 5 percent (up to 20 percent) was observed along the 1.74-mile section of road.
For more information:
Julie Kentosh, Julie.L.Kentosh@odot.state.or.us
http://www.westernstatesforum.org/Documents/2016/presentations/ODOT_KentoshSpencer_SUMMARY_LincolnCityAdaptiveSignal.pdf
Intelligent Transportation Systems Benefit Cost Analysis — Michigan Department of Transportation
Intelligent Transportation Systems
Analysis will inform future investment decisions and help MDOT respond to requests for information about ITS and its value
(Benefits: reduced delay, crashes, and emissions, with significant returns on investments).
The Investment
To quantify the benefits and costs of Intelligent Transportation Systems in Michigan, researchers used performance data collected by Michigan Department of Transportation's (MDOT) transportation operations centers (TOCs). The following technologies and services were included in the benefit-cost analysis:
- Closed-circuit television (CCTV) cameras, which monitor real-time roadway conditions and provide information to first responders and the public.
- Microwave vehicle detection systems (MVDS), which provide information about vehicle speeds, volumes, classification, and occupancy that is useful for real-time incident identification and analysis of conditions over time.
- DMSs, which provide real-time information about road conditions to drivers.
- Freeway Courtesy Patrol (FCP), which provides several services to motorists involved in freeway incidents. Two of Michigan's three TOCs operate FCP, and the third plans to implement it.
The Return
When all benefits are taken into account, ITS in Michigan was found to provide $3.16 in benefits for every dollar invested. Researchers also calculated the benefits of the various types of devices. CCTV had the greatest benefit statewide, with a benefit-cost ratio of 3.95, although DMS and FCP were only slightly lower at 3.81 and 3.82, respectively. MVDS installations reported a benefit-cost ratio of 1.02, likely because of their relatively low usage.
For more information:
Collin Castle, castlec@michigan.gov
http://www.michigan.gov/documents/mdot/RC1631_495995_7.pdf
Performance Management and Operations
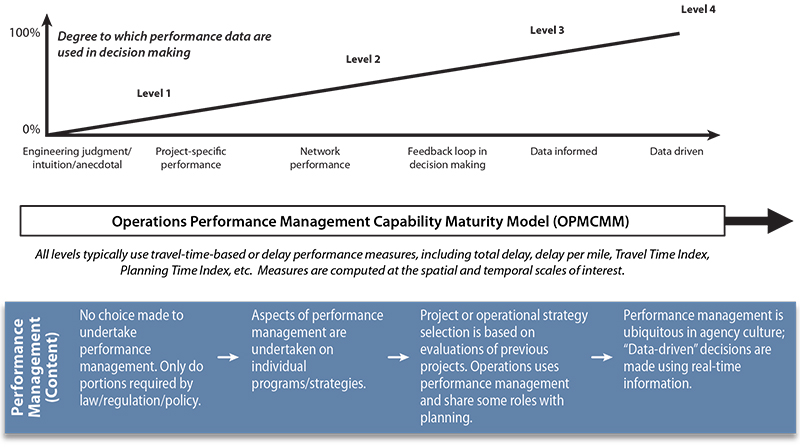
Capability Maturity Model: Evolving from Performance Reporting to Performance Management
The capability maturity approach identifies the current strengths and weaknesses of an agency's current capability level in the key dimensions shown to be critical to improving Operations Performance Management effectiveness on a continuous basis. These areas include performance measures, performance management, data, modes, facility and trip coverage, and traveler preferences/tradeoffs. The graphic below illustrates the capability maturity model. The evaluation provides the user with a starting point to develop agency actions to improve the effectiveness of the agency's Operations Performance Management activities.
For more information:
Rich Taylor, Rich.Taylor@dot.gov
https://ops.fhwa.dot.gov/publications/fhwahop14012/index.htm
Contact Information
For more information on this report, contact Rich Taylor (Rich.Taylor@dot.gov).
Visit the Operations Performance Measurement Program Urban Congestion Reports Web page for quarterly congestion trend updates:
ops.fhwa.dot.gov/perf_measurement/ucr/index.htm.
FHWA-HOP-17-010