Road Weather Management Benefit Cost Analysis CompendiumCHAPTER 4. CASE STUDIES FOR SURVEILLANCE, MONITORING, AND PREDICTION
Note: Use the hyperlinks in this table to jump directly to the case study.
CASE STUDY 4.1 – MICHIGAN DEPARTMENT OF TRANSPORTATION REGIONAL ROAD WEATHER MANAGEMENT INFORMATION SYSTEMS (RWMIS) PRE-DEPLOYMENT STUDIES7
Project Technology or StrategyThe Michigan Department of Transportation (MDOT) developed its Road Weather Management Information Systems (RWMIS) to help local agencies and travelers better react to weather conditions affecting the roads. The Michigan's DOT Regional Pre-deployment Program is responsible for deploying and operating a number of surveillance, monitoring, and prediction tools to mitigate the impacts of adverse weather or optimize activities such as maintenance in favorable weather, including the following:
Project Goals and ObjectivesMDOT completed RWMIS pre-deployment plans for five of the State's seven regions. As part of this process, MDOT performed BCA for the RWMIS deployment in four regions: North, Bay, Grand, and Superior. In order to provide comparable benefits and costs within the analysis, MDOT carefully selected key MOEs to fully capture the benefits of the program. These measures included:
MethodologyData outputs were obtained from the statewide travel demand model to use as inputs into the ITS Deployment Analysis System (IDAS) model. The model data included both network files and travel demand files representing daily volumes for 2010. The project team used a combination of national default values, such as accident rates, vehicle fuel efficiency, emissions rates, etc.; values developed for the Southeast Michigan ITS Deployment Study conducted from 2000 to 2002; and values estimated based on research conducted specifically for the project as the estimated impact of the ITS deployment. Annualized capital costs were added to operational and maintenance costs to estimate annual expenditures. The principal benefits expected from RWMIS deployment were reduction in crashes and travel time savings. The data available to estimate these benefits is scarce due to limited national deployments. As more systems are deployed nationwide, more accurate data on crash reductions and time savings will be available. For this study the researchers relied on the earlier MDOT studies and additional primary research conducted for this study. In order to estimate the deployment benefits, assumptions about crash frequencies and total trips were input into the regional TDM and IDAS. A full citation of the MDOT study is provided at the end of this case discussion. Model Run ResultsThe BCA conducted for the RWMIS deployment included capital costs (which were annualized to compute the net benefits and benefit cost ratios) and annual operations and maintenance (O&M) costs for each region. In each case, the benefits and costs are measured against a no deployment base case. Care must always be taken when selecting the base case condition. This was a deploy/no deploy evaluation, but the analysts could have considered what other actions might have been taken in the absence of the deployment. Such actions could alter the cost and benefits available from RWMIS. The number of ESS to be deployed was estimated at 15 in the Bay Region, 34 in the Superior Region and 50 in the North Region (no information was available for the Grand Region).8 The costs were as follows (in 2007 dollars):
Rural RWMIS deployments show estimated benefit cost ratios of 2.8 to 7.0 depending upon the region. Table 12 below shows the benefits and costs of proposed RWMIS. The benefit cost ratios are higher in the Bay and Grand regions where fewer Environmental Sensor Stations are proposed but where more motorists are served by the system. Travel time savings provide a significant proportion of the benefits in these regions. In the more rural North and Superior regions, a higher proportion of benefits are found in crash reduction and operating costs, with less in travel time savings due to significantly lower traffic volumes.
The results of the BCA showed rural road weather management information system deployments to be extremely efficient investments. The potential benefits include reduced travel time, crash reduction during adverse weather, and operating cost savings through more efficient use of winter maintenance resources. The results, made more relevant by the fact that they were generated through a valid and systematic process, were extremely valuable in making the case for investment in RWMIS. Key ObservationsThis case evaluated two transportation system management and operations (TSMO) weather-related technologies in Michigan rural regions. MDOT used the IDAS BCA tool to assist with the agency's analysis. This decision was made in part due to MDOT's experience with the regional travel demand model and their ability to rerun the TDM to test alternatives. Testing the deployment before expanding the system provided the sensitivity analysis decision makers needed before committing to system expansion. A BCA allows the user to examine the efficiency of the installation and compare it to alternative assumptions. This case study examined RWIS on four regions in Michigan before expanding the system. The BCA for each region provided the agency with a perspective on how the costs and benefits can vary by geography and other regional characteristics. This case showed that winter maintenance costs decreased with increased use of weather information and with improved accuracy. Therefore, agencies should consider expanding the use of current resources and investing in improving the accuracy of their weather information to realize cost savings. ReferenceDan Krechmer, et.al. Benefit–Cost Evaluation Techniques for Rural ITS Deployments, January 2010. CASE STUDY 4.2 – THE UTAH DEPARTMENT OF TRANSPORTATION WEATHER OPERATIONS/ ROAD WEATHER MANAGEMENT INFORMATION SYSTEM PROGRAM9
Project Technology or StrategyThe Utah Department of Transportation (DOT) implemented a weather operations program that assists the agency's operations, maintenance, and construction functions by providing detailed, often customized, area-specific weather forecasts. Established under the Utah DOT Traffic Management Division, the RWMIS program is responsible for deploying and operating a number of transportation systems management and operations (TSMO) strategies in the region, including the following:
Project Goals and ObjectivesThe State of Utah expanded the number of its weather station installations as a result of hosting the 2002 Winter Olympics. During the Olympics, a report on hazardous weather potential was issued twice each day for the primary transportation corridors. After the Winter Olympics concluded, these efforts developed into Utah DOT's Weather Operations/Road Weather Management Information System (RWMIS) program. This program supports the agency's operations, maintenance, and construction functions by providing detailed, area-specific weather forecasts. For the purposes of this project, the goal was to determine the benefits and costs associated with outputs from the weather operations program, specifically in the context of winter maintenance. For simplicity, the benefit cost analysis (BCA) considered only benefits related to a reduction in winter maintenance costs associated with materials and labor. Anecdotal evidence indicated that the program has supported improved anti-icing operations, which have likely reduced crash frequency and severity, thereby saving lives and reducing crash-related delay. However, these benefits were not quantified in this analysis. MethodologyAn artificial neural network (ANN) model of winter maintenance costs was developed. It calculated the labor and materials cost for a given maintenance/materials storage facility (shed) as a function of the following key factors:
The model was developed based on winter maintenance cost data from Utah DOT maintenance sheds for winter 2004–2005 to estimate the cost-effectiveness of the State's Weather Operations/RWMIS program. The actual data from this season comprised the baseline for the BCA and included a mix of sheds that relied heavily on the program, used it occasionally, or did not use it. The baseline was compared with a "no program" alternative to reflect the material and labor cost savings in winter maintenance funds resulting from use of the weather operation program. Model Run ResultsIt was estimated that the weather operations program in place saved Utah DOT more than $2.2 million during 2004–2005 from reduced winter maintenance costs. Given that the program costs approximately $200,000 to operate, the result translates into a benefit cost ratio of over 11:1. The analysis team collected operating and cost data from maintenance sheds across the State. These data and the use of RWMIS in selected sheds allowed the team to document how the use of RWMIS impacted operating costs. The model estimated the value and additional savings potential of the Utah DOT weather service to be 11–25 percent and 4–10 percent of the Utah DOT labor and materials costs for winter maintenance, respectively. It was unclear how labor costs might be impacted by program expansion, therefore ranges of potential savings on future deployments were estimated. Anecdotal evidence indicated that the program has supported improved anti-icing operations, which have likely helped to reduce crash frequency and severity, thereby saving lives and reducing crash-related delay. However, these benefits were not quantified in the analysis. The BCA results highlight the potential benefits that may be realized by an agency expanding the program and using improved weather information to direct its winter maintenance activities. Key ObservationsThis analysis sought to quantify the benefits and costs of weather information by focusing on a case study of Utah DOT with its nationally unique Weather Operations/RWMIS program. Using an ANN10 approach, it is estimated that the benefit cost ratio associated with the program is greater than 11:1, based simply on the labor and materials cost savings associated with winter maintenance. The true benefit cost ratio of the program may be higher, as there are other program users whose economic benefits were not considered as a part of this study. Therefore, as shown in this case study, the Utah DOT weather operations program is quite cost-effective and has the potential for greater benefits in the future. Using a combination of multiple TSMO strategies to add capacity offers an enormous potential benefit in reducing winter maintenance costs through improved weather information. In fact, potential benefits are likely greater than those mentioned. It would be valuable to have benefit–cost information on other sources of weather information more commonly used by transportation agencies, such as RWIS networks, decision-support systems, and private-sector forecasting services. The approach used in this research shows that it is possible to quantify in economic terms the benefits of weather information for winter maintenance. From a modeling perspective, ANN was successful in finding some meaningful, logical results from the noisy data associated with winter maintenance cost activities over one season. It was able to estimate labor and materials costs precisely, and the model predicted changes in costs that were consistent with what would be expected under different traffic volume and winter severity characteristics. ReferenceChristopher Strong and Xianming Shi, "Benefit Cost Analysis of Weather Information for Winter Maintenance," Transportation Research Record: Journal of the Transportation Research Board, 2055(2008): 119–127. CASE STUDY 4.3 – IMPLEMENTATION OF BRIDGE CONDITION MONITORING SYSTEM FOR WATER SCOUR11
Project Technology or StrategyScour refers to the erosion that results from flowing water, which excavates and carries away material from stream beds and banks. Different materials scour at different rates; for example, flowing water erodes loose soils rapidly, whereas cemented soils are more likely to resists the scouring effect. Determining the magnitude of scour is complicated because of the cyclical nature of the scour process. Scour can be deepest near the peak of a flood, but hardly visible as floodwaters recede and scour holes refill with sediment.12 Bridge scour is the erosion of sand and rock around bridge foundations, piles, abutments or piers and is the primary cause of bridge failure in the United States. There are more than 20,000 highway bridges that are rated "scour critical."13 Selected bridges have been monitored for more than 10 years and valuable field data have been obtained from observing the effects of scour on these structures. There are three basic types of fixed scour monitoring systems.14 These include fixed instrumentation, portable instrumentation, and geophysical instrumentation. Fixed instrumentation monitors are firmly attached to one or more piers. They usually connect to a data logger to communicate remotely, or their data can be downloaded manually onsite. This analysis assumes the implementation of fixed scour monitoring systems. They offer several advantages over the other systems, such as providing a constant flow of data to agencies, or offering multiple features that portable or geophysical instruments do not offer. Note that cost values can differ among three types of system. Project Goals and ObjectivesThe primary goal of this case study is to analyze the feasibility of a bridge scour monitoring system at a hypothetical site using fixed monitoring technology. The results of a National Cooperative Highway Research Program (NCHRP) study on bridge scour monitoring were used in this BCA case study to determine the benefits and costs of implementing a fixed scour monitoring system in a hypothetical State. This case study demonstrates how transportation professionals can conduct a BCA to evaluate this type of strategy. MethodologyThe NCHRP survey data used in this case study provided cost information for 11 States, representing 41 bridge sites. The survey found that installation costs were often not available and labor costs were usually combined with other construction costs. Costs can vary due to various factors such as site conditions, type of installation, monitoring instrument, number of sites, and contract type. Bridge owners and operators were less likely to provide data on the costs of installation, operation, maintenance, and repairs. COSTS The hypothetical State is assumed to implement a monitoring system on one bridge. This case is intended to demonstrate a feasibility analysis using BCA for one bridge out of the more than 20,000 highway bridges in the United States that are rated "scour critical." An average cost of $15,000 for a fixed scour monitoring system is used for a single bridge. This figure was determined through the evaluation of midpoints of the NCHRP survey responses. Furthermore, this example assumes that one instrument per site (including remote technology) can supply sufficient information to the agency to make informed decisions to address the condition of the bridge. Most sites offer multiple locations where monitoring systems can be implemented, and it is not uncommon that multiple systems are put into place at a single bridge. However, for the purpose of this analysis, it is assumed that one system per bridge is sufficient. In this example, implementation costs of the new scour monitoring systems are input into TOPS-BC. They replace the default data for other RWM strategies available in the tool. The tool provides several cost line items on its cost pages for other RWM strategies, separated into Basic Infrastructure Equipment and Costs and Incremental Deployment Equipment. The first section includes all costs that constitute basic infrastructure needs of an agency for a specific project. The default information for other RWM strategies included in TOPS-BC was replaced for this study with the NCHRP estimate mentioned above. The second category includes all equipment items that are needed on an incremental basis; the size of the planned system determines the quantity of incremental equipment. The cost item necessary for this analysis was added to the model in the Basic Infrastructure Equipment and Costs section, since only one bridge is in the focus of the analysis. Figure 11 shows the cost sheet within TOPS-BC with the above assumptions- no incremental deployment equipment, and one cost item in the first cost section. Furthermore, this analysis utilizes the assumption of a Texas Department of Transportation (TxDOT) study indicating that 25 percent of the capital costs associated with system monitoring are necessary for operation and maintenance.15 The calculation therefore results in average annual costs of $18,750. 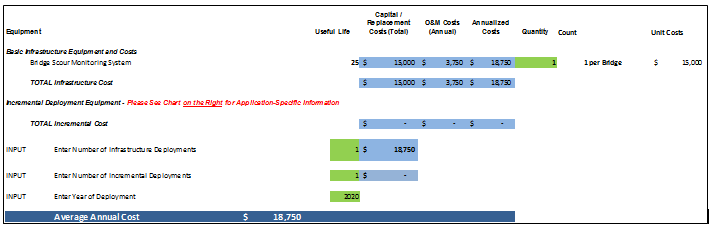 Figure 11. Screenshot. Tool for Operations Benefit/Cost cost estimate for a bridge condition monitoring system for water scour. BENEFITS In order to estimate the benefits of a bridge monitoring system in the hypothetical State, the analysis utilizes historical data on bridge failures within the United States. Based on the literature, the average number of bridge failures is 1 in 4,700 annually.16 Therefore, the annual number of bridge failures in the State is assumed to be 0.000213. Finally, it is assumed that each bridge failure in the State is related to some loss of life. The average number of fatalities in the case of a bridge failure based on four examples mentioned in literature is 26.17 However, this analysis assumes a more conservative number of 10 fatalities for bridge failures in this State. For this reason, the factor of 0.000213 is multiplied by 10. The resulting amount of annual fatalities in the hypothetical State that can be averted using this safety strategy is 0.00213. This number is then multiplied by the default monetary value of an avoided fatality listed on the benefit sheet within TOPS-BC. The tool allows the analyst to enter user-specific benefits when such values are available. The result of this analysis is entered into the cell under user-specific benefits. Figure 12 shows the safety section of the benefit calculation sheet within the tool. It does not show the user-specific benefits, since these were derived separately. However, the illustration includes the default value of a statistical life utilized by TOPS-BC as well as the result of the safety analysis. The analysis calculates the total average annual benefits of this strategy for a single bridge at about $22,890. 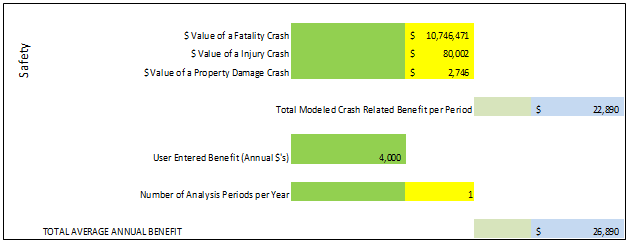 Figure 12. Screenshot. Tool for Operations Benefit/Cost safety benefit estimate for a bridge condition monitoring system for water scour. Additionally, it is reasonable to assume that a remote water scour monitoring system eliminates the need for on-site visits by DOT staff. According to TxDOT, the cost for an on-site visit is at least $8,000.18 Additionally, Washington State DOT estimates that on-site visits are regularly performed on bridges with high scour-risk; these inspections take place at least every other year.19 Therefore, considering the assumptions made above, this analysis adds $4,000 per year to the previously calculated safety benefits using the user-specific cell in TOPS-BC. This analysis focuses on a single year, and on-site inspection costs by TxDOT are assumed to be valid for a 2-year cycle, which is why the previously mentioned $8,000 is divided by 2 years. Note that the preset number of analysis periods per year in TOPS-BC is 250, one for each weekday of the year, but since this analysis takes an annual approach, this value was set to 1. Note that this analysis does not take into consideration possible benefits occurring from reduced operating and maintenance costs of bridges. The benefits of continuous scour monitoring are the reduction of the probability of scour-related damages or failure. The earlier a scour problem is recognized, the less expensive the costs of remedial action.20 Monitoring also increases the likelihood of scour issue recognition during floods when periodic or special manual inspections are not feasible.21 Electronic monitoring is acceptable to get a bridge judged scour critical removed from the list of scour critical bridges, but not as a substitute for federally mandated inspections at specified intervals. The benefits of continuous monitoring include 1) early warning of impending failure during flooding, allowing the closure of the bridge; 2) a reduced probability of damage or failure; and 3) real-time data for calibrating scour prediction equations.22 Continuous monitoring also reduces the chances that a traffic agency will need to close a bridge prematurely during an incident—a clear benefit to users. Model Run ResultsThis section sums up the results of the benefit cost analysis of the bridge scour monitoring system implemented on a hypothetical bridge. As stated above, the case study analyzes a specific set of costs and benefits for demonstration purposes. A full benefit-cost analysis will include a wide range of additional costs and benefits that are not separately listed or analyzed in this study. The results of benefit and cost estimations are summarized within the tool on a single page. This gives the analyst a concise overview of all estimations and results. Figure 13 shows the benefit/cost summary of this project using TOPS-BC. For this case study, safety and inspection benefits were calculated manually and input as Safety and User Entered line items under the Annual Benefits category. The other annual benefits shown in Figure 13 are not estimated. The benefits of the system exceed its costs, as total benefits are $26,890 compared to $18,750 in costs for the installation of a bridge scour monitoring system on a single bridge. These results generate a benefit/cost ratio of 1.43, as shown on the summary table. 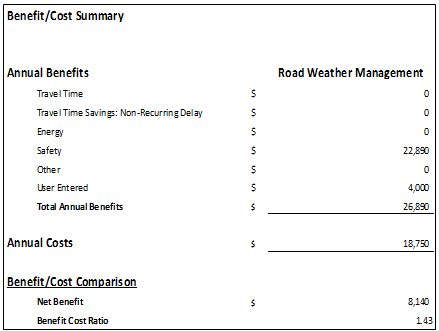 Figure 13. Screenshot. Benefit-cost analysis results for a bridge condition monitoring system for water scour. ReferencesB.E. Hunt, NCHRP Synthesis 396: Monitoring Scour Critical Bridges, "Chapter 4: Experience with Scour Monitoring Systems," (Washington, DC: Transportation Research Board of the National Academies: 2009). Available at: http://onlinepubs.trb.org/onlinepubs/nchrp/nchrp_syn_396.pdf Wesley Cook, Bridge Failure Rates, Consequences, and Predictive Trends (2014), available at http://digitalcommons.usu.edu/cgi/viewcontent.cgi?article=3187&context=etd WSDOT, Scour Repairs, available at https://www.wsdot.wa.gov/Bridge/Reporting/ScourRepairs.htm TxDOT, Remote Bridge Scour Monitoring (1999), available at https://ctr.utexas.edu/wp-content/uploads/pubs/3970_1.pdf CASE STUDY 4.4 – ROAD WEATHER INFORMATION SYSTEM (RWIS) DEPLOYMENT IN IDAHO23
Project Technology or StrategyIn the past few years the ITD has invested over $15 Million in expanding and modernizing its RWIS network at strategic locations statewide. Non-invasive pavement sensors have been installed at nearly every site that report pavement temperature, layer type (water, ice, snow), layer thickness, and "grip" (the coefficient of friction). The current RWIS inventory statewide is 130 sites with three additional new sites under construction. ITD has developed a winter performance management program to quantify how well the maintenance crews are maintaining safe roads during and after winter storm events. The winter performance measures track the success of the road treatments, and the percentage of time the grip measurement was maintained in the safe driving range (grip >0.6) when the road surface temperature was below freezing and precipitation is present. The deployment of RWIS using state of the art non-invasive pavement sensors together with the atmospheric sensors has advanced the capabilities of ITD maintenance crews to better plan their winter storm response, both in chemical treatment selection and application timing. The results of the winter maintenance activities are now measured through a Winter Performance Measurement Program that evaluates how well each maintenance crew is doing with regards to achieving and maintaining safe grip on the roads during and after storm events. This case study examines how the benefits and costs of the system and the process implemented by ITD can be weighed against each other using TOPS-BC.24 Additionally, this analysis highlights the usefulness of RWIS deployment and how it can impact highway safety. This case mainly utilizes information provided by ITD in a report published in 2014 on the effectiveness of the RWIS system in Idaho.25 Note that due to the report's sole focus on safety benefits, this analysis mainly includes safety benefits and does not consider other benefits associated with the system. Project Goals and ObjectivesThis case study analyzes the costs and benefits of RWIS deployment in Idaho using TOPS-BC. The BCA aims to achieve several goals:
MethodologyITD deployed various RWIS sites over three years, from 2010 to 2013. As Table 13 displays, ITD deployed 9 RWIS sites from 2011-2012 and 24 new sites from 2012-2013. Since TOPS-BC considers one distinct set of assumptions at a time, it is run twice for this analysis, once for each of the two periods of RWIS deployment. Table 13 shows the observed reduction of 75 crashes for 2011-2012 as well as a reduction of 154 crashes for 2012-2013. Also shown in Table 14 is the estimated average value per crash of $72,700 in Idaho for both seasons, based on 674 reported crashes involving fatalities, serious injury, and property damage. Note that this average was calculated specifically for the State of Idaho. To perform this analysis in a different State or region, area-specific data must be used.
The benefits and costs of both seasons, 2011-2012 and 2012-2013, were evaluated by ITD using a project-specific spreadsheet tool. In this case, the benefits and costs are re-evaluated in TOPS-BC and the same results are achieved. TOPS-BC offers the ability to evaluate about 14 operations strategies and technologies using common assumptions. This allows the analyst to not only evaluate a specific project, but to compare preset alternatives. Benefits result from the number of reduced crashes multiplied by the value per crash. Costs result from the number of RWIS sites deployed in the respective year multiplied by $125,000 installation cost for each site, and operating and maintenance costs of $5,500 per year per site. Both cost components are added up and annualized over 10 years. This calculation results in annualized costs of $162,000 for the season 2011-2012. The following section shows the cost and benefit estimation results for the Season 2011-2012 and how they were generated using TOPS-BC. Additionally, the results section briefly mentions similar benefits and costs for 2012-2013. COSTS To use TOPS-BC for this BCA, the necessary cost components have to be established. As stated earlier, the tool can be downloaded from FHWA's website. Figure 14 shows the Opening Screen of TOPS-BC. By clicking on Estimate Life-Cycle Costs the user is redirected to a menu where he can select numerous cost sheets. Since the tool is developed in MS Excel, the user can adjust and modify the contents of all sheets within TOPS-BC. However, there are some cells in those sheets that the user cannot change. 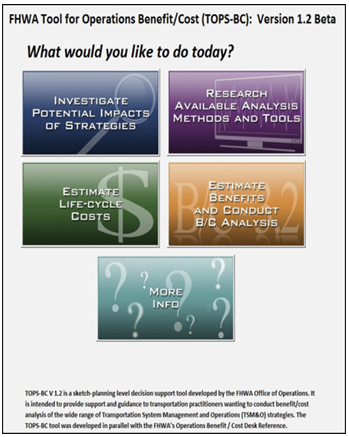 Figure 14. Screenshot. Tool for Operations Benefit/Cost opening screen. In an RWM cost sheet within the tool, a new line was inserted for the new cost item "RWIS Site Deployment." The number of sites, capital costs, and operations and maintenance costs for both seasons were adopted from the ITD report. Figure 15 shows the cost sheet within TOPS-BC for the first season of 2011-2012. The benefits and costs methodologies are analogous for the season 2012-2013, hence not specifically displayed in this case study. The results section summarizes the outcomes of both seasons, 2011-2012 and 2012-2013. As the figure shows, the annualized costs over 10 years for Season 2011-2012 are $162,000 which matches the costs estimated by ITD. The next section explains the benefit estimation using TOPS-BC. 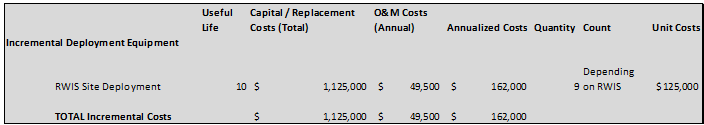 Figure 15. Screenshot. Tool for Operations Benefit/Cost cost sheet for the Idaho Transportation Department road weather information system, 2011-2012. BENEFITS The second step of the BCA is estimating benefits. TOPS-BC includes preset dollar values for various benefit calculation components. These preset parameters include different monetary values for fatalities, injuries, and property damage incidents. However, the ITD study and report used a fixed dollar amount of $72,700 in order to estimate the safety benefits of the RWIS system which represents the average cost per crash in Idaho, including fatality, injury, and property damage crashes. In TOPS-BC, the total reduction of 75 incidents for the season 2011-2012 needed to be separated into fatalities, injuries, and property damage. This separation was necessary, since TOPS-BC bases the benefit calculation on a distribution among these three types of impacts. Additionally, it is good practice to split up incidents into these three categories when using TOPS-BC, since the dollar values assigned to each impact vary substantially. This analysis adopts the standard distribution TOPS-BC uses among property damage, injuries, and fatalities, and applies it to the total reduction of 75 crashes. These factors are then utilized in the benefit calculation. This process guarantees that fatalities, injuries, and property damages are appropriately weighed for the benefit calculation. Table 15 shows the results of distributing 75 crashes in those three categories using TOPS-BC.
Model Run ResultsFinally, the analysis compares the results of the benefits calculation with the results of the cost calculations. Figure 16 shows the sections of TOPS-BC that compare benefits and costs for the Season 2011-2012 and Season 2012-2013 respectively. Both sections indicate that RWIS site deployment in Idaho was cost effective, since the resulting benefit cost ratio (BCR) for the season of 2011-2012 is 34 to 1 and the resulting BCR for 2012-2013 is 19 to 1. 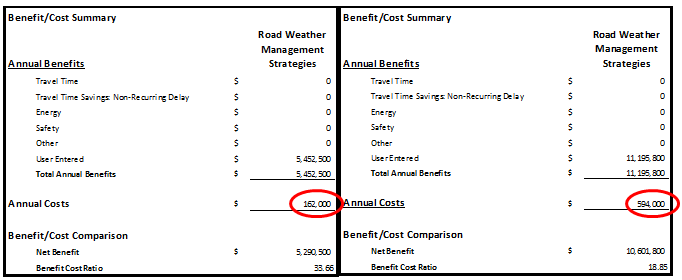 Figure 16. Screenshot. Benefit cost ratio for season 2011-2012 and 2012-2013. Key ObservationsThis case study evaluates the deployment of Road Weather Information System sites in Idaho as an RWM BCA example. Please note that this case study merely analyzes a specific set of costs and benefits for demonstration purposes. A full benefit cost analysis will include a wide range of additional costs and benefits that are not separately listed or analyzed in this write up. TOPS-BC was used to assist with the analysis. Data assumptions from the 2014 ITD report are cited earlier. This study demonstrates that RWIS deployment costs can be recovered by the benefits of enhanced road safety and reduced crash frequency on the highways. ReferenceR. Koeberlein, D. Jensen, and M. Forcier, "Relationship of Winter Road Weather Monitoring to Winter Driving Crash Statistics," (October 24, 2014). Available at: http://docs.trb.org/prp/15-0242.pdf. CASE STUDY 4.5 – HIGH WATER DETECTION SYSTEM IN TEXAS 26
Project Technology or StrategyFlash flooding is the leading cause of weather-related deaths in the United States. Roughly 200 deaths occur annually due to flash floods, and even though there can be great variability from year to year, more than half of flood-related drownings involve a vehicle. Texas usually has the most flood fatalities, with South Central Texas known as Flash Flood Alley because it represents the area most prone to this type of flooding in the State. In the entire United States, 176 persons were killed by flooding in 2015, and 112 of these fatalities (about 64 percent) involved vehicles. Forty eight of the 176 flood-related fatalities occurred in Texas, including 25 vehicle-related fatalities. Drivers enter flooded roadways for various reasons; one of the most common is that they don't realize how deep the water is and think they can make it through. This is especially true if the water is muddy or if visibility is low, such as during adverse weather conditions or at night time. The Federal Emergency Management Agency (FEMA) has validated the following facts:
In light of these circumstances, high water detection systems (HWDS) are installed in stream beds at road and stream crossing locations with a history or potential for flooding. An HWDS consists of the following generic components:
Project Goals and ObjectivesIn May 1995, a rain event caused widespread flooding in Dallas, Texas, resulting in seven roadway fatalities. Following this incident, the city deployed an automated system to monitor water levels at over 40 stream locations near roads and to warn motorists of high water until maintenance personnel can barricade dangerous roads. The system's main goal is to allow the public, emergency responders, TransGuide Website operators, Texas Department of Transportation (TxDOT) and other agencies, as well as the media to monitor road conditions during adverse weather events using HWDS. The system monitors water levels in stream beds and transmits the data to computers. In of the event of a flood, the computers activate flashers on warning signs along the roadway leading to the stream crossing. The computers also transmit information to traffic management centers and operations centers, and the information appears publicly on the regional website for current road conditions. Conditions are categorized as "flooded," "not flooded," or "no data available." TxDOT staff can access detailed information regarding the status of the system, operational history, and previous water levels. These resources support the decision-making processes of agencies as to whether a roadway is flooded and maintenance crews can be dispatched to barricade flooded roads. Moreover, drivers are able to make informed decisions on whether a planned trip is safe and if they will be able to reach their destination on time. MethodologyCOSTS This analysis utilizes a cost estimate of $75,000 for initial installation of each water level detection system. This estimate is based on a report by TxDOT, and is applied to the TOPS-BC tool cost page.27 Note that mobility costs associated with road closure regularly occur when a water level detection system indicates that such action is necessary. However, these costs are not included in this analysis. Figure 17 shows the cost page in TOPS-BC. It includes the cost estimate of $75,000 for a single water level detection system. This figure was then applied to 40 locations, resulting in total capital costs of $3,000,000. This analysis assumes a life-cycle of 10 years for each system, as well as operations and maintenance costs of 20 percent of the annualized capital costs. The result is an annual cost estimate of $360,000. No incremental equipment is listed on the cost sheet for this analysis. 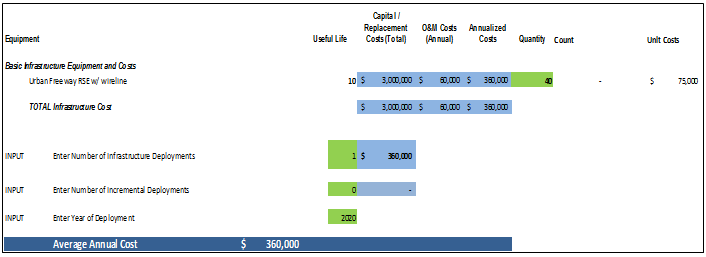 Figure 17. Screenshot. Cost estimation for the Texas high water detection system. BENEFITS For the benefit estimation, this analysis uses data from year 1995 as benchmark, in which 7 fatalities occurred in Dallas due to widespread flooding events. However, this benefit cost analysis takes a conservative approach and assumes that the flooding event of 1995 was an outlier. According to reports by the Dallas Fire Department, no such incident took place in 20 years prior to 1995.28 In addition, this analysis assumes that the effectiveness of water level sensors is not 100 percent; the technology is not capable of preventing the assumed amount of fatalities according to the benchmark. This is why the benefits of this analysis are estimated based on the assumption that four out of seven likely fatalities can be avoided over a 20 year period due to the implementation of the HWDS network. This assumption results in a factor of 0.2. This factor was then applied to the default dollar value of a fatality avoided which is used in TOPS-BC. Figure 18 shows the benefit estimation sheet in TOPS-BC, displaying the monetary values of the safety benefits after the application of the previously mentioned factor. The value of safety benefits resulting from these assumptions is approximately $2.08 million. 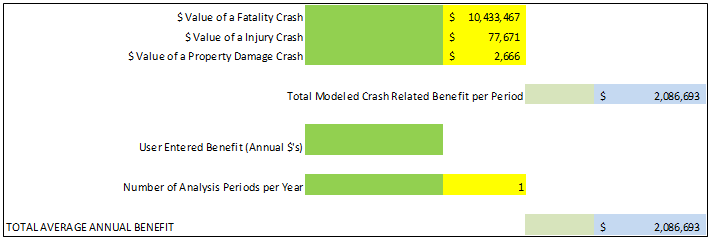 Figure 18. Screenshot. Benefit estimation for the Texas high water detection system. Model Run ResultsThis section summarizes the results of the BCA of the Dallas High Water Detection System. Note that this case study merely analyzes a specific set of costs and benefits for demonstration purposes. A full benefit cost analysis will include a wide range of additional costs and benefits that are not separately listed or analyzed in this case study. TOPS-BC displays the results and summary of benefit and cost estimations on a single sheet called Summary of my Deployments. Figure 19 shows the benefit/cost summary which indicates that the benefits exceed the costs of the system. Note that the analysis did not consider additional safety and other benefits associated with the system. The BCA results in net benefits of about $1.7 million for 10 years and a benefit/cost ratio of 5.8. Benefits and costs, as well as benefit cost ratios, can differ for different sets of assumptions or regions in Texas and the United States. 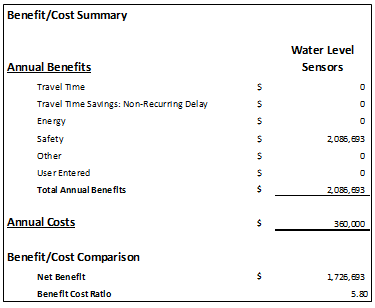 Figure 19. Screenshot. Benefit cost analysis results for the Texas high water detection system. ReferencesUnited States Department of Transportation – FHWA, "Texas DOT High Water Detection System," Best Practices for Road Weather Management, Version 3.0, June 2012. Lawrence, D., Innovations in Flood Warning: What's Happening in Dallas? presented at the 12th Conference and Exposition of the Southwest Association of ALERT Systems, 2000. FHWA, Best Practices for Road Weather Management. "Flooding Rages in Texas; at Least 15 People Killed," available at https://www.questia.com/newspaper/1P2-32936223/flooding-rages-in-texas-at-least-15-people-killed 6 Chapters 2 and 3 of this Compendium contain a discussion of the fundamentals of BCAs and an introduction to BCA modeling tools. These sections also contain additional BCA references. [ Return to note 7. ] 7 Chapters 2 and 3 of this Compendium contain a discussion of the fundamentals of BCAs and an introduction to BCA modeling tools. These sections also contain additional BCA references. [ Return to note 7. ] 8 For more information on the geographical breakout of MDOT regions, visit MDOT's "Superior Region by County" web page, available at: http://michigan.gov/mdot/0,1607,7-151-9615_36946-119651--,00.html (accessed August 17, 2014). [ Return to note 8. ] 9 Chapters 2 and 3 of this Compendium contain a discussion of the fundamentals of BCAs and an introduction to BCA modeling tools. These sections also contain additional BCA references. [ Return to note 9. ] 10 An Artificial Neural Network (ANN) is an information processing paradigm that is inspired by the way biological nervous systems, such as the brain, process information. The key element of this paradigm is the novel structure of the information processing system, which is composed of a large number of highly interconnected processing elements working in unison to identify and solve specific problems. As a result, ANNs are able to learn by example. [ Return to note 10. ] 11 Chapters 2 and 3 of this Compendium contain a discussion of the fundamentals of BCAs and an introduction to BCA modeling tools. These sections also contain additional BCA references. [ Return to note 11. ] 12 FHWA, "Evaluating Scour at Bridges, Third Edition," Hydraulic Engineering Circular No. 18, FHWA NHI 01-001 (Washington, DC: 1995). Available at: https://www.fhwa.dot.gov/engineering/hydraulics/pubs/hif12003.pdf [ Return to note 12. ] 13 B.E. Hunt, NCHRP Synthesis 396: Monitoring Scour Critical Bridges (Washington, DC: Transportation Research Board of the National Academies: 2009). Available at http://onlinepubs.trb.org/onlinepubs/nchrp/nchrp_syn_396.pdf [ Return to note 13. ] 14 S. Stein, Risk-Based Management Guidelines for Scour at Bridges with Unknown Foundations. Phase II Final Report. NCHRP 24-25 (Web-only document 107), Transportation Research Board, 2006. [ Return to note 14. ] 15 TxDOT, Remote Bridge Scour Monitoring: A Prioritization and Implementation Guideline, TX-00/0-3970-1, (Texas DOT: 1999), p. 68. Available at https://ctr.utexas.edu/wp-content/uploads/pubs/3970_1.pdf [ Return to note 15. ] 16 Wesley Cook, "Bridge Failure Rates, Consequences, and Predictive Trends," graduate dissertation, Utah State University, Paper 2163 (2014). Available at http://digitalcommons.usu.edu/cgi/viewcontent.cgi?article=3187&context=etd [ Return to note 16. ] 17 Ibid. [ Return to note 17. ] 18 TxDOT, Remote Bridge Scour Monitoring: A Prioritization and Implementation Guideline, TX-00/0-3970-1, (Texas DOT: 1999), p. 16. [ Return to note 18. ] 19 Washington State Department of Transportation, "Scour Repairs: Bridge Scour Mitigation Program" web page. Available at https://www.wsdot.wa.gov/Bridge/Reporting/ScourRepairs.htm. [ Return to note 19. ] 20 TxDOT, Remote Bridge Scour Monitoring: A Prioritization and Implementation Guideline, TX-00/0-3970-1, (Texas DOT: 1999). [ Return to note 20. ] 21 Ibid., p. 63. [ Return to note 21. ] 22 Ibid. [ Return to note 22. ] 23 Chapters 2 and 3 of this Compendium contain a discussion of the fundamentals of BCAs and an introduction to BCA modeling tools. These sections also contain additional BCA references. [ Return to note 23. ] 24 FHWA, Tool for Operations Benefit Cost Analysis, https://ops.fhwa.dot.gov/plan4ops/topsbctool/index.htm. [ Return to note 24. ] 25 Robert Koeberlein, Dennis Jensen, Miranda Forcier (ITD), Relationship of Winter Road Weather Monitoring to Winter Driving Crash Statistics (2014), http://docs.trb.org/prp/15-0242.pdf [ Return to note 25. ] 26 Chapters 2 and 3 of this Compendium contain a discussion of the fundamentals of BCAs and an introduction to BCA modeling tools. These sections also contain additional BCA references. [ Return to note 26. ] 27 FHWA, Best Practices for Road Weather Management, FHWA-HOP-12-046, Washington, DC: 2012, p.73. [ Return to note 27. ] 28 "Flooding Rages in Texas; at Least 15 People Killed," St. Louis Post-Dispatch, May 7, 1995. Available at https://www.questia.com/newspaper/1P2-32936223/flooding-rages-in-texas-at-least-15-people-killed [ Return to note 28. ] | |||||||||||||||||||||||||||||||||||||||||||||||||||||||||||||||||||||||||||||||||||||||||||||||||||||||||||||||||||||||||||||||||||||||||||||||||||||||||||||||||||||||||
|
United States Department of Transportation - Federal Highway Administration |
||