Freight Facts and Figures 2013
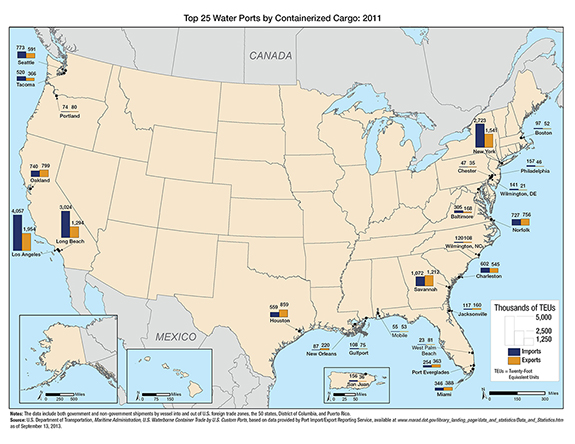
Figure 3-4. Top 25 Water Ports by Containerized Cargo: 2011
Containerized cargo has grown rapidly in recent years and is concentrated at a few large water ports. The Ports of Los Angeles and Long Beach together handle about 37 percent of all container traffic at water ports in the United States. Container trade at these two ports increased by nearly 61 percent between 2000 and 2011, roughly equal to that reported for container cargo overall.
Figure 3-4
Data represented in the figure.
Thousands of TEUs
| Ports | Rank | Export | Import |
|---|---|---|---|
| Los Angeles, CA | 1 | 1,954 | 4,057 |
| Long Beach, CA | 2 | 1,294 | 3,024 |
| New York, NY | 3 | 1,541 | 2,723 |
| Savannah, GA | 4 | 1,212 | 1,072 |
| Oakland, CA | 5 | 799 | 740 |
| Norfolk, VA | 6 | 756 | 727 |
| Houston, TX | 7 | 859 | 559 |
| Seattle, WA | 8 | 591 | 773 |
| Charleston, SC | 9 | 545 | 602 |
| Tacoma, WA | 10 | 366 | 520 |
| Miami, FL | 11 | 388 | 346 |
| Port Everglades, FL | 12 | 363 | 254 |
| Baltimore, MD | 13 | 168 | 305 |
| New Orleans, LA | 14 | 220 | 87 |
| Jacksonville, FL | 15 | 160 | 117 |
| Wilmington, NC | 16 | 108 | 120 |
| Philadelphia, PA | 17 | 46 | 157 |
| San Juan, PR | 18 | 36 | 156 |
| Gulfport, MS | 19 | 75 | 108 |
| Wilmington, DE | 20 | 21 | 141 |
| Portland, OR | 21 | 80 | 74 |
| Boston, MA | 22 | 52 | 97 |
| Mobile, AL | 23 | 53 | 55 |
| West Palm Beach, FL | 24 | 81 | 23 |
| Chester, PA | 25 | 35 | 47 |
Key: TEUs = twenty-foot equivalent units.
Note:
The statistics include both government and non-government shipments by vessel into and out of U.S. foreign trade zones, the 50 states, District of Columbia, and Puerto Rico.
Source:
U.S. Department of Transportation, Maritime Administration, U.S. Waterborne Container Trade by U.S. Custom Ports, based on data provided by Port Import/Export Reporting Service, available at www.marad.dot.gov/library_landing_page/data_and_statistics/Data_and_Statistics.htm as of September 13, 2013.
You may need the Microsoft Excel Viewer to view Excel files on this page.
You may need the Adobe® Reader® to view the PDFs on this page.