| Skip
to content |
|
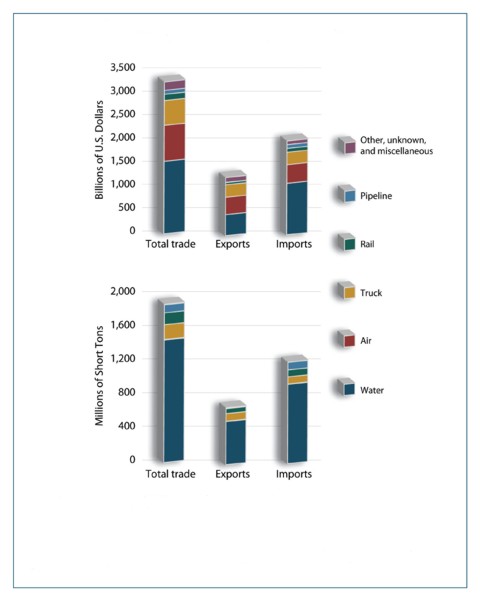
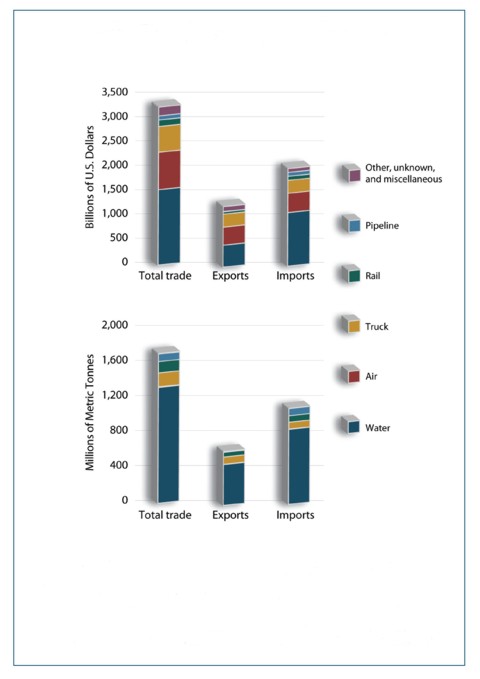
Freight Facts and Figures 2009Figures 2-2 and 2-2M. U.S. International Merchandise Trade by Transportation Mode: 2008Nearly 80 percent of freight tonnage in U.S. foreign trade moves by water, but air and truck transportation are nearly as important when freight value is considered. By value, the water share drops to 48 percent, with air and truck accounting for 24 percent and 16 percent respectively. Rail and pipeline account for the balance.
Figure 2-2 (standard units)
[PDF 53KB]
Data represented in the figure.
Notes: 1 short ton = 2,000 pounds. The U.S. Department of Transportation (USDOT), Research and Innovative Technology Administration, Bureau of Transportation Statistics estimated 2008 weight data for truck, rail, and pipeline modes using value-to-weight ratios derived from imported commodities. Totals for the most recent year differ slightly from the USDOT, Federal Highway Administration, Office of Freight Management and Operations, Freight Analysis Framework (FAF) due to variations in coverage and FAF conversion of values to constant dollars. Numbers may not add to totals due to rounding. Sources: Total, water and air data: U.S. Department of Commerce, U.S. Census Bureau, Foreign Trade Division, U.S. Imports of Merchandise and U.S. Exports of Merchandise DVD's, December 2008. Truck, rail, and pipeline data: U.S. Department of Transportation, Research and Innovative Technology Administration, Bureau of Transporation Statistics, Transborder Freight Data, available at www.bts.gov/transborder as of August 20, 2009. Other, unknown and miscellaneous data: Special tabulation, August 2009.
Figure 2-2M (metric units)
[PDF 51KB]
Data represented in the figure.
Notes: Notes: 1 metric tonne = 1.1023 short tons. The U.S. Department of Transportation (USDOT), Research and Innovative Technology Administration, Bureau of Transportation Statistics estimated 2008 weight data for truck, rail, and pipeline modes using value-to-weight ratios derived from imported commodities. Totals for the most recent year differ slightly from the USDOT, Federal Highway Administration, Office of Freight Management and Operations, Freight Analysis Framework (FAF) due to variations in coverage and FAF conversion of values to constant dollars. Numbers may not add to totals due to rounding. Sources: Total, water and air data: U.S. Department of Commerce, U.S. Census Bureau, Foreign Trade Division, U.S. Imports of Merchandise and U.S. Exports of Merchandise DVD's, December 2008. Truck, rail, and pipeline data: U.S. Department of Transportation, Research and Innovative Technology Administration, Bureau of Transporation Statistics, TransBorder Freight Data, available at www.bts.gov/transborder as of August 20, 2009. Other, unknown and miscellaneous data: Special tabulation, August 2009.
To view Excel files, you can use the Microsoft Excel Viewer.
| |||||||||||||||||||||||||||||||||||||||||||||||||||||||||||||||||||||||||||||||||||||||||||||||||||||||||||||||||||||||||||||||||
|
United States Department of Transportation - Federal Highway Administration |
Last modified: September 24, 2019 | |