Freight Facts and Figures 2009
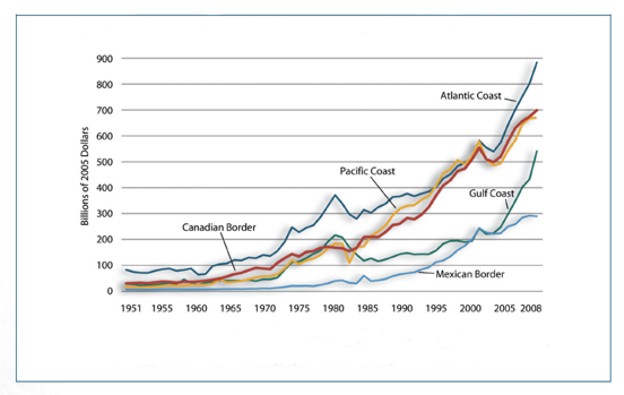
Figure 2-1. Value of Merchandise Trade by Coasts and Borders: 1951-2008
Foreign trade has had a major impact on all U.S. borders and coasts. Since 1951, the value of merchandise trade has grown by nineteen-fold in inflation-adjusted terms. However, overall growth has been affected by short-term downturns, such as between 1981 and 1985. In 2008, ports and airports on the Atlantic Coast remain the most important, but the land borders and other coasts are catching up. While the recent economic downturn started in 2007, the value of trade continued to grow in part due to short-term increases in the price of imported oil.
[PDF 49KB]
Data represented in the figure.
Table in Excel format
Billions of 2005 dollars
| Customs District |
1951 |
1952 |
1953 |
1954 |
1955 |
1956 |
1957 |
1958 |
1959 |
1960 |
1961 |
1962 |
1963 |
1964 |
1965 |
1966 |
1967 |
1968 |
1969 |
1970 |
1971 |
1972 |
1973 |
1974 |
1975 |
1976 |
1977 |
1978 |
1979 |
1980 |
1981 |
1982 |
1983 |
1984 |
1985 |
1986 |
1987 |
1988 |
1989 |
1990 |
1991 |
1992 |
1993 |
1994 |
1995 |
1996 |
1997 |
1998 |
1999 |
2000 |
2001 |
2002 |
2003 |
2004 |
2005 |
2006 |
2007 |
2008 |
| Atlantic Coast |
80.4 |
72.5 |
69.1 |
68.4 |
76.5 |
82.7 |
85.5 |
76.4 |
80.1 |
85.2 |
61.8 |
63.9 |
95.0 |
102.4 |
105.2 |
118.7 |
116.8 |
128.1 |
125.4 |
137.8 |
134.0 |
153.2 |
188.5 |
244.9 |
225.8 |
242.9 |
252.7 |
284.9 |
326.5 |
369.6 |
336.8 |
294.9 |
277.4 |
312.4 |
301.1 |
322.9 |
335.5 |
362.0 |
364.4 |
374.9 |
364.8 |
375.0 |
383.0 |
399.0 |
433.7 |
449.2 |
481.3 |
495.0 |
514.9 |
580.4 |
552.9 |
537.9 |
574.0 |
641.3 |
700.4 |
751.4 |
801.8 |
882.9 |
| Gulf Coast |
25.6 |
23.8 |
19.8 |
21.0 |
21.3 |
26.3 |
30.0 |
25.7 |
43.1 |
30.3 |
22.3 |
29.9 |
32.8 |
39.3 |
38.5 |
38.9 |
38.4 |
40.8 |
37.0 |
44.0 |
43.9 |
50.3 |
81.1 |
109.9 |
112.6 |
125.7 |
142.3 |
155.4 |
188.8 |
214.5 |
206.0 |
167.3 |
139.2 |
115.3 |
124.9 |
113.1 |
120.6 |
130.6 |
141.3 |
145.8 |
140.0 |
141.2 |
140.9 |
154.7 |
181.0 |
192.1 |
193.1 |
187.3 |
191.5 |
240.5 |
218.2 |
222.3 |
245.6 |
295.2 |
345.9 |
400.5 |
431.1 |
539.9 |
| Mexican Border |
4.2 |
4.2 |
3.9 |
3.6 |
3.9 |
4.5 |
4.9 |
4.8 |
4.1 |
4.2 |
4.4 |
4.3 |
4.8 |
5.6 |
5.9 |
6.4 |
6.3 |
7.1 |
7.3 |
8.6 |
8.2 |
10.9 |
13.9 |
17.9 |
17.9 |
18.6 |
17.2 |
21.8 |
27.9 |
37.5 |
39.6 |
30.0 |
28.0 |
57.9 |
37.0 |
39.6 |
45.1 |
56.0 |
63.1 |
67.3 |
70.6 |
81.9 |
89.7 |
110.1 |
116.1 |
132.1 |
156.6 |
173.4 |
197.4 |
241.6 |
224.6 |
219.7 |
222.0 |
248.1 |
256.4 |
282.7 |
289.9 |
287.1 |
| Pacific Coast |
13.8 |
13.6 |
12.7 |
13.6 |
15.0 |
17.9 |
19.7 |
18.5 |
18.8 |
23.0 |
21.9 |
22.9 |
26.9 |
43.7 |
31.3 |
34.2 |
37.1 |
43.4 |
50.9 |
55.5 |
55.2 |
63.1 |
86.1 |
116.7 |
103.1 |
116.9 |
124.2 |
138.9 |
161.8 |
182.0 |
180.6 |
106.8 |
168.4 |
171.2 |
211.3 |
228.6 |
251.4 |
290.8 |
316.9 |
328.1 |
330.5 |
351.7 |
366.3 |
404.3 |
453.5 |
468.9 |
504.3 |
489.8 |
519.1 |
578.7 |
506.6 |
484.1 |
492.7 |
542.4 |
581.4 |
643.5 |
666.1 |
669.1 |
| Canadian Border |
27.7 |
28.7 |
30.2 |
28.1 |
31.3 |
35.5 |
34.5 |
30.5 |
35.0 |
34.1 |
35.6 |
38.5 |
41.7 |
46.8 |
54.2 |
63.8 |
68.5 |
79.2 |
87.7 |
85.5 |
83.0 |
107.8 |
125.6 |
141.5 |
132.3 |
149.3 |
153.4 |
165.6 |
169.8 |
166.1 |
163.7 |
152.1 |
165.6 |
206.6 |
207.7 |
206.9 |
226.1 |
253.2 |
258.8 |
280.5 |
275.7 |
293.7 |
322.3 |
367.1 |
406.4 |
426.8 |
462.2 |
471.5 |
507.8 |
553.2 |
508.1 |
497.0 |
519.2 |
577.2 |
628.7 |
655.6 |
673.4 |
697.7 |
| Total |
151.7 |
142.9 |
135.6 |
134.7 |
148.1 |
166.9 |
174.5 |
155.9 |
181.0 |
176.9 |
146.0 |
159.6 |
201.2 |
237.8 |
235.2 |
262.0 |
267.1 |
298.5 |
308.2 |
331.5 |
324.3 |
385.2 |
495.2 |
631.0 |
591.7 |
653.4 |
689.8 |
766.6 |
874.8 |
969.6 |
926.8 |
751.1 |
778.6 |
863.4 |
882.0 |
911.1 |
978.6 |
1092.6 |
1144.5 |
1196.7 |
1181.6 |
1243.7 |
1302.1 |
1435.2 |
1590.8 |
1669.1 |
1797.5 |
1817.1 |
1930.8 |
2194.4 |
2010.4 |
1961.0 |
2053.5 |
2304.3 |
2512.7 |
2733.7 |
2862.3 |
3076.7 |
Notes: The value of 2008 coal exports ($5.03) from Mobile, AL, Charleston, SC, and Norfolk, VA are considered proprietary information and are consolidated. In this figure, the total value of coal exports for the above three cities are included under the Atlantic Coast Customs District.
Sources:
1951-1970: U.S. Department of Commerce, Census Bureau, Historical Statistics of the United States, Colonial Times to 1970, Bicentennial Edition (Washington, DC: 1975).
1970-2000: U.S. Department of Commerce, Census Bureau, Statistical Abstract of the United States (Washington, DC: annual issues).
2000-2008: U.S. Department of Commerce, Census Bureau, Foreign Trade Division, FT920 - U.S. Merchandise Trade: Selected Highlights (Washington, DC: annual issues).
Implicit GDP Deflator: U.S. Department of Commerce, Bureau of Economic Analysis, Current-Dollar and “Real” Gross Domestic Product, available at www.bea.gov as of August 15, 2009.
To view Excel files, you can use the Microsoft
Excel Viewer.
 You will need the Adobe
Acrobat Reader to view the PDFs on this page.
You will need the Adobe
Acrobat Reader to view the PDFs on this page.
previous |
table of contents |
next