Demands on the Transportation System
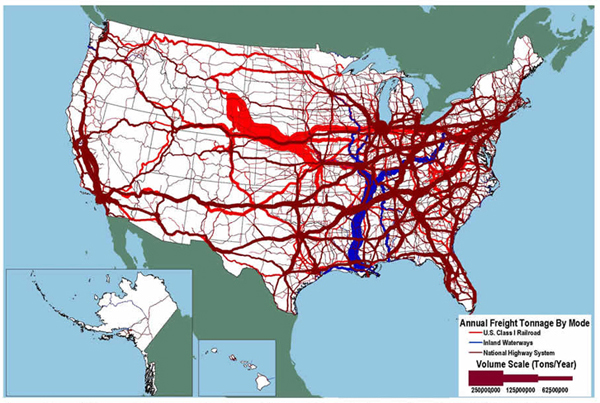
Freight moves throughout the United States on 985,000 miles of Federal-aid highways, 141,000 miles of railroads, 11,000 miles of inland waterways, and 1.6 million miles of pipelines (USDOT FHWA 2007a and USDOT FHWA 2007b). Figure 3 shows where flows are concentrated on highway, rail, and inland waterway networks.
Figure 3. Tonnage on Highways, Railroads, and Inland Waterways: 2002
Most of the nation's freight transportation network was developed before 1960 to provide national connectivity, move goods from farm to market and from fort to port, and serve industrial and population centers concentrated in the Northeast and the Midwest. The growth of population and manufacturing in the South and along the West Coast, the restructuring of the economy from heavy industries to services, and the explosion of international trade are placing new demands on the freight system. Accordingly, ports, airports, and border crossings handle huge volumes of traffic. Railroads and steamship companies accommodate an enormous number of containers that would have been a technological novelty five decades ago. Trucks serve new inland distribution centers beyond the urban fringe, and air carriers deliver parcels anywhere in the country overnight. The freight system must serve an economy that is increasingly decentralized and organized around just-in-time delivery.
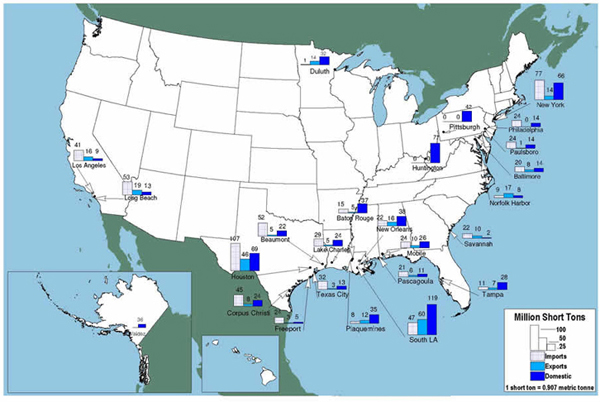
Pressures from existing and anticipated volumes of freight on the transportation system vary by the type of freight moved. The transportation of high-value, time-sensitive goods requires different routes, facilities, and services than does the movement of low-value bulk commodities (Table 2). Transportation facilities and services that handle bulk products tend to be specialized and seldom overlap with facilities and services for high-value, time-sensitive products. As shown in Figure 4, maritime facilities that serve bulk shipments are concentrated at Gulf Coast and Middle Atlantic ports while facilities that handle high-value, time-sensitive shipments are located at ports and airports in major cities and at several border crossings (Figure 5). The few ports that handle both high-value, containerized goods and bulk products use separate docks because different handling equipment is required.
| High Value Time Sensitive | Bulk | |
|---|---|---|
| Top 5 Commodity Classes | Machinery Electronics Mixed freight Motorized vehicles Textiles and leather |
Natural Gas Gravel Cereal grains Crude petroleum Coal |
| Share of Total Tons | 30% | 70% |
| Share of Total Value | 85% | 15% |
| Key Performance Variables | Reliability Speed Flexibility |
Reliability Cost |
| Share of Tons by Domestic Mode | 88% Truck 7% Rail 5% All Other |
51% Truck 12% Rail 32% Pipeline 5% Water <1% Air and Intermodal |
| Share of Value by Domestic Mode | 83% Truck 10% Intermodal 3% Rail 4% All Other |
36% Truck 5% Rail 53% Pipeline 4% Water 2% Air and Intermodal |
Figure 4. Top Water Ports by Tonnage: 2006
Figure 5. Top 25 Foreign-Trade Gateways by Value: 2006
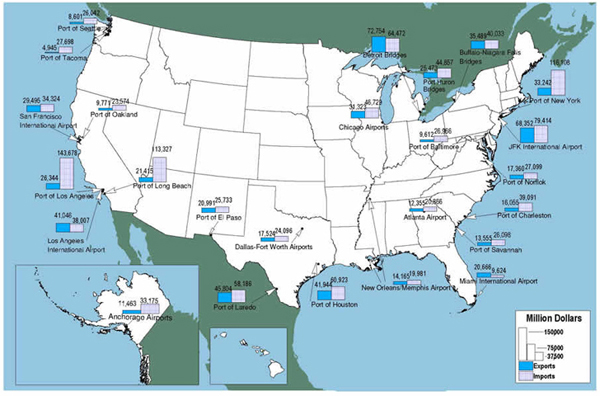
Source: U.S. Department of Transportation, Research and Innovative Technology Administration, Bureau of Transportation Statistics, National Transportation Statistics 2007 (Washington, DC: 2007).
During most of the twentieth century, the growth in bulk shipments stressed the transportation system. Examples include railcar shortages during grain harvests and port capacity limitations during the coal export boom. While many past stresses were relieved by the deregulation of transportation carriers and changes in the economy, continued growth of bulk movement and new economic conditions may be creating new stresses.
The twenty-first century economy emphasizes high-value, time-sensitive goods in the mix. The value of goods moved is forecast to grow in constant dollars by over 190 percent between 2002 and 2035, which is nearly twice the growth rate forecast for tonnage. As the value of goods transported grows, the cost of holding inventory in warehouses or in transit also increases. Many industries have shifted to just-in-time delivery systems to minimize inventory costs and maximize responsiveness to rapidly changing markets, and just-in-time systems depend on fast and reliable transportation. According to one estimate, companies judged to be best in class for supply chain management have 40 percent higher profitability and 25 percent higher sales growth than those considered median class (Hermans 2006).
Just-in-time delivery systems contribute to an increase in transportation activity per ton mile and thus capacity requirements per ton. For many products, just-intime logistical systems require more vehicles hauling smaller payloads to meet market demands. Consider pizza delivery: the marketplace will not wait for the accumulation of enough orders to fill a large vehicle before pizzas are dispatched to consumers (Pisarski 2001). This shift to more vehicles carrying less per vehicle has contributed to the 71 percent growth in the number of trucks used in for-hire transportation and the 115 percent increase in their vehicle miles of travel over the last 20 years of the twentieth century (USDOC Census Bureau 1995 and 2004b).
Anticipated growth in demand for high-value, time-sensitive goods is driving the forecast growth of trucking, both for truck-only service and for truck portions of intermodal service. As a consequence, trucks are becoming a significant portion of traffic on an increasing number of highways.
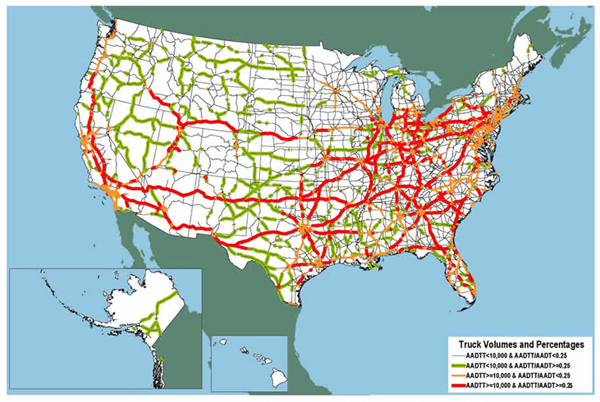
Additionally, typical freight-hauling vehicles are more than twice as long as passenger vehicles. They take up even more space when differences in operating characteristics and motorists' reactions to trucks are taken into account. Because of these factors, trucks have become a dominant part of the traffic stream when they are every fourth vehicle on the road. Trucks accounted for at least 25 percent of average daily traffic on almost 31,000 miles of the National Highway System (NHS) in 2002 and are expected to account for that share of traffic on 37,000 miles in 2035 (Figures 6 and 7, see pages 10-11).
Figure 6. Major Truck Routes on the National Highway System: 2002
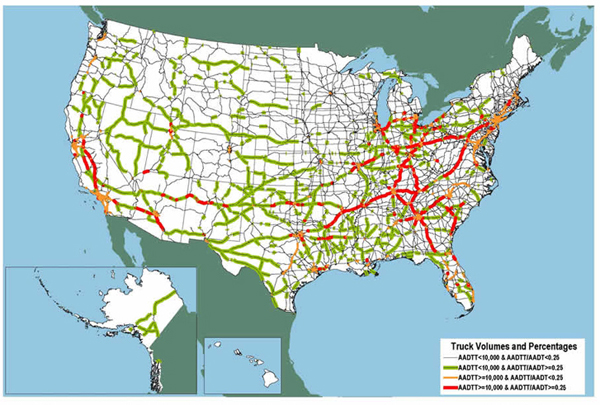
Source: U.S. Department of Transportation, Federal Highway Administration, Office of Freight Management and Operations, Freight Analysis Framework, version 2.2, 2007.
Figure 7. Major Truck Routes on the National Highway System: 2035
Source: U.S. Department of Transportation, Federal Highway Administration, Office of Freight Management and Operations, Freight Analysis Framework, version 2.2, 2007.
Most freight moving by truck uses the Interstate System. Although all vehicle miles of travel are divided about equally among Interstate highways, the balance of the NHS, and other public roads, the Interstate System carries one-half of truck travel and three-fourths of travel by freight-hauling trucks serving places at least 50 miles apart (Table 3).
| Interstate Highway (Percent) | Balance of National Highway System (Percent) | Other Highways (Percent) | |
|---|---|---|---|
| All vehicles | 35 | 30 | 35 |
| All trucks | 49 | 26 | 25 |
| Freight-hauling trucks serving places at least 50 miles apart | 75 | 20 | 6 |
Source: U.S. Department of Transportation, Federal Highway Administration, Office of Freight Management and Operations, Freight Analysis Framework, version 2.2, 2007.
![]() You will need the Adobe Acrobat Reader to view the PDFs on this page.
You will need the Adobe Acrobat Reader to view the PDFs on this page.
To view Excel files, you can use the Microsoft Excel Viewer.