Work Zone Fatalities: A National Snapshot
slide 1: Work Zone Fatalities: A National Snapshot
Tracy Scriba
Federal Highway Administration
May 2012
[PDF version, 476 KB]
PDF files can be viewed with the Acrobat® Reader®.
slide notes:
None
slide 2: Work Zone Fatalities Nationwide
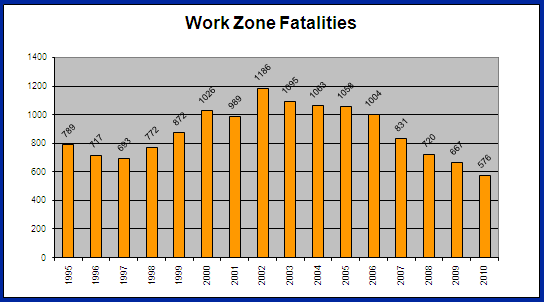
- In 2010, there were 576 fatalities in U.S. work zones
- 13.6% decrease from 2009
- Continues a 10-year downward trend
- Lowest number in 30 years
slide notes:
We know that work zones can be hazardous places. Lives are lost in our work zones every year. In 2010, the most recent year for which we have data, there were 576 fatalities in work zones.
According to data from the Fatality Analysis Reporting System, or FARS, that was a decrease of 13.6 percent from 2009, when there were 667 work zone fatalities.
This continues the trend of decreasing work zone fatalities that has been occurring since fatalities peaked at 1,186 in 2002.
This is the lowest in 30 years since 489 work zone fatalities in 1982.
That is all very good news. However, it is still 576 lives lost. We need to continue to work to reduce that loss of life.
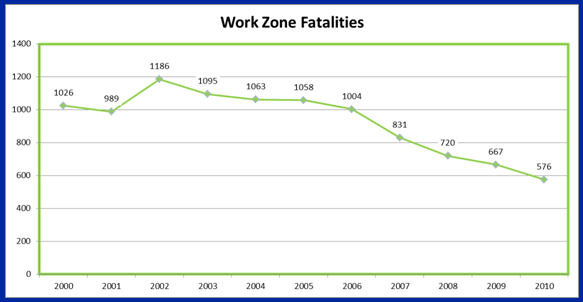
slide 3: Number of work zone fatalities has been decreasing since 2002
slide notes:
None
slide 4: Work Zone Fatalities
slide notes:
The number of WZ fatalities has been steadily decreasing in the United States since 2002.
Work zone fatalities have decreased every year since 2002. In 2008, 720 fatalities resulted from motor vehicle crashes in work zones (preliminary data). This is a 39 percent decrease since 2002 when 1186 work zone fatalities occurred, and a one year decrease of 14 percent from 2007 (831 fatalities).
slide 5: Work Zone Fatality Snapshot
- Work zone fatalities have decreased...
- At a greater rate than overall fatalities
- During a time when VMT has increased
- During a time when more work is being done under traffic
slide notes:
There are several pieces of data that point to improved safety in our work zones. I'm going to run quickly through a number of those pieces of data on the next several slides.
In summary:
Work zone fatalities have decreased at a greater rate than overall fatalities and VMT, during a time in which a growing percentage of our work zones are for rehabilitation and expansion of roadways carrying traffic.
With greater VMT overall and more work zone done next to traffic, there has likely been more exposure to work zones.
With comparable safety we might expect this situation could lead to more work zone fatalities, yet we have seen work zone fatalities decrease.
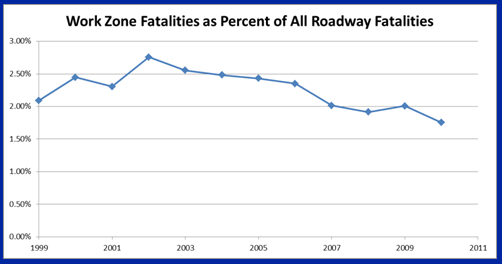
slide 6: Compared to Overall Highway Fatalities
- Work zone fatalities have been decreasing faster than overall highway fatalities
slide notes:
Work zone fatalities have been decreasing faster than overall highway fatalities.
While highway fatalities are declining overall, the rate of decline in work zone fatalities has been much higher. Overall highway fatalities declined 23% from 2002 to 2010, while work zone fatalities declined 51% during the same eight-year period. Work zone fatalities decreased to about 1.75% of all roadway fatalities in 2010.
slide 7: Compared to Overall VMT
- Work zone fatalities have decreased while VMT on our roads has increased
- Between 2002 and 2009:
- Total annual VMT increased 5%
- WZ fatalities decreased 44%
slide notes:
WZ fatalities have decreased while VMT on our roads has increased.
Between 2002 and 2009, total annual VMT grew from 2,829.3 billion to 2,974 billion, an increase of 5%. Travel on our roads overall increased overall during this period, so VMT through work zones likely showed a fairly similar pattern. Even with this increased traffic, work zone fatalities decreased by 44% during the same period.
slide 8: Compared to Amount of Roadwork
- Work zone fatalities have decreased while the amount of roadwork has increased
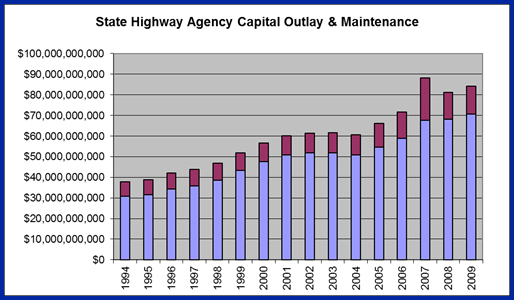
slide notes:
Work zone fatalities have decreased while the amount of roadwork overall, and the amount of road work on existing roads with traffic, have increased.
The amount spent on roadwork is a surrogate measure for the amount of work activity and work zones out on our roads.
slide 9: Work Zone Safety Snapshot
- Fatality data – good place to start, but not the whole picture
- More data available on our website: http://www.ops.fhwa.dot.gov/wz/resources/facts_stats.htm
slide notes:
Fatality data is one measure of safety in our work zones, but it's just a starting point to understanding what is going on in work zones. We need to look at other data, such as crashes and injuries and worker fatalities.
slide 10: Work Zone Safety Snapshot
- Work zones can be dangerous places
- We are seeing significant improvements in work zone safety
- Some likely contributing factors
- Earlier, more comprehensive planning for work zones
- Greater emphasis on WZ management strategies
- Growing use of data to identify and understand the issues
- Need to continue our efforts
slide notes:
We know that work zones can be hazardous places. Through the efforts of many in the transportation industry, we are seeing some significant improvements.
Comment on contributing factors:
Note greater attention on work zones as result of WZ Safety and Mobility Rule
Need to continue our efforts – 576 fatalities is 576 lives lost!
slide 11: Work Zone Fatality Reduction – Efforts in 3 States
- California – Joe Jeffrey
- Florida – Stephanie Maxwell
- North Carolina – Steve Kite
slide notes:
We are now going to hear about some of the efforts being made in three States to make work zones safer. These are States that have seen significant reductions in work zone fatalities for several years, so they have some valuable practices to share with us.