Oregon's Work Zone Traffic Analysis Program (Presentation)
Printable Version [PPT 7.3 MB]
You will need the Microsoft PowerPoint Viewer to view this PowerPoint (PPT) file.
Contact Information: WorkZoneFeedback@dot.gov
Slide 1. Oregon's Work Zone Traffic Analysis Program
Oregon Department of Transportation
90 Years Connecting Communities and Business
FHWA Work Zone Rule Virtual Workshop
November 6, 2008
Irene Toews, P.E.
Oregon Department of Transportation
Jeremy Jackson, E.I.T.
Oregon Bridge Delivery Partners


Slide 2. Oregon's Work Zone Traffic Analysis
- Why do we do it?
- What do we do?
- How do we do it?
Slide 3. Why do we do it?
- Work Zone Traffic Analysis Tool
- Timeline
- May 2004 – Oregon Bridge Delivery Program Starts
- Summer 2005 – WZTA is created in spreadsheet form
- Summer 2006 – WZTA is expanded for statewide use
- Fall 2006 – ODOT WZTA Manual is revised
- October 2008 – WZTA online tool goes live
Slide 4. What do we do?
- Determine safe times for lane closures
- Times when volumes are low enough that travel behavior is not significantly affected.
- Determine Mobility Impacts – Delay Estimates
- Work Zone
- Segment
- Corridor
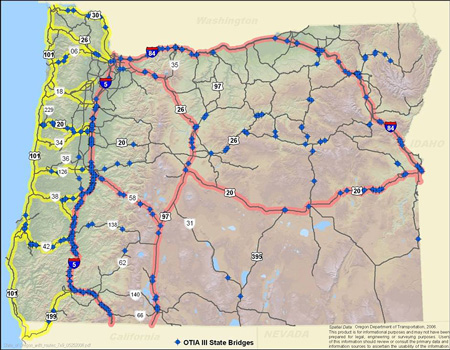
Slide 5. WZTA Background
- OTIA III Bridge Locations
- Statewide Mobility Corridors Defined
Slide 6. Mobility Management and Delay Thresholds
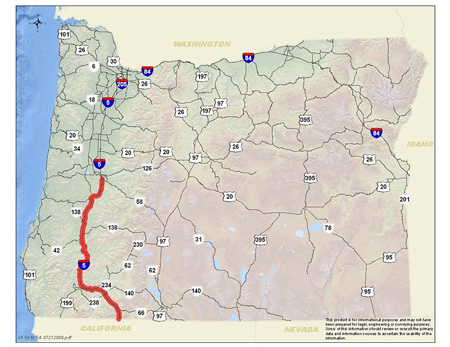
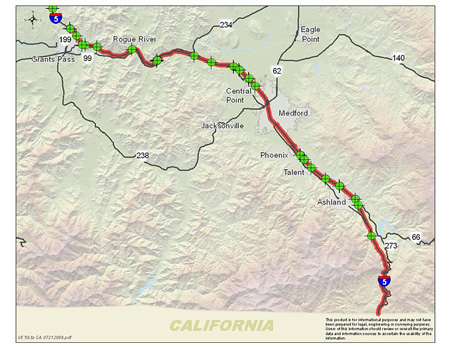
- I-5 South Corridor (Eugene to CA State Line)
Slide 7. Mobility Management and Delay Thresholds
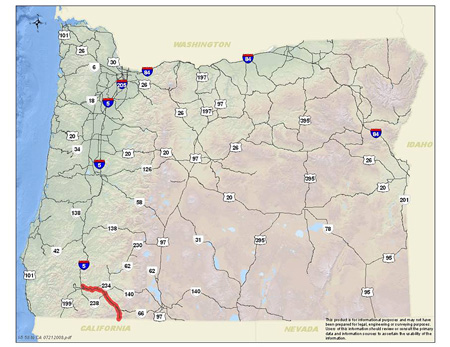
- Segment 4-C (US 199 to CA State Line)
Slide 8. Mobility Management and Delay Thresholds
- Length: 55 miles
- Delay Threshold: 7 minutes
Slide 9. Mobility Management and Delay Thresholds
- Corridors broken into segments
- Delay thresholds assigned to segments
- Delay thresholds to be enforced 24/7/365
- Detailed delay estimates are needed to help manage mobility
- Individual delays must be aggregated
Slide 10. How do we do it?
- Work Zone Traffic Analysis Tool
- Requires only an internet connection and browser
- Up-to-date data
- Analysis results stored on server
- 5–15 minutes per analysis
- Output
- Lane closure charts
- Delay estimates
- Other…
Slide 11. How Does It Work?
- Gather data
- Adjust data
- Heavy vehicles
- Seasonal variations
- Weekday/weekend
- Growth rates
- Identify free flow threshold
- Compare
Slide 12. Where Does the Data Come From?
- ODOT Manual Count Database
- ODOT Integrated Transportation Information System (ITIS)
- ODOT Highway Inventory
- Average Daily Traffic
- Growth rates
- Truck percentages
- ODOT Traffic Database
- Daily/Seasonal Trends & Automatic Traffic Recorder Data
- GIS
- UGB/MPO
- Region Boundaries
Slide 13. What's a Free Flow Threshold?
- The maximum sustainable volume that yields average travel speeds at or near free flow conditions
- FFT depends on a number of factors
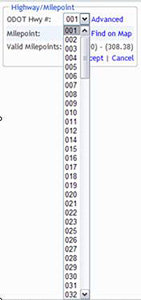
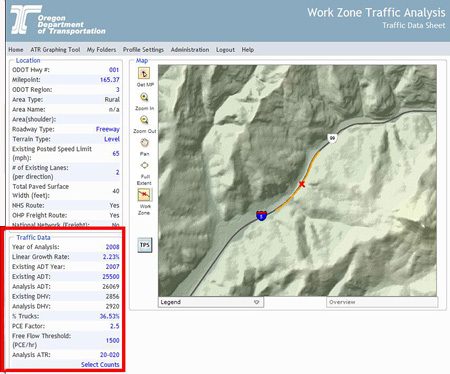
Slide 14. Using the WZTA Tool
Choose your location – Method 1
- Select Highway # and MP
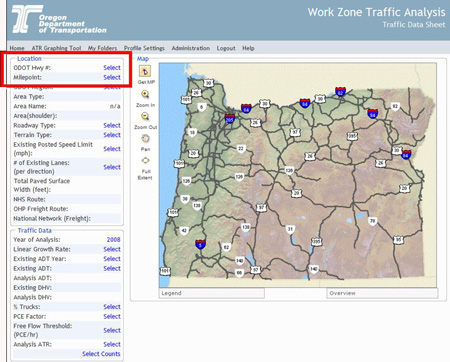
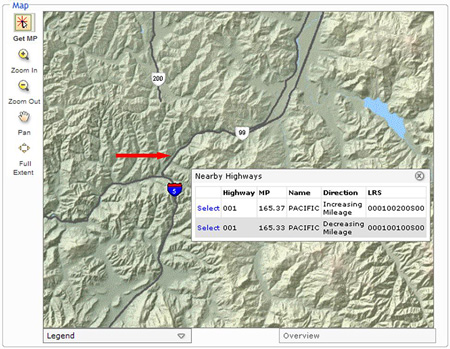
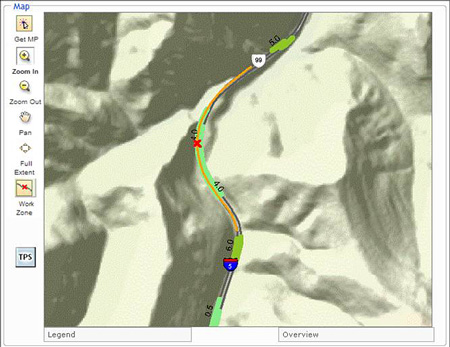
Slide 15. Choose Your Location – Method 2
Use GIS map to select location
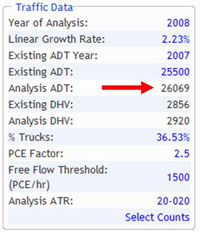
Slide 16. Year of Analysis
- Inputting the year of analysis yields projected traffic data
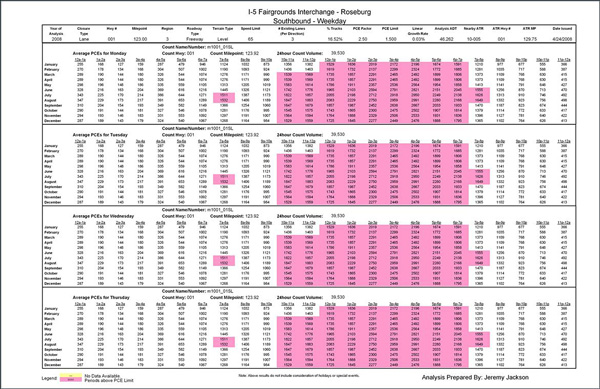
Slide 17. Output – Lane Closure Chart
Lane closure chart – Weekday
Slide 18. Closure Chart Uses
- Used primarily in the planning and design phases
- Planning: May influence final design
- Design: Project specifications
- Construction: Short notice issues
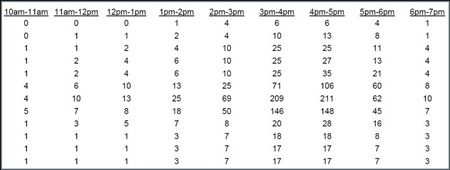
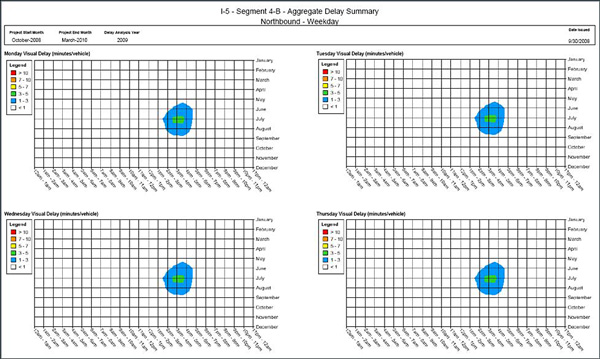
Slide 19. Output – Delay Estimates
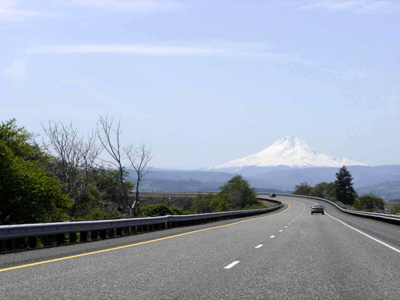
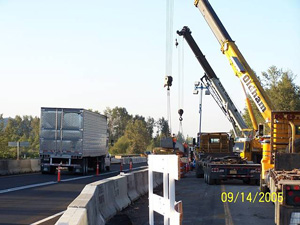
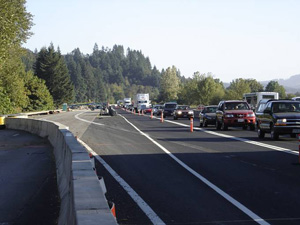
Slide 20. An Example of Work Zone Context
- Horizontal geometry = 4 degree curve
- Vertical geometry = 4–6% grade
Slide 21. Traffic Planning Sheet (TPS)
Outputs include:
- Roadway profile
- Straightline diagrams
- Horizontal curve table
- Vertical grade table
- Vertical type table
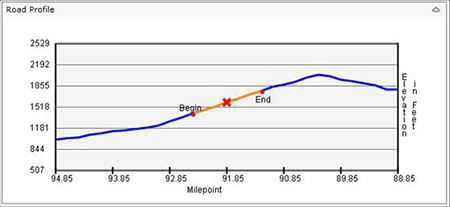
Slide 22. Traffic Planning Sheet (TPS)
Roadway Profile
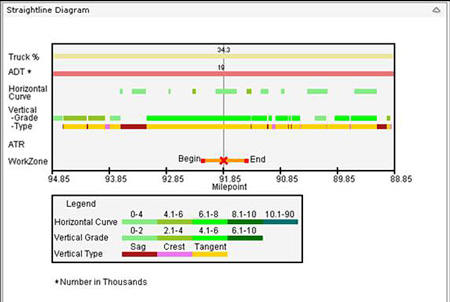
Slide 23. Traffic Planning Sheet (TPS)
Straightline Diagram
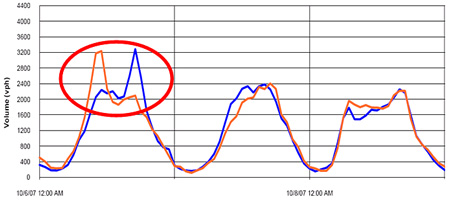
Slide 24. ATR Graphing Tool
- Allows for the graphing of actual volumes from an Automatic Traffic Recorder (ATR) over a user defined period
- Albany ATR
- October 6, 2007 to October 9, 2007
Slide 25. Summary
- Delay estimates and work windows can be generated quickly
- Ability to predict delays/travel times for work zones, segments, and corridors
- Delay summaries affect scheduling and staging for major construction projects
- During planning: Closure chart and delay estimates influence staging strategies
- During design: Closure information used in project specifications
Slide 26. Contact Information
Irene Toews, P.E.
ODOT
Traffic Control Plans, QA Engineer
Irene.toews@odot.state.or.us
355 Capital Street NE
Salem, OR 97301
(503) 986-3595
Jeremy Jackson, E.I.T.
OBDP
Traffic Engineering Intern
jeremy.jackson@obdp.org
660 Hawthorne Ave SE, Suite 220
Salem, OR 97301
(503) 316-5519