
|
|
||
|
|
Performance Measures to Improve TIMTIM programs must rely on efficient data collection, analysis, and reporting to measure performance and identify opportunities to improve. However, performance management through enhanced data collection remains elusive in many jurisdictions that either do not collect TIM data, collect data for a small percentage of traffic incidents, or collect inconsistent and inaccurate data that may mislead the direction for program improvement. FHWA promotes the adoption of four national TIM performance measures: 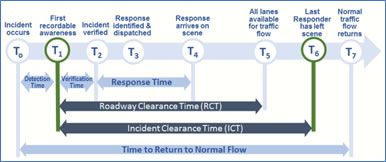
T0 - Incident occurs, T1 - First recordable awareness, T2 - Incident verified, T3 - Response Identified and dispatched, T4 - Response arrives on scence, T5 - All lanes available for traffic flow, T6 - Last Responder has left scene, T7 - Normal traffic flow returns
Nearly all transportation agencies collect data on the types and frequency of incidents. To improve TIM planning and operations, many TIM programs collect additional data related to incident detection time, verification time, response time, time of scene by responder type, types of secondary crash, and details regarding responders struck at the incident scene. These data are collected through Traffic Management Centers (TMCs), State crash reports, Computer Aided Dispatch (CAD), Safety Service Patrol, and crowdsourced data. The FHWA Every Day Counts Round Four, Using Data to Improve worked with 30 State TIM programs to improve the collection, analysis, and reporting of TIM performance. Agencies typically share the performance of their programs through quarterly or annual reports while monitoring TIM performance internally at a monthly or more frequent cadence. Using comparable data reporting and metrics can increase transparency in demonstrating program effectiveness to stakeholders. It can also help justify future funding for TIM resources by quantifying its safety and economic benefits. Accelerating this data collection and including it in performance management will help TIM programs realize their full potential for keeping motorists and incident responders safer and roads and highways clear. Related Information
Contact UsFor more information, please contact: Paul Jodoin |
|
| US DOT Home | FHWA Home | Emergency Transportation Operations Home | Operations Home | Privacy Policy | ||