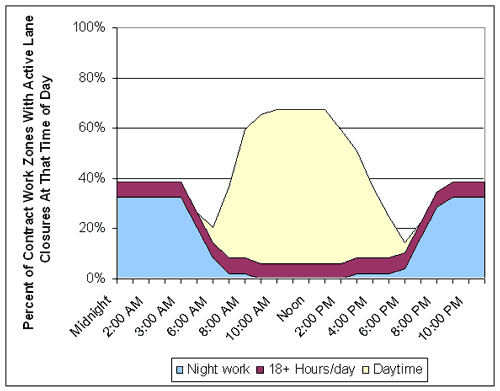
Description of Slide 22. Extent of Nightwork

Description
This graph shows the percent of contract work zones with active lane closures at that time of day from 0 to 100% on the y-axis and shows the time from midnight to midnight on the x-axis. The graph depicts nightwork, work of more than 18 hours per day, and daytime work.
Nightwork is shown as 32% from midnight to 4 a.m. It steadily decreases from 32% at 4 a.m. to 2% at 8 a.m. Nightwork then decreases from 2% at 8 a.m. to 0 from 10 a.m. until 3 p.m. It increases from 0 at 3 p.m. to 3% at 7 p.m. Nightwork increases from 3% at 7 p.m. to 30% at 9 p.m. It increases from 30% at 9 p.m. to 32% from 10 p.m. until midnight.
Work of more than 18 hours per day is shown as 39% from midnight to 4 a.m. It steadily decreases from 39% at 4 a.m. to 7% at 8 a.m. It then remains relatively steady at 7% from 8 a.m. until 7 p.m. Work of more than 18 hours per day increases from 7% at 7 p.m. to 35% at 9 p.m. It increases from 35% at 9 p.m. to 39% from 10 p.m. until midnight.
Daytime work is shown only between 6 a.m. and 8 p.m. It is shown as 25% at 6 a.m. and increases to 60% by 9 a.m. and to 65% from 11 a.m. to 2 p.m. Daytime work then steadily decreases to 10% by 7 p.m., increasing to 20% at 8 p.m.
