Work Zone ITS Overview Webinar January 30, 2014
ITS Work Zone Experiences in Southern Illinois
slide 1
ITS Work Zone Experiences in Southern Illinois
Ted P. Nemsky, P.E.
Illinois Department of Transportation
District 8 Engineer of Construction
slide notes:
None
slide 2
Smart Work Zones in Southern IL
- What is a Smart Work Zone?
- Where is IDOT using Smart Work Zones and how is this determined?
- What drove us to this point?
- Are Smart Work Zones worth the cost?
slide notes:
I was asked to relay our experiences with Smart Work Zones in Southern IL and in doing so I came up with the following topics that I would like to discuss today.
slide 3
What is a Smart Work Zone?
The use of technology via sensors, computers and message boards to automatically collect and convey real-time data to the motorist.
http://www.ops.fhwa.dot.gov/wz/workshops/accessible/Pant_paper.htm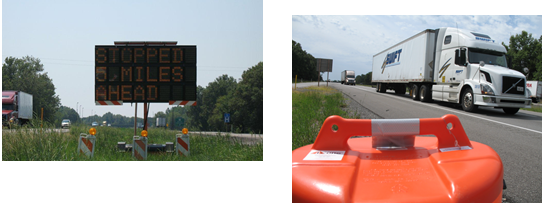
slide notes:
. . . the application of computers, communications, and sensor technology to freeway transportation and would possess the following general characteristics:
Real-time: The system obtains and analyzes traffic flow data in real-time, providing frequently updated information to motorists.
Portable: The system is portable, hence allowing its installation (with minor modifications as necessary) at different locations.
Automated: The system operates in an automated manner with as minimal supervision as possible by human operators.
Reliable: The system provides accurate and reliable information, keeping in mind the serious consequences of misinforming motorists in work zone situations.
slide 4
Smart Work Zone Components
- Doppler Speed Detectors
- Blue Tooth Technology Traffic Sensors
- Message Boards and Color Message Boards
slide notes:
None
slide 5
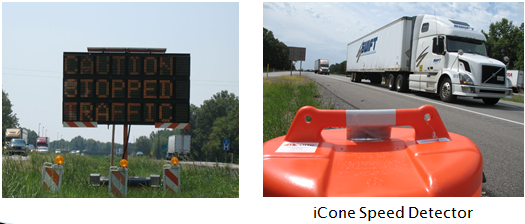
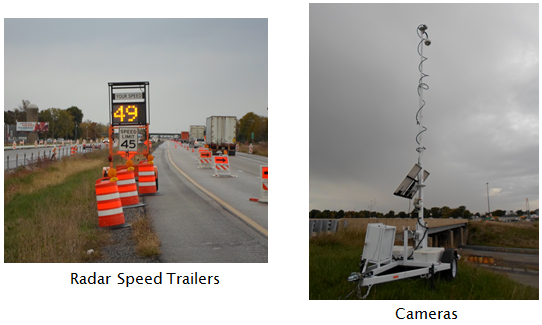
SWZ Components
slide notes:
IDOT's Bureau of Safety recently starting requiring the use of radar speed trailers on the entry to all of our interstate workzones. I believe we have had some success at getting traffic to slow down with these. Cameras are great for managing incidents that occur within the workzone and our Resident Engineers have found them useful as well for day to day work.
slide 6
Courtesy Ver-Mac
slide notes:
Most systems include some sort of software interface for the authorized user.
slide 7
Courtesy iCone
slide notes:
And they provide some sort of visual interface to see message displays and speed sensors, etc.
slide 8
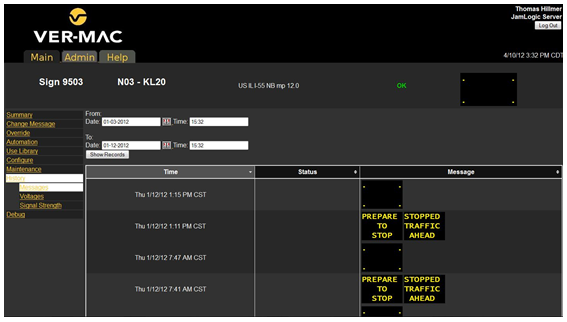
Screen Shot of Logic
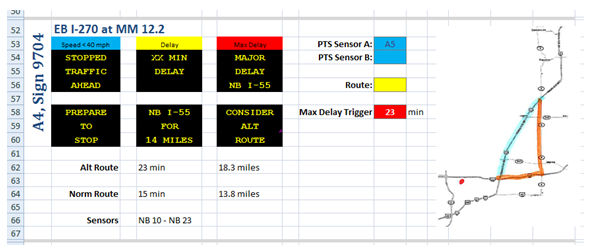
Courtesy Ver-Mac
slide notes:
Most include some logic and with such a number of decisions need to be made when setting up a system. Priority Order of messages Special Provision required to notify traffic of stopped conditions (<30mph). Our system was set with 40 mph trigger. When you want to have it suggest an alternate route
slide 9
slide notes:
No messages – What then?
Four Corners –to let us know board is operational when no message. Dark board – non-operational.
slide 10
PTS – Prepare to Stop Hours for August
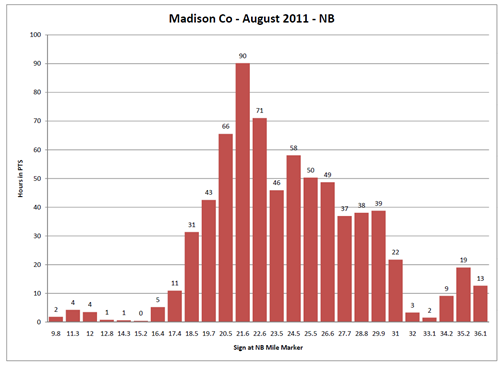
*Courtesy Ver-Mac
slide notes:
Most software is capable of providing a considerable amount of data analysis of the system functions (e.g. Prepare to Stop)
slide 11
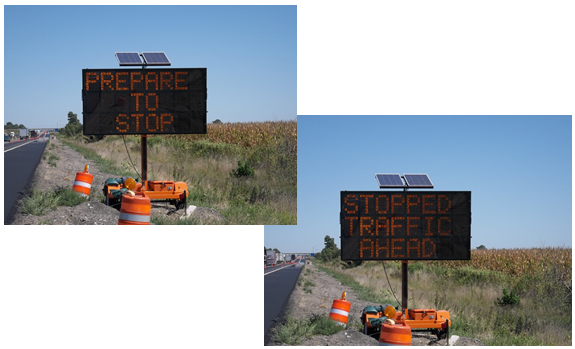
slide notes:
System can't function without conveying the messages to the motorist. Message Boards and or Electronic Signs are a very important part of any system.
slide 12
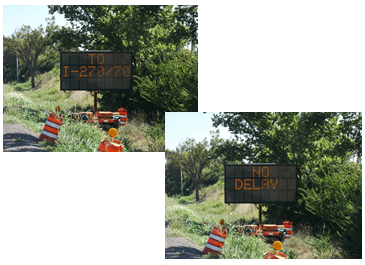
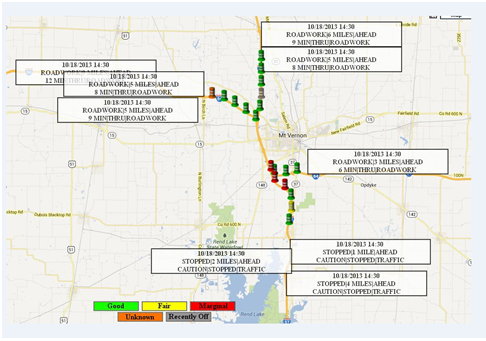
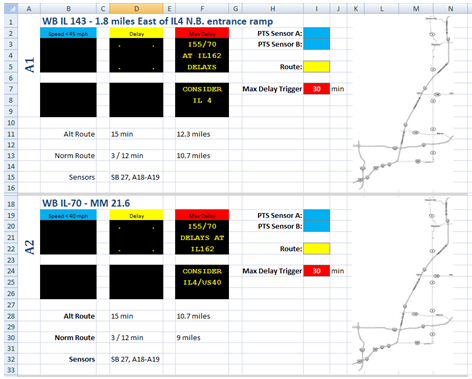
slide notes:
Another decision is how to communicate delay times to the motorist. Motorist from outside the area typically need different information than locals since they aren't readily aware of times to different interchanges and such. Hence for locals we found it useful to include delay/no delay information to the next interchange.
slide 13
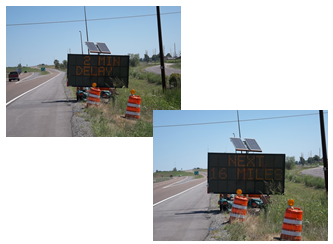
slide notes:
For through travelers we found it more useful to include delays times through the entire workzone. We would alternate messages for local delay times and through travel times for the first two boards in a sequence wherever traffic was entering the system.slide 14
Determination of When to Use SWZ's
- Currently No Policy for Use of SWZ's at IDOT
- Project by Project Basis
- Based on knowledge of project area, traffic, accidents and site distance issues.
- Queuing analysis.
- Only used on interstate projects lasting at least one season.
- Developing Policy and Tiered Statewide Contract Special Provisions
slide notes:
- Currently No Policy for Use of SWZ's at IDOT
- Currently Selected on a Project by Project Basis by each IDOT District
- Based on knowledge of project area, traffic, accidents and site distance issues.
- Queuing analysis.
- Only used on interstate projects lasting at least one season.
- IDOT is working on a policy and contract special provisions for the use of SWZ's. The policy will include guidance on the implementation of Smart Work Zone's on a tiered basis with criteria currently being developed to assist with deciding when and where to deploy each. The contract special provisions are anticipated to be tiered as follows:
- Contract Special Provision 1 - To be used to simply alert traffic to queues for interstate closures and is anticipated to be utilized on most interstate projects with lane closures.
- Contract Special Provision 2 –To be used to alert traffic to queues and include some degree of real time traffic delays. Anticipated to be used on rural interstate projects with lane closures causing moderate delays.
- Contract Special Provision 3 - Will encompass all aspects of Smart Work Zone technology including blue tooth technology, cameras, etc. Anticipated to be used on urban interstate projects with lane closures causing significant delays/detours.
slide 15
Where are we using SWZ's?
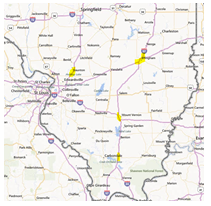
slide notes:
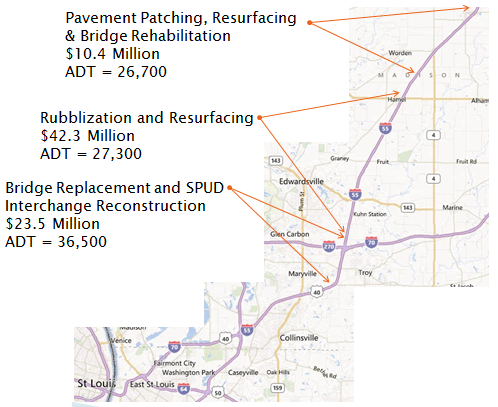
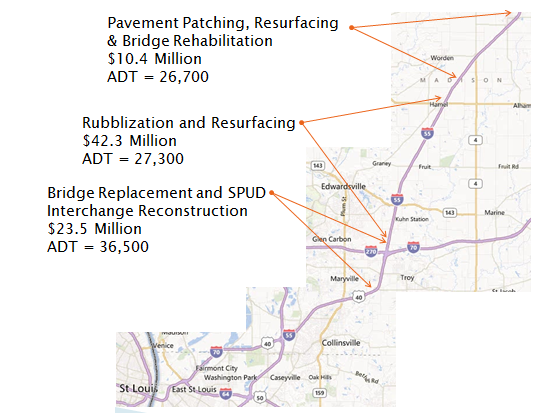
That said, in southern IL we have deployed SWZ's at the following locations over the past couple of seasons:
- An $87.3 M Reconstruction of I-57 through Effingham
- A $30.6M Reconstruction of the I-57/64 tri-level interchange near Mt. Vernon.
- A $40.4M Reconstruction of the I-57/IL13 interchange at Marion
- An $18.4M Rubblization Project along I-55 between St. Louis and Springfield near Edwardsville
slide 16
Smart Work Zone Summary For 2012/2013 Construction in Southern IL
| Location | Smart Work Zone System | Total $ |
|---|---|---|
| I-57/70 Effingham | Ver-Mac | $2.5 million |
| I-57/64 Mt. Vernon | iCone | $1.1 million |
| I-57/IL 13 Marion | ASTI | $576,500 |
| I-55 Edwardsville | Ver-Mac | $455,000 |
| Total | $4.6 million |
slide notes:
None
slide 17
What drove us to this point?
It wasn't our 2006 I-64 Add-Lane project near St. Louis!
slide notes:
2006 was our first attempt utilizing a SMZ system to relay delay times. We were adding a lane to a busy interstate near St. Louis and we expected significant delay times in the 1-2 hour range during peak times. It was a failure. The Cell technology of that time could not keep the boards updated. We ended up pulling the plug on this one and vowed not to use it again! As usual things change and we made the paper . . .
slide 18
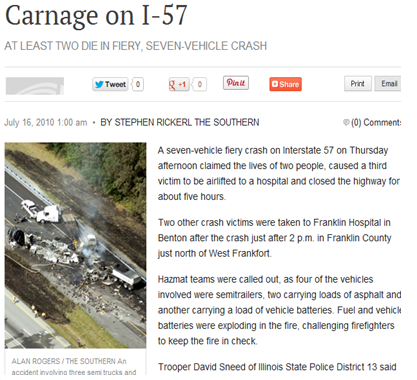
http://thesouthern.com/news/local/article_d2ba9b7a-9090-11df-b22a-001cc4c002e0.html?mode=image
slide notes:
But not in a good way. Not a very good headline. Seven vehicle multiple (2) fatality accident involving 4 semitrailers with 2 of the trucks carrying asphalt to the project that caused the queue. It was a section of rural interstate with numerous sags and crests.
slide 19
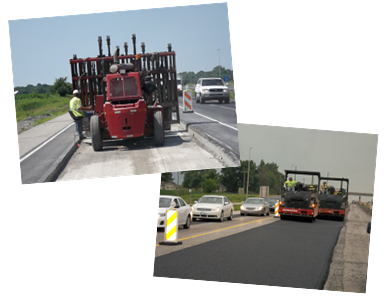
Immediate Response
Implemented Truck Mounted Message Sign to Alert Traffic to Stopped Conditions
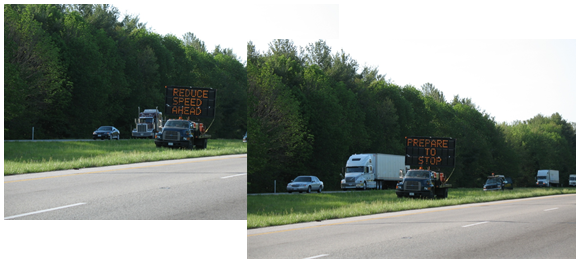
slide notes:
It was a good immediate response but has issues. Trying to navigate the median and crossing bridges and such.
slide 20
Secondary Response
- Investigated use of automated system that could be implemented immediately to alert traffic to stopped conditions
- Implemented iCONE System of Speed Sensors, computer software/logic, and PCMS's
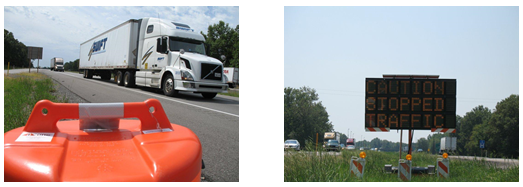
slide notes:
Our Carbondale District took action to research and get a system in place that could alert motorist to stop conditions using the iCone system. A speed sensor that triggers a message board.
slide 21
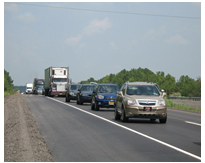
Two Directives for 2010/2011 I-55 Projects:
- Do something to reduce the likelihood of an accident like that on I-57.
- Do something to better inform the traveling public about delays and help them with options to minimize delays.
slide notes:
None
slide 22
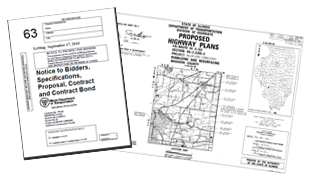
Process
- Researched and Interviewed three ITS Work Zone Companies
- Developed a 2 page Contract Special Provision and plan sheet addendum in accordance with state procurement laws allowing at least two bidders to meet the specification
- Included by Addendum with our Contract Plans
slide notes:
None
slide 23
Smart Traffic Monitoring Special Provision Requirements
- Collect Real Time Vehicle Data
- Analyze Data via Control Software
- Alert Drivers of Delay Times, Stopped Traffic Conditions, and Alternate Route Options
- Included Penalty of $2000/Hour after 4 hours
Link to Contract Plans & Special Provisions/Addendums: http://eplan.dot.il.gov/desenv/091710/76C93-063/
slide notes:
None
slide 24
Project Facts
|
Joint Venture of Keeley & Sons, Inc. and The Kilian Corporation Awarded Contract Cost: $42,254,835.85 Project Description: Rubblizing, Resurfacing, & Bridge Work on I-55 from I-270 to IL 140 (11+ miles) Contract Letting Date: 9/17/2010 Start Date: December 2010 |
 |
slide notes:
None
slide 25
2011 Season
slide notes:
We had two other projects on-going along this same route adjacent to this project.
slide 26
ITS Smart Work Zone Project Facts
ITS System:
Equipment Facts:
|
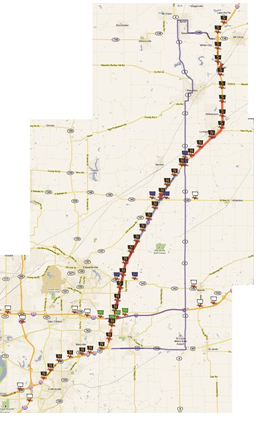 |
slide notes:
We included the limits of those 2 adjacent projects within our ITS SWZ system cover 30 miles of construction with a 6 mile lead in each way. A board and a sensor about every mile each direction give or take. And utilized some boards up on cross roads for delay times.
The white face signs were "changes" for "travel times and dynamic detour" and the green face signs were "changes" to make them "SMART" and used for all functions. Blue face signs were "changed from standard ILDOT signs to make them "SMART" and part of the system and I think the pay item for standard ILDOT warning signs was eliminated.
slide 27
Awards
- 2011 IDOT Contractor of the Year Award for "Work Zone Traffic Control"
- 2012 America's Transportation Awards "Best Use of Innovation for Medium Project"
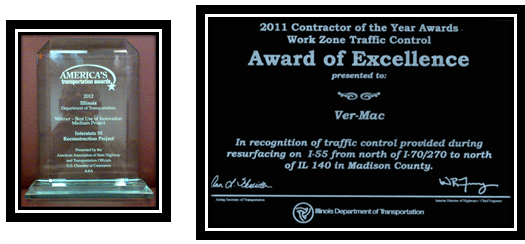
slide notes:
The project received several awards but more importantly was the positive feedback we got from the travelling public or the lack of upset callers. Several calls about how well it worked and when it didn't. Told us that people used the delay times and counted on the messages.
slide 28
Are Smart Work Zones worth the cost?
| 2012/2013 Contracts | Contract $ | SWZ $ | % Cost |
|---|---|---|---|
| I-55 Madison Co. | $18.4 million | $455,000 | 2.50% |
| I-70 Effingham (3 contracts) | $87.3 million | $2.5 million | 2.80% |
| I-57 Marion SPUD Interchange | $40.4 million | $576,500 | 1.40% |
| I57/64 Mount Vernon | $30.6 million | $1.1 million | 3.60% |
| Totals | $176.7 million | $4.6 million | 2.60% |
slide notes:
Here are the costs associated with the SWZ's for each of the 4 projects we had going the past couple of years. It varies from 1.4% to 3.6% but average around 2.6% of total contract costs. We knew that the delay times seemed to provide the information we were looking for but as Engineers we must analyze to find out if it was worth this cost. It is difficult to put a price on what value motorist put on delay times but I figured we could look to see if the system accomplished its primary directive of reducing accidents.
slide 29
"Get your facts first, and then you can distort them as much as you please. Facts are stubborn, but statistics are more pliable." — Mark Twain
slide notes:
This is a quote I like to remember whenever I am looking at statistics. I think it servers to try to keep me objective when analyzing such realizing as Mark Twain did that it is human nature to try to prove your point with statistics.
slide 30
2010 & 2011 Seasons
slide notes:
During the 2010/2011 Construction Seasons we had a considerable amount of work going on along I-55 near St. Louis.
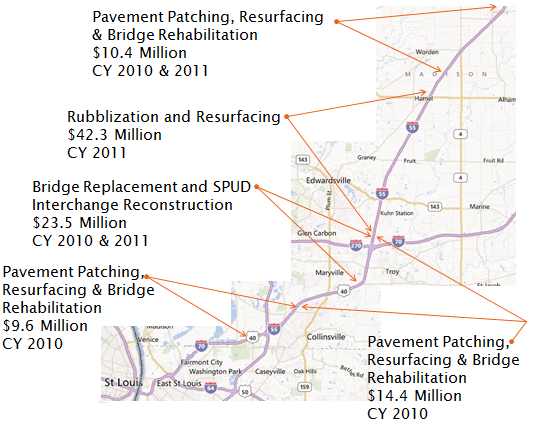
slide 31
2010 Season
Smart Work Zone not utilized during 2010
slide notes:
In 2010 these 4 jobs were on-going and a SWZ was not utilized.
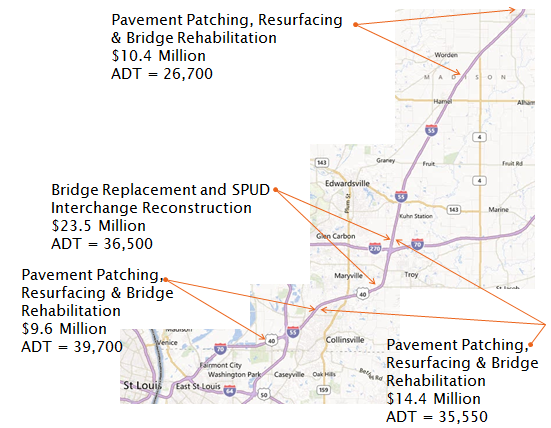
slide 32
2011 Season
Smart Work Zone utilized on all 3 contracts in 2011
slide notes:
In 2011 these 3 jobs were on-going but with a SWZ in place as described earlier. Seemed like a great place to start was to compare the accident data between these 2 years for this route.
slide 33
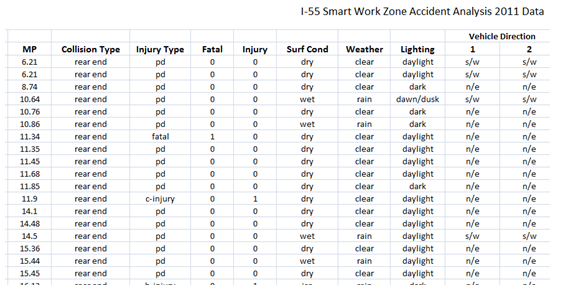
2011 Accident Data (Facts)
slide notes:
So that is what I did. I summarized all rear end type accidents from our 2010 and 2011 accident data to analyze. Only looked at Rear End Accidents because those are what our system was set-up to reduce.
slide 34
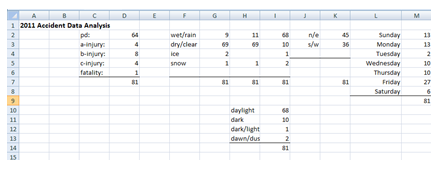
slide notes:
Totaled statistics from each year.
slide 35
2011 Construction Compared to 2010 (Statistics)
| 2010 | 2011 | Difference | % Change | |
|---|---|---|---|---|
| Total Miles I-55 Construction | 19.5 | 20.2 | 0.7 | 3.60% |
| Total Lane Closure Days | 355 | 540 | 185 | 52% |
| *Total Vehicle Exposure(ADT x Lane Closure Days) | 13,031,750 | 16,346,800 | 3,315,050 | 25.40% |
| Property Damage Accidents | 75 | 64 | -11 | -14.60% |
| Injury Accidents | 18 | 16 | -2 | -11% |
| Fatalities | 1 | 1 | 0 | 0% |
| Total Queuing Accidents | 94 | 81 | -13 | -13.80% |
| *Does not account for ADT using Detours | ||||
slide notes:
And here are the results.
From 2010 to 2011 we had – go thru Comparison with following notes:
- More lane closure days than in one year because a lane restriction was counted for each new set up through each work zone.
- I decided to use Total Vehicle Exposure (ADT x Lane Closure Days) as a way to get closer to comparing apples to apples.
- So in summary with over 25% more vehicle exposure rear end type accidents were reduced by nearly 14%
slide 36
Lessons Learned
|
 |
slide notes:
None
slide 37
Thank you!
Questions?
ted.nemsky@illinois.govslide notes:
None