Traffic Analysis Tools Volume IX: Work Zone Modeling and Simulation
A Guide for Analysts
2.0 Work Zone Analysis Factors
The ultimate reason for developing and deploying a transportation modeling approach is to help make an informed decision regarding the implementation of one or more work zones. These key decisions can occur at any stage during the project life cycle including Planning, PE/Design, and Construction. For example, during the Construction stage, a contractor may propose a change to an approved lane closure plan in order to better utilize available time in the roadway by extending the overnight work hours into the morning commute. The analyst employed by the transportation agency will need to assess the merits of the proposed change and consider how to develop a feasible analytical assessment strategy by answering a number of questions related to the work zone[1]. First, how complex is the work zone area to be modeled? Is it an isolated element or part of a larger network? Second, what type of data is available to conduct an assessment such as traffic volumes? How will the proposed changes affect the transportation management plan? What resources are available to the analyst including staff resources, model and data availability, as well as the time available to actually conduct the analysis? Finally, what is the critical measure of system performance that will characterize mobility impacts of the proposed change: vehicle queue extent, vehicle delay, cumulative travel time? All of these considerations create constraints or opportunities for developing an effective analytical approach.
This example highlights an important issue for many transportation agencies. If the agency has already developed a robust analytical capability regarding a particular work zone, analyzing the contractor’s proposal is relatively straightforward (plug the new alternative into an existing model). Conversely, an agency that needs to respond to the contractor’s proposal quickly may not be readily able to conduct an analysis given the analytical capability does not exist and a work zone model has to be built from scratch. This could result in a rushed analysis that lacks accuracy or uses a tool that is too simple to analyze the proposal correctly. Therefore, many transportation agencies are beginning to think of work zone analyses in terms of an ongoing process that begins during project planning, is refined during preliminary engineering and final design, and is available for quick response during construction.
Regardless of project stage, a number of factors will ultimately influence the selection and use of a specific transportation analysis tool by an analyst. Figure 5 provides a graphical representation of the categories of factors influencing the selection of a work zone analysis approach.
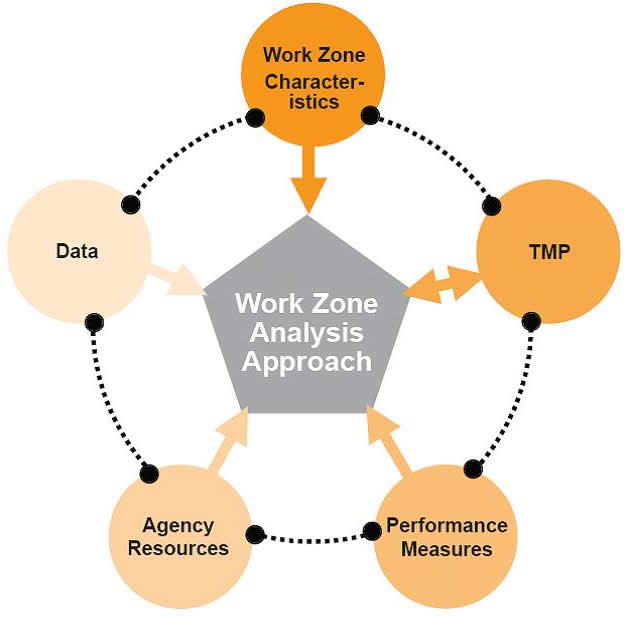
Figure 5 Work Zone Analysis Factors
- Work Zone Characteristics — Facility type, network form, and geographical scale of the potential work zone impact area.
- Transportation Management Plan Strategies — Temporary traffic control strategies, public information campaigns, and transportation operations.
- Data — Availability of data types (roadway characteristics, travel demand) as well as sources and quality of the data.
- Agency Resources — Institutional arrangements as well as the technical capability of the agency including modeling experience, model availability, and funding.
- Work Zone Performance Measures — The critical metrics used to differentiate alternatives and characterize impacts (e.g., maximum queue or additional travel time) as well as the precision of the results.
All of these factors have to be evaluated in order to select an appropriate work zone analysis approach. As represented by the black dotted lines, one category of factors may influence other categories. Thus, agency resources (in terms of budget constraints) may limit the quality and amount of data available which may affect the selection of a transportation modeling approach. What is important to note is that the connection between the work zone analysis approach and TMP is bidirectional indicating a work zone analysis approach is influenced by the TMP as well as influencing development of the TMP. The TMP cannot be treated as simply another factor in deciding which work zone analysis approach to select, but also to help guide the analyst in the selection of a work zone analysis approach as well.
The following five subsections will discuss each of these categories in more detail by providing a definition of the various terms and concepts, what is meant by each, and providing case study examples of how analysts have successfully addressed these factors in a work zone assessment.
2.1 Work Zone Characteristics
These sub-sections discuss how the physical attributes of the work zone itself, including the type of work zone, network form, and the geographic scale of the work zone impact area, shape and influence the modeling approach to be used.
2.1.1 Type
The first work zone characteristics is the work zone type which is an indication of the expected level of impact a work zone will have on travelers. FHWA provides example definitions in the report FHWA Work Zone Self Assessment Guide (3). TAT Volume IX uses the work zone types as defined in the Work Zone Self Assessment Guide which categorizes work zones as being one of four types based upon the magnitude of expected impact. The most severe work zone is a Type I work zone which have the most impact on the traveling public and usually occur over a long duration. Examples include the Springfield Interchange “Mixing Bowl” project in Northern Virginia and the Big Dig in Boston. A Type IV work zone will have little disruption on traffic flow as well as a short duration. Minor maintenance operations such as guardrail repair, sign repair, and mowing are typical Type IV work zones.
Work zone type is often a strong indicator of the level of resources available to conduct a work zone analysis. The physical characteristics of the highway network may have a strong influence on the impacts caused by the project. For example, rural highways in sparsely populated areas may lack good alternate routes. In addition, the perceived impacts of a highway project may vary depending on local expectations about what is an acceptable level of congestion. For example, residents of a major metropolitan area may be more accustomed to driving in congested conditions than residents of a small town. Thus, selecting a transportation modeling approach for work zone analysis should not be based solely upon the work zone type but rather augmenting that decision with a consideration of the complete range of factors addressed in this document.
Type I — Type I work zones affect the traveling public at the metropolitan, regional, intra- and interstate levels over lengthy periods of time. They attract significant public interest, impact large numbers of road users, and are deployed at significant cost. The consideration of Type I work zones often includes quantitative analysis of work zone impacts for both internal agency use and shaping public expectation. In many cases, an impact assessment for these major projects is required by agency policy. The transportation modeling approach developed is tailored to the needs of the agency and resources available to perform the analysis. Analytical tool categories deployed to support Type I work zones include the full range of tools from sketch-planning and HCM methodologies to microscopic simulation. However, the tools are used quite differently depending on the decisions being supported. Type I projects typically cause both localized and area-wide impacts on travel demand and traffic. Often a Type I work zone will employ various work zone analysis tools including a regional travel demand model to estimate region-wide travel impacts, and then use a sketch planning tool to determine traffic impacts on individual highway segments. Given the complex nature of these work zone types, it is important that the agency identify its goals and objectives, needs, and available resources to identify the specific tool or tools that will provide the agency with the outcomes it desires. These projects have the largest potential impact and generally have more substantial resources allocated to the assessment of predicted work zone impacts. Examples of Type I work zones include:
- Woodrow Wilson Bridge in Maryland/Virginia/District of Columbia
- Central Artery/Tunnel in Boston,Massachusetts
- Springfield Interchange "Mixing Bowl" in Springfield, Virginia
- I-15 reconstruction in Salt Lake City, Utah.
| Woodrow Wilson Bridge Replacement |
|---|
The replacement of the Woodrow Wilson Bridge, along Interstate 95 in the Metropolitan Washington, DC area, is an extremely large and complex construction project requiring the close coordination of numerous contractors and various state and local government agencies. The Woodrow Wilson Bridge carries upwards of 100,000 vehicles per day along Interstate 95 which spans the Potomac River. The Woodrow Wilson Bridge Project spans a 7.5 mile-long corridor extending from the MD 210 interchange in Maryland to Telegraph Road in Virginia, crossing over the Potomac River. The current 6-lane bridge is being replaced with a dual-span bridge that will more than double the number of traffic lanes. This project is categorized as the most severe work zone—Type I. This project directly impacted several miles of major roads and interchanges in two states including I-95/I-495 (Capital Beltway) from Maryland to Virginia, I-295, MD 414, and MD-210 in Maryland, and Telegraph Road, Route 1, and Washington Street in Virginia. To keep traffic moving throughout the multi-year project, the construction work for the Woodrow Wilson Bridge project had to be completed in individual phases instead of one large permanent work zone. Work zone plans had to be developed for each phase of this construction project. The WWB project used a number of different modeling approaches to understand work zone impacts ranging from the simplest HCM methodologies to microscopic simulation primarily during the construction stage. More information can be found in the Woodrow Wilson Bridge Reconstruction case study. |
Type II — Type II work zones impact travelers at the regional and metropolitan levels. They directly impact a range of road users and can attract significant public interest. The cost impacts are usually moderate to high and the work zones will usually be set up for a long period of time. Analysts considering Type II work zones will benefit from a quantitative analysis to evaluate impacts to the public. Often, this analysis is required by the agency. Similar to Type I, the full range of transportation modeling approaches are well suited for Type II work zones. This is not to suggest that any of the tools identified here are appropriate for a specific work zone project application. Rather, it is important to identify an appropriate role for a work zone analysis tool based upon the many opportunities and constraints available to the analyst. In some cases, the use of a specific transportation analysis tool will be required by agency policy. Examples of Type II work zones include:
- Major corridor reconstruction
- High-impact interchange improvements
- Full closures on high-volume facilities
- Major bridge repair
- Repaving projects that require long term lane closures
| CALTRANS I-15 Rehabilitation |
|---|
The existing four mile section of I-15 in Ontario, California consists of four to six lanes in each direction and carries an AADT of approximately 200,000, with a particularly high percentage of heavy truck traffic (about 12 percent on average on weekdays). In addition, the corridor has consistently high weekday commuter peaks and similar volumes on weekends due to leisure travelers from Los Angeles headed to and from Las Vegas and resort locations along the Colorado River. The reconstruction will rebuild two to three truck lanes in each direction. This construction project exhibits the characteristics of a Type II work zone because of the consistently high volumes and heavy truck traffic and the work zone impacts are moderate. Caltrans employed the use of three traffic modeling tools: a sketch-planning tool, an HCM model, and a mesoscopic traffic network analysis tool. The sketch-planning analysis and HCM analysis were used to analyze alternative construction scenarios and the mesoscopic analysis tool was used to assist in the development of the transportation management plan and to provide supplemental construction staging analysis. More information can be found in the Caltrans I-15 Pavement Reconstruction Project case study. |
Type III — Type III work zones have a low to moderate level of public interest. They can affect travelers at the metropolitan or regional level, but travelers are usually affected at a low to moderate level. The cost impacts will be less and the duration of the work zone will not be lengthy. The work zone may include lane closures, but these are implemented for only short periods of time. While the full spectrum of modeling approaches can be applied to Type III work zones, agency resources are frequently limited in nature when considering these types of projects. Thus, the opportunity to set up and use more complex tools such as microscopic and mesoscopic simulation tools may be limited because of resource constraints. A region may have a number of Type III work zones in the pipeline ready for planning, design, and construction. In this case, the use of simplified screening approaches (such as sketch planning and HCM tools) that can rapidly and cost-effectively analyze numerous different variations may be appropriate to determine those work zones requiring further and more detailed analysis. Examples of Type III work zones include:
- Repaving work on roadways and the National Highway System (NHS) with moderate Average Daily Traffic (ADT)
- Minor bridge repair
- Shoulder repair and construction
- Minor interchange repairs
| Zion National Park |
|---|
Zion National Park is an example of a Type III work zone. The repaving of the entrance booth area was of moderate public interest, primarily related to those businesses in the town of Springdale who would be impacted by any significant queuing caused by the temporary closure of entrance lanes. The National Park Service decided to use a sketch-planning tool during the final aspects of design to specifically address the scheduling of the work zone and determine whether or not it was justified to shift construction to night work. More information is available in the Zion National Park: Entrance Booth Reconstruction case study. |
Type IV — Type IV work zones are expected to have little impact, if any, on the traveling public. They attract little public interest and work zone duration is short to moderate. It is sometimes difficult to provide information to travelers for these types of projects because they will usually be out of the roadway or off the shoulder before the message is relayed to the travelers. These types of work zones are usually mobile. While the full spectrum of transportation modeling approaches can be used to analyze a Type IV work zone, in all likelihood, many Type IV work zone projects may be effectively assessed either by a simple transportation modeling approach (e.g., sketch planning or HCM methodology) or the expert knowledge internalized by operations managers after years of experience. However, developing a strategic methodology to analyzing these types of work zones may be useful to ensure any roadwork does not unintentionally impact mobility. In this situation, it may be most cost-effective to establish an agency-wide program to assist personnel in quickly screening these types of work zones rapidly and effectively. Examples of Type IV work zones include:
- Certain low-impact striping work
- Guardrail repair
- Minor shoulder repair
- Pothole patching
- Very minor joint sealing
- Minor bridge painting
- Sign repair
- Mowing
| New Jersey Turnpike Authority: Lane Closure Application |
|---|
The New Jersey Turnpike Authority developed a GIS-based Lane Closure Application designed specifically to quantify the impacts associated with Type IV work zones, typically routine maintenance work that includes shoulder work or short-duration lane closures such as roadway sign or maintenance. A more detailed discussion of the tool is available in the New Jersey Turnpike Authority: Lane Closure Application case study. |
2.1.2 Network Form
The second work zone factor that must be accounted for when deciding to use a work zone analysis tool is network form (also commonly referred to as network configuration or network structure). In a sense, network form is a surrogate for the overall complexity of the roadway where the work zone impacts will be evaluated and which are not accounted for within the FHWA work zone types. For work zone analysis, network form is composed of three general categories: isolated, pipe, and grid.
Isolated — An isolated network form consists of a single work zone that has limited interaction with the surrounding infrastructure and facilities. Because of the limited interaction, the work zone may only have periodic impact on the immediate surroundings depending on the size and duration of the construction project and the traffic demand for the facility. Examples of isolated networks include some bridge deck replacement projects, rural lane closures, or a redesigned interchange. Figure 6 provides a visual representation of two isolated work zones in the fictitious Hillsboro County. In the figure are two circles representing two work zones that are isolated from other roadway infrastructure as well as each other.
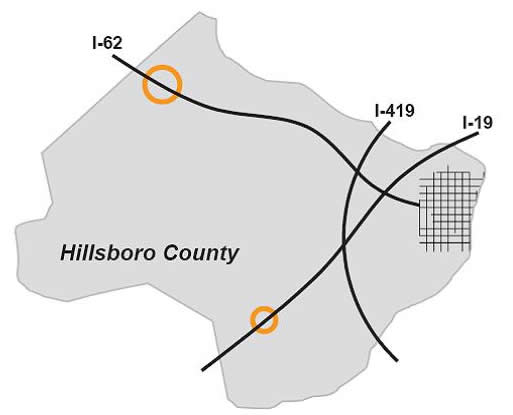
Figure 6 Isolated Network Form
Pipe — A pipe network form (sometimes referred to as a corridor network form) consists of a roadway segment with two or more work zones interacting with each other and includes some limited access points and connections with other roadway segments (such as interstate entrance ramps). However, these work zones typically do not include any type of viable alternate or detour route. An example of a pipe network form would be a long interstate corridor reconstruction outside an urban area. Figure 7 provides a visual representation of a pipe network form work zone in the fictitious Hillsboro County. In the figure are three circles representing three work zones that are located close to each other resulting in an interaction among the three.
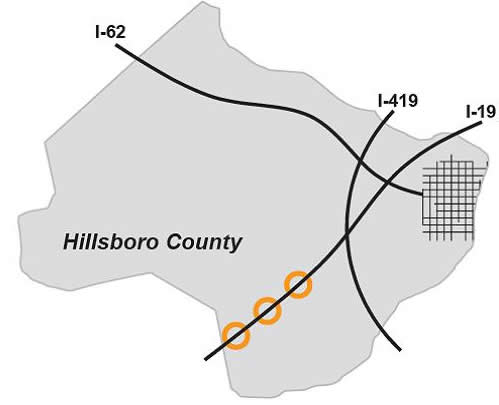
Figure 7 Pipe Network Form
Grid — A grid network form is a connected, inter-dependent structure with multiple access points and one or more viable alternate routes. Examples of grid network forms include urban interstate reconstruction, reconstruction involving full roadway closures, signalized arterial roadway reconstruction, and work zones located in urban centers. Figure 8 provides a visual representation of two grid network form work zones in the fictitious Hillsboro County. In the figure is one circle representing the location of a work zone involving three interstate roadways. Also indicated by the arrow is the downtown CBD.
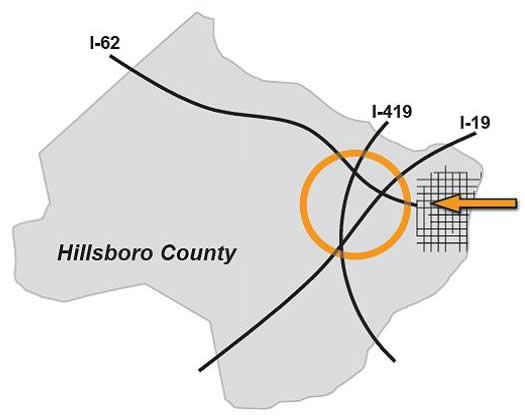
Figure 8 Grid Network Form
The network form will have an impact on the effectiveness of various transportation modeling approaches. Work zones with impacts limited to a single mainline facility (e.g., isolated network form) are generally easier to model than more complex work zones with impact across a broader network of parallel facilities and cross-streets (e.g. grid network form). Many of the tools on the simpler end of the work zone modeling spectrum (e.g., HCM tools, or sketch-planning tools) assume that traffic demand follows a simple in/out pattern through the work zone. For isolated and pipe network forms, such an assumption is often reasonable. Sketch-planning tools have often been selected to analyze isolated work zones and there are numerous case study examples included in this document. A sketch-planning tool is often deemed a cost-effective approach in these cases, particularly if limited demand and capacity data are available.
The incorporation of detour and alternate routes (a major characteristic of grid network forms) limit which modeling approaches can be used. Many of the macroscopic simulation models do not have the ability to account for detour and alternate routes. Thus, if a detour route is required it is important the model selected has the functionality to account for traffic volume diverted to other facilities in the network because certain classes of vehicles are not permitted in the work zone or because road users are attempting to avoid delays from one or more work zones.
When work zone impacts create significant changes to an overall network traffic pattern (through diversion or other changes to routes normally taken in the network) a more detailed modeling approach must be considered. Often, an origin-destination pattern must be estimated. These potentially time-varying demand patterns are then input into a separate simulation model (typically microscopic or mesoscopic) to more realistically capture diversion effects. In very congested networks or networks with frequent fluctuations in demand or work zone capacity, the use of a dynamic traffic assignment (DTA) modeling component may be necessary. DTA can effectively account for the re-routing of traffic based upon rapidly changing conditions such as intermittent lane closures or congestion on detour routes. However, DTA functionality is only found on the more complex end of the work zone modeling spectrum with mesoscopic and microscopic models and adds considerably to the level of effort required for the study. More information on DTA can be found at http://ops.fhwa.dot.gov/trafficanalysistools/dta.htm.
2.1.3 Geographic Scale
The third factor under work zone characteristics is the geographic scale of the work zone. Geographical scale refers to the size of the area impacted by the work zone. Simpler projects typically have a relatively small geographical scale. For example, a bridge replacement on a rural highway might affect only the road where the bridge is located and one or two nearby routes. At the other extreme, complex projects may influence the traffic patterns in a very large area. For example, the effects of a freeway-to-freeway interchange replacement project might extend all the way to the next freeway-to-freeway interchange.
Work Zone Size — The work zone size encompasses the physical construction zone and the immediate area near the work zone that will be affected by the implementation. These sizes refer to the physical size of the work zone and may or may not be related to the type of work zone. For example, a large construction project does not necessarily have to be a Type I work zone. The construction project may cover a large geographic area, but not impact a large number of travelers or be set up for a long duration. Work zones are divided into three sizes, small, medium and large.
- Small — A work zone implemented on a short segment of an individual roadway or a single intersection.
- Medium — One or more work zones on longer stretches of a single facility and/or portions of adjacent facilities.
- Large — Interacting work zones implemented on significant elements of a larger roadway network.
The size of the work zone will be directly related to the type of analysis that needs to be performed. In general, simpler tools can be used successfully for projects with small geographical scope, while more complex tools are necessary if the analysis extends over a large area. If the analysis area is quite large, meoscopic or microscopic traffic models are typically used. It is important to understand that as the geographical scale increases, so does the level of time, effort and skill required to calibrate the model to match real-world conditions. In resource-constrained cases, transportation modeling approaches may need to be limited to sketch-planning tools, HCM methodologies, or traffic signal optimization tools (if warranted). In other cases, a combination of tools can be used together to offset issues of scale and complexity. There is also the possibility of separating larger work zones into smaller ones, thus focusing resources on more critical elements of the overall work zone. In these situations, the analyst will have to be diligent about accounting for individual work zone impacts in a cumulative manner.
| CALTRANS I-15 Rehabilitation Project |
|---|
An existing four mile section of I-15 in Ontario, California consists of four to six lanes in each direction and planned reconstruction will rebuild two to three truck lanes in each direction. This project exhibits the characteristics of a medium size work zone because it consists of a corridor that covers four miles of existing interstate and the work zone area encompasses three parallel routes to the east and west of the corridor. This medium sized project was analyzed using sketch-planning, HCM, and mesoscopic simulation models. The mesoscopic model analyzed a variety of detour routes. More information can be found in the Caltrans I-15 Pavement Reconstruction Project case study. |
Analysis Area Dimension—The analysis area dimension identifies the full area impacted by the work zone. In many cases, the impact of the project will extend beyond the limits of the work zone itself. This may seem self-evident to some analysts, but all too often it is overlooked when establishing the scope and budget for the work zone analysis, and selecting a methodology that matches the requirements of the project. For example, the construction project might encompass one or two large interchanges along an interstate corridor, but the impact of that project may extend to a larger area depending on traffic demand, lane and ramp closures, and detours and alternate routes. There are transportation modeling approaches that can evaluate each of these types of areas depending on the requirements of the agency. The analysis area dimension is divided into three categories: site, local, and metropolitan.
- Site — Restricted to the immediate area surrounding the work zone.
- Local — Includes surrounding area beyond the work zone to account for detour routes or other localized impacts.
- Metropolitan — Includes multiple jurisdictions (counties, cities, etc.) or facilities.
| Michigan DOT: I-75 Trade Corridor MOTSIM |
|---|
Michigan DOT is developing analytical capabilities to conduct a large-scale analysis of the 19-mile segment of I-75 between Detroit and the City of Pontiac. The microscopic simulation network will consist of the entire metropolitan area associated with the 19-mile segment and builds upon previous analyses of adjacent roadways. Currently in the planning stage, the project entails widening the road from three to four lanes and will enable Michigan DOT to test various scenarios to ensure that mobility is provided throughout the work zone, constructability is maintained, and staging is adequate. More information can be found in the Michigan DOT: Southeastern Michigan Simulation Network case study. |
Table 1 provides a summary of the work zone characteristics as they relate to the project application case studies while Table 2 provides a summary of the work zone analysis approaches that have been historically used in previous work zone assessments. In most cases involving large or high impact projects, sketch planning tools should only be used to augment other tools as part of a multi-scale approach. For example, a valid approach would be to use a network-based model (such as an existing regional travel demand model) to determine the redistribution of traffic in the network, and then the HCM method or sketch planning tool would be used to analyze the localized impacts on affected links. Sketch planning tools cannot carry out traffic redistribution. Therefore, directly applying a sketch planning tool to a complex network carries significant technical risk: the tool is likely to over-estimate the congestion in the immediate vicinity of the work zone, and under-estimate the impacts of redistributed traffic farther away from the work zone.
Traffic signal timing tools have important applications for projects in urban and suburban areas. The signal optimization tool can be used to identify the need for temporary traffic signals and to revise the signal timing plans for existing signals where volumes are expected to increase or decrease as a result of the construction. As with the sketch planning tools, a network-based analysis may be necessary to determine the new traffic pattern resulting from lane closures, link closures, or temporarily reduced link capacity. Once the new traffic pattern is developed with the network-based tool, specific timing plans can be developed to make the best use of the available capacity.
The suitability classification system has the following definition in Table 2:
|
= |
Specific factor is often analyzed by the transportation modeling approach. |
|
= |
Specific factor is sometimes analyzed by the transportation modeling approach. |
|
= |
Specific factor is rarely analyzed by the transportation modeling approach. |
n/a |
= |
No examples of the transportation modeling approach being applied. |
Table 1 Work Zone Characteristics Case Study Attributes
| Case Study | Category | Modeling Approach | Project Life-Cycle Stage | Work Zone Characteristics | |||
|---|---|---|---|---|---|---|---|
| Type | Configuration | Size | Analysis Area Dimensions |
||||
| CA I-15 | Application | Sketch Planning Mesoscopic Simulation |
Planning | II | Pipe | Medium | Metropolitan |
| GNP | Application | Sketch Planning | Planning | I | Pipe | Medium | Local |
| MD-LCAP | Approach | Sketch Planning | All | II, III, IV | Pipe | Small | Local |
| MDOT-SEMSN | Approach | Microscopic | All | I, II | Grid | Large | Metropolitan |
| MI AMB | Application | Microscopic Simulation | PE/Design | I | Grid | Medium | Metropolitan |
| MI I-75 | Application | Microscopic Simulation | Planning | I | Grid | Large | Metropolitan |
| MI I-94 | Application | Microscopic Simulation | Planning | II | Grid | Medium | Metropolitan |
| NJTA-LCA | Approach | HCM | Planning, Operations | IV | Pipe | Small | Local |
| NS-Reeves | Application | Sketch Planning | Planning | III | Isolated | Small | Local |
| UT I-15 | Application | Travel Demand Model | PE/Design | I | Grid | Large | Metropolitan |
| Wisconsin | Application | Traffic Signal Optimization | Operations | III | Pipe | Medium | Local |
| WisDOT | Approach | Various | Planning | III, IV | Pipe | Small | Local |
| WWB-LA | Application | HCM | Construction | I | Pipe | Small | Site |
| WWB-RCA | Application | Sketch Planning | Construction | I | Grid | Large | Metropolitan |
| WWB-ROA | Application | Microscopic Simulation | PE/Design | I | Grid | Small | Local |
| YOS | Application | Sketch Planning | Planning | II | Pipe | Medium | Local |
| ZION | Application | Sketch Planning | PE/Design | III | Isolated | Small | Local |
Table 2 Work Zone Characteristics Factors
| Factors WORK ZONE CHARACTERISTICS | Summary |
Transportation Modeling Approach |
Case Study |
|||||
|---|---|---|---|---|---|---|---|---|
Sketch-Planning and HCM Methodologies |
Travel Demand Models |
Traffic Signal Optimization |
Macroscopic Simulation |
Mesoscopic Simulation |
Microscopic Simulation |
|||
Type |
||||||||
Type I |
Affects a large number of traveler at the regional scale, with high public interest, significant user cost impacts and a long duration. |
|
|
|
|
|
|
GNP, MI AMB, MI I-75, UT I-15 |
Type II |
Similar to Type I but moderate impact. |
|
|
|
|
|
|
CA I-15, MI I-94, YOS, MD-LCAP |
Type III |
Similar to Type I but low impact. |
|
|
|
|
|
|
NS-Reeves, ZION, Wisconsin, MD-LCAP |
Type IV |
Short-duration work zone with low visibility and public interest. |
|
|
|
|
|
|
NJTA-LCA, MD-LCAP |
Network Configuration |
||||||||
Isolated |
Single work zone with limited interaction of surrounding infrastructure. |
|
|
|
|
|
|
NS-Reeves, ZION, Wisconsin, MD-LCAP |
Pipe |
Roadway segment with multiple, interacting work zones. |
|
|
|
|
|
|
CA I-15, GNP, WWB-LCA, YOS |
Grid |
Connected, inter-dependent network structure with multiple access points and alternate routes. |
|
|
|
|
|
|
MI AMB, MI I-75, MI I-94, UT I-15, WWB-RCA, WWB-ROA |
Geographic Scale: Work Zone Size |
||||||||
Small |
A work zone implemented on a short segment of an individual roadway or a single intersection. |
|
|
|
|
|
|
NS-Reeves, WWB-LCA, WWB-ROA, ZION, MD-LCAP |
Medium |
One or more work zones on longer stretches of a single facility and/or portions of adjacent facilities. |
|
|
|
|
|
|
CA I-15, GNP, MI AMB, MI I-94, YOS, Wisconsin |
Large |
Interacting work zones implemented on significant elements of a larger roadway network. |
|
|
|
|
|
|
MI I-75, UT I-15, WWB-RCA |
Geographic Scale: Analysis Area Dimension |
||||||||
Site |
Analysis area is restricted to the immediate area surrounding the work zone. |
|
|
|
|
|
|
WWB-LCA, Wisconsin, MD-LCAP |
Local |
Analysis area includes surrounding area beyond the work zone to account for detour routes or other localized impacts. |
|
|
|
|
|
|
GNP, NS-Reeves, WWB-ROA, YOS, ZION |
Metropolitan |
Analysis area includes multiple jurisdictions(counties, cities, etc.) or facilities. |
|
|
|
|
|
|
CA I-15, MI AMB, MI I-75, MI I-94, UT I-15, WWB-RCA |
![]() = Often analyzed by the transportation modeling approach.
= Often analyzed by the transportation modeling approach. ![]() = Sometimes analyzed by the transportation modeling approach.
= Sometimes analyzed by the transportation modeling approach. ![]() = Rarely analyzed by the transportation modeling approach. n/a = No examples of the transportation modeling approach being applied.
= Rarely analyzed by the transportation modeling approach. n/a = No examples of the transportation modeling approach being applied.
2.2 Transportation Management Plan Strategies[2]
Transportation Management Plan (TMP) strategies should be considered for all work zones, but the amount of effort and resources needed to produce the TMP will depend on the construction project and the characteristics of the work zone (4). Smaller maintenance projects may utilize a simple TMP whereas a significant project that anticipates considerable traffic impacts requires a more detailed TMP. The use of a transportation modeling tool depends primarily upon the elements of the TMP. The following sections provide a discussion of the use of transportation modeling tools for the three categories of TMP strategies: Temporary Traffic Control, Public Information, and Transportation Operations.
2.2.1 Temporary Traffic Control
The TMP for all projects must contain a temporary traffic control (TTC) plan. TTC strategies include conceptual decisions on possible construction approaches, traffic control and management approaches, and time of construction. The scope of the TTC plan is dependent on the project characteristics and the traffic safety and control requirements required by the agency. The TTC plan consists of traffic control/design strategies, traffic control devices, and coordinating/ contracting/innovation.
Control Strategies — Control strategies include traffic control approaches used to accommodate travelers within the work zone area, while providing adequate access to the roadway for the required construction work to be performed. The impacts of the work zone on traffic will be dependent on the types of control strategies that are established for a project. Control strategies for temporary traffic control include those listed below. Those in bold are control strategies that could be analyzed using the transportation modeling approaches described in Section 1.1:
- Construction phasing/staging
- Full roadway closures
- Lane shifts or closures
- One-lane, two-way operation
- Two-way traffic on one side of a divided facility
- Reversible lanes
- Ramp closures/relocation
- Freeway-to-freeway interchange closures
- Night work
- Weekend work
- Work hour restrictions for peak travel
- Pedestrian/bicycle access improvements
- Business access improvements
- Off-site detours/use of alternate routes
All of the control strategies can be analyzed using various modeling approaches. The decision to use a certain modeling approach is often based upon the stage in the project life-cycle. For example, the decision to use a certain construction technique requiring full roadway closure may rest upon whether or not the identified detour routes can handle the increased volume. In this case, the ability to use certain tools will be constrained by the decision to be made. Often, the use of a specific control strategy will be decided early in the decision-making process based upon a specific DOT policy either encouraging or disallowing a certain strategy.
Currently, the most prevalent modeling approaches used by analysts include sketch-planning/HCM methodologies, mesoscopic simulation, and microscopic simulation tools. The tradeoff between these modeling approaches lies within the level of detail required and resources available. Microscopic and mesoscopic simulation tools can provide detailed analysis to evaluate detailed control strategy alternatives for the work zone. However, the resources and data requirements are significant. For example, an analyst may be required to determine allowable times for partial lane closures for a significant construction project during the PE/Design stage. Overall accuracy may be an important component to the overall cost of the construction project. In this case, a detailed modeling tool, such as microscopic simulation, may be warranted to provide the detailed analysis. However, time constraints may limit the analysis period to less than two weeks thus the use of a sketch-planning tool may be the best option. In the end, the modeling tool utilized may be determined in large part by the control strategy(ies) to be assessed and the ability of the modeling tool to provide useful results.
| Michigan DOT: Ambassador Bridge Gateway MOTSIM |
|---|
MDOT’s Metro Region has a network simulation of an interstate freeway closure for the Ambassador Bridge Gateway Project (2008-2009). Mobility plans were developed and implemented. A second model was run to incorporate other planned lane closures during the summer of 2008, and as expected the combined effects of the multiple closures undermined the original mobility plan. A third model for closures during the summer of 2009 is planned. However, in neither case were the 2008 and 2009 models ready in time to inform the project selection decisions. While these models are useful in allowing MDOT to tweak the TMP of the Gateway Project, they would have been much more useful if they had been performed in time to influence the project selection and the TMPs of the other projects. More information can be found in the Michigan DOT: Southeastern Michigan Simulation Network case study. |
Traffic Control Devices — Traffic control devices used for temporary traffic control plans need to follow Part 6 of the Manual on Uniform Traffic Control Devices (MUTCD). The MUTCD provides standards and guidelines for utilizing traffic control devices within a work zone. In addition, other information is provided for installing, maintaining, and operating the work zone traffic control devices. The traffic control devices are applicable to all types of construction projects from small maintenance projects to significant construction projects. Traffic control devices utilized within work zones for temporary traffic control include those listed below. Those in bold are traffic control devices that have been analyzed using the transportation modeling approaches described in Section 1.1:
- Temporary signs
- Changeable message signs
- Arrow panels
- Channelizing devices
- Temporary pavement markings
- Flaggers and uniformed traffic control officers
- Temporary traffic signals
- Lighting devices
Three of the eight traffic control devices can be analyzed using various modeling approaches. Signing and marking cannot be analyzed with work zone analysis tools since the tools are based upon traffic flow theory. Thus, variables associated with the number of lanes open to traffic, lane width, free-flow design speed, percent trucks, etc. can be evaluated. In practical terms, the analyst can determine the impacts of using changeable message signs to convey traveler information, using flaggers for traffic control, and the use of temporary traffic signals:
- There are a handful of tools that can analyze the capacity of flagging operations.
- Traffic signal optimization tools are designed to analyze signal timing (permanent or temporary).
- There are many generic and specialized tools that can model reductions in the number of lanes and/or reduction in the capacity of the individual lanes.
Depending on other work zone characteristics, traffic control devices can be analyzed using the full spectrum of modeling approaches. Often, the selection of these devices will be made later in the project life-cycle, making it more likely that a previous modeling effort has taken place. Thus, an analyst may be able to leverage previous efforts. The ultimate decision to use one approach over the other will depend upon the resources available and the specific traffic control device to be included and whether the modeling approach is able to produce useful results.
| Glacier National Park |
|---|
The Going to the Sun Road in Glacier National Park was slated for an extensive multi-year rehabilitation project over a seven to eight year period. Since the Going to the Sun Road is a key reason for visiting Glacier National Park and has no alternative route, the roadway must remain open throughout the project to both allow access to facilities and serve as a scenic roadway with minimal disruption and delay for park visitors. The development of the TMP included temporary traffic signals. It is typical practice on the Going to the Sun Road to use a fixed timing plan for the control of short work zones and to vary the fixed timing plan over the course of the day for longer work zones. In the Glacier case study, analysts investigated a complete range of control options for the temporary traffic signals from the simplest (single fixed plan) to the most complex (all actuated) and estimated how likely the 30 minute maximum user delay threshold might be exceeded over the life of the rehabilitation project. Base signal timing in this case study represents a single fixed plan used in the night and weekend periods when flaggers are not present. A sketch-planning analysis tool was used to identify projected delays and queue length over the course of the project and to assess the likely effects of actuated signal control for 2-way, 1-lane operations, as well as the impact of reduced travel demand. More information can be found in the Glacier National Park: Going to the Sun Road Rehabilitation Project case study. |
Coordination/Contracting/Innovation — Project coordination strategies have the potential to reduce the mobility and safety impacts of the work zone. Contracting strategies involve agreements to reduce project duration and traffic impact. Innovative construction strategies include construction techniques that speed up the construction process to complete the project in a shorter period of time. Project coordination strategies include coordinating with other projects, utilities and right-of-way coordination, and coordination with other non-highway transportation facilities such as railroads and transit. Contracting strategies include design-build contracting, A+B bidding to reduce construction time, incentive/disincentive clauses, and lane rental—assessing a fee to the contractor for the time the lane is unavailable to traffic. Innovative construction techniques could include quick curing concrete or using precast items to minimize traffic restrictions and allow roadways to be reopened sooner.
Traffic impact analysis as it relates to coordination, contracting, and innovative construction strategies is more difficult to directly model using any of the transportation modeling approaches. If the agency has identified several projects that should be coordinated due to the potential of network-wide effects, then using a microscopic or mesoscopic simulation tool that can model all the projects would be a useful task to determine the traffic impacts overall. The analysis could possibly identify collaboration among projects that could be beneficial for the agency. Both contracting strategies and innovative construction strategies that result in shorter construction periods should be modeled to identify the most efficient approaches. There are some travel demand models and macroscopic models that might provide outcomes that would satisfy the agency's requirements to identify the impact of the work zone that may not be as resource intensive.
An important component to coordination, contracting and innovative construction strategies is the incorporation of road user costs. There are three main categories of road user costs: delay (extra travel time caused by the construction), vehicle operating costs (extra fuel consumed by detouring to a longer route) and safety (increased risk of crashes caused by detouring onto a road built to lower standards). By computing the road user costs associated with each alternative, it becomes straightforward to do a trade-off analysis. For example, one might find that building a project using the “standard” construction method has a direct cost to the agency of $1 million and creates $3 million of indirect costs to road users. However, the “quick” construction method has a direct cost of $1.2 million and reduces the impact on road users to $2 million. In that case, one could say that spending an extra $200,000 of the agency’s money results in $1 million of savings to road users, a 5:1 benefit/cost ratio.
CALTRANS I-15 Rehabilitation Project The existing four mile section of I-15 in Ontario, California consists of four to six lanes in each direction and the reconstruction will rebuild two to three truck lanes in each direction. The project analysis was divided into two phases.
- Phase I used an innovative sketch-planning tool to evaluate a number of "what if" scenarios to identify solutions to balance schedule production, traffic inconvenience, and agency costs. This tool could also be easily integrated with other traffic simulation tools to quantify road user costs during construction.
- During Phase II, a mesoscopic simulation analysis was performed on the network to assist in the development of the TMP.
Caltransused a variety of analysis tools to address different construction strategies and was able to use the results from these tools to help prepare an overall cost estimate analysis. More information can be found in the Caltrans I-15 Pavement Reconstruction Project case study.
2.2.2 Public Information
Many construction projects, especially those that will result in significant impact to the traveling public will benefit from including a public information component in the Transportation Management Plan. For significant projects, public information is a required component of a TMP. Providing specific information to the public that alerts them to potential impacts due to construction and associated work zones can help drivers make informed choices on when to travel to avoid construction or delays associated with construction or when to take alternate routes to avoid construction altogether. Keeping the public informed throughout the duration of the project will help an agency identify potential impacts and ensure effective mitigation strategies are implemented. Agencies should coordinate with their public information office in the early stages of project development. Public information strategies include both public awareness and motorist information strategies.
| Woodrow Wilson Bridge Replacement |
|---|
The replacement of the Woodrow Wilson Bridge (WWB), along Interstate 95 in the Metropolitan Washington, DC area, is an extremely large and complex construction project. The current 6-lane bridge is being replaced with a dual-span bridge that will more than double the number of traffic lanes. The WWB team relied upon an extensive public information campaign that included both public awareness strategies and motorist information strategies, to inform users of the bridge about planned, upcoming, and on-going construction activities As part of their effort to inform users, WWB personnel employed the use of sketch-planning tools to estimate potential queuing and delay associated with several high-profile and extended weekend roadway closures. The results of the sketch planning tool (after initially being verified with smaller lane closure events) were disseminated to the public via various media sources and were designed to encourage travelers to avoid the area during the certain periods. More information can be found in the Woodrow Wilson Bridge Reconstruction case study. |
Public Awareness Strategies — Public awareness strategies include different methods to educate and reach out to the public and the community pertaining to upcoming construction projects and related work zones. The agency should develop strategies that can continually be updated throughout the duration of the project. There are many strategies available to provide public awareness which include the following:
- Brochures and mailers
- Press releases and media alerts
- Paid advertisements
- Public information center
- Telephone hotline
- Planned lane closure Web site
- Project Web site
- Public meetings and hearings
- Community task forces
- Coordination with media/schools/businesses/emergency services
- Work zone education and safety campaigns
- Work zone safety highway signs
- Rideshare promotions
- Visual information (videos, slides, presentations) for meetings or for web-based dissemination.
None of these public awareness strategies have been directly assessed using a modeling approach. While some of these strategies (e.g., coordination with media, press releases) are low cost or even free, some of these strategies (e.g., paid advertising) can be costly to implement and are typically associated with major projects. More significant projects in large metropolitan areas will require an intense public awareness campaign, while projects with relatively low impacts will rely on less expensive public awareness strategies that utilize existing outreach mechanisms (e.g., DOT website) and other media. While no single tool can directly model these strategies, many modeling approaches are able to be used to conduct “what if” scenarios to determine what level of demand reductions are necessary to ensure mobility measures are met. A realistic estimate of the travel demand reduction (either through changing when a trip occurs, what mode is used or canceling a trip altogether) is an essential input for most work zone analyses tools. For example, in the Milwaukee area, recent experience indicates that major freeway reconstruction projects result in 30 to 40% reduction in peak hour demand. If we analyzed our Milwaukee freeway work zones without taking this into account, we would severely over-predict the impacts of the construction. In this situation, ex-post studies documenting demand reductions associated with completed projects using one or more of the strategies could be compared with the model outputs.
Motorist Information Strategies — Motorist information strategies focus on providing real time traveler information to travelers regarding the project work zone. Examples of motorist information strategies include those listed below. Those in bold are motorist information strategies that have been analyzed using the approaches described in Section 1.1:
- Traffic radio
- Changeable message signs
- Temporary motorist information signs
- Dynamic speed message signs
- Highway advisory radio
- Extinguishable signs
- Web-based highway information network
- 511 traveler information systems
- Freight travel information
- Transportation Management Centers
Four of the 10 motorist information strategies have been analyzed using one of the modeling approaches. Generally, these analyses focused on the general use of traveler information (e.g., via en-route signs, cell phones, or pre-trip information from a web-site). Also, these analyses have been significant efforts using mesoscopic and microscopic simulation tools to model motorist information strategies such as dynamic message signs to determine the impact these strategies could have on traveler diversions either through or around work zone and surrounding area.
2.2.3 Transportation Operations
Transportation operations strategies include improved transportation operations and management of the transportation network to help mitigate work zone impacts. Transportation operation strategies include demand management, corridor/network management, work zone safety management strategies, and traffic/incident management and enforcement strategies. For significant projects, transportation operations is a required component of a TMP.
Demand Management Strategies — Demand management strategies use techniques that are intended to reduce the volume of traffic that travels through a work zone by encouraging the motorist to consider when and how they travel. Examples include diverting motorists to alternate modes of travel, shifting motorists to alternate routes, and encouraging off-peak travel trips. Demand management strategies include those listed below. Those in bold are demand management strategies that have been analyzed using the transportation modeling approaches described in Section 1.1:
- Transit service improvements
- Transit incentives
- Shuttle services
- Ridesharing/carpooling incentives
- Park and ride promotion
- High occupancy vehicle lanes
- Tolling/congestion pricing
- Ramp metering
- Parking supply management
- Variable work hours
- Telecommuting
Four of the 11 demand management strategies have been analyzed using one of the modeling approaches. Demand management strategies are usually reserved for large construction projects that have a lengthy duration because most of these strategies deal with altering the motorists travel behavior. However, it is often difficult to predict the impact that demand management strategies, such as transit service improvement, will have on roadway user behavior since changes to overall demand are estimated separately, with the analyst identifying likely impacts from a range of potential responses based upon other work zone performance assessments. Thus, the work zone analysis tends to provide the decision maker with a range of potential impacts based upon previous results.
Previous efforts to model these strategies have included the entire spectrum of modeling approaches except for traffic signal optimization. However, the level of detail provided by these various approaches varies significantly. Sketch-planning tools may be able to model the impact of improved transit service on overall traffic volume, but this is likely to be an external calculation (increased transit mode split) which is then entered into the model. The fidelity associated with travel demand models (due to their ability to analyze large geographic areas) limits their ability to provide detailed impacts of demand management strategies specific to the work zone site. Mesoscopic and microscopic simulation tools are better able to provide the level of detail necessary to account for the impact of all four demand management strategies but require a greater amount of detail and fine-tuning.
In the realm of transportation economics, models have been developed to estimate the impacts of all of the transportation policy changes listed above. STEAM (Surface Transportation Efficiency Analysis Model) and STM (Strategic Transport Model) are two examples. These models typically use cross-elasticities to estimate demand for certain policy instruments (e.g., mode shift to HOV, transit, or HOT lanes). For example, if carpooling incentives are implemented, the models estimate the resulting reductions in the number of solo drivers. Some travel demand forecasting packages also incorporate these techniques to some extent. The output from these economic models could be used to adjust the travel demand for the work zone analysis.
Corridor/Network Management Strategies — Corridor and network management strategies are used to optimize traffic flow through the work zone corridor and adjacent roadways using various traffic operations techniques and technologies. Corridor and network management strategies include those listed below. Those in bold are corridor/network management strategies that have been analyzed using the transportation modeling approaches described in Section 1.1 :
- Signal timing and coordination improvements
- Temporary traffic signals
- Street and intersection improvements
- Bus turnouts
- Turn restrictions
- Parking restrictions
- Truck and heavy vehicle restrictions
- Separate truck lanes
- Reversible lanes
- Dynamic lane closure systems
- Ramp metering/temporary suspension of ramp metering
- Ramp closures
- Railroad crossing controls
- Coordination with adjacent construction sites
Ten of the fourteen corridor/network management strategies have been analyzed using one of the modeling approaches. Corridor and network management strategies can be very effective in improving traffic flow through and around a work zone. The full spectrum of modeling approaches can be used to model these strategies with microscopic simulation being a typical modeling approach that analysts employ when evaluating these strategies. Other tools, including sketch-planning, may be useful for better understanding the impact of adjacent construction projects.
Often, these network-based strategies and the use of a modeling approach will require that institutional barriers be broken down. For example, some agencies may already be using traffic signal optimization tools and can work with the planning division to develop alternate route optimization scenarios or to optimize the addition of temporary traffic signals in the system as part of a work zone. This will likely require coordination efforts between the traffic engineering, planning, and construction divisions within the agency and possibly even with some outside agencies (e.g., state construction project within a city jurisdiction for signal timing). Good working relationships and communication between the divisions and the agencies will improve efforts to optimize traffic flow through the work zone. These types of agency interactions will be discussed later in this chapter.
Work Zone Safety Management Strategies — Work zone safety management strategies address traffic safety concerns in work zones by analyzing devices, features, and management procedures. Work zone safety management strategies include those listed below. Those in bold are work zone safety management strategies that have been analyzed using the transportation modeling approaches described in Section 1.1:
- Speed limit reduction and variable speed limits
- Temporary traffic signals
- Temporary traffic barriers
- Moveable traffic barrier systems
- Crash-cushions
- Temporary rumble strips
- Intrusion alarms
- Warning lights
- Automated flagger assistance devices
- Project task force and committees
- Construction safety supervisor and inspectors
- Road safety audits
- TMP monitor and inspection team
- Team meetings
- Project on-site safety training
- Safety awards and incentives
- Windshield surveys
While work zone management strategies are considered significant strategies in the success of a construction project, the application of modeling approaches are infrequently applied to evaluate the impact of these strategies on the work zone area. Generally speaking, modeling tools are not directly applicable to evaluating the impact these strategies have on the work zone area. These strategies cannot be directly modeled to determine the impact the work zone will have on the surrounding area; however they are required to some degree on all construction projects. There are some specialized safety analysis tools available to analysts (e.g., QUADRO, Safety Analyst, SafeNet, and Road Safety Risk Manager) but these generally do not address the specific work zone safety strategies listed here.
The safety analysis module in Quadro is designed specifically for work zone applications. It contains an internal database of the average number of crashes per mile traveled for various facility types, with and without construction. This information is used to compute the expected number of crashes in the work zone (the probability that there will be a crash). Quadro also converts this to a monetary value by multiplying by the expected increase in crashes by the average comprehensive cost of a crash. Using this method, the analyst can prepare a broad comparison of the relative safety of two construction alternatives.
Traffic/Incident Management and Enforcement Strategies — Traffic and incident management and enforcement strategies include many techniques to manage the traffic operations of the work zone. Work zone traffic management strategies entail monitoring prevailing traffic conditions and making adjustments to traffic operations as necessary. Traffic incidents during construction are situations where specific management strategies are useful to minimize the exacerbation of other work zone impacts. Incident management and enforcement strategies involve improved detection, verification, response, and clearance of crashes, mechanical failures, and other incidents in work zones and on detour routes. Traffic and incident management and enforcement strategies include those listed below. Those in bold are traffic and incident management and enforcement strategies that have been analyzed using the transportation modeling approaches described in Section 1.1:
- ITS for traffic monitoring and management
- Transportation management centers
- Surveillance [Closed-Circuit Television (CCTV), loop detectors, lasers, probe vehicles]
- Helicopter for aerial surveillance
- Traffic screens
- Call boxes
- Mile-post markers
- Safety service patrols
- Total station units
- Photogrammetry
- Coordination with media
- Local detour routes
- Contract support for incident management
- Incident and emergency management coordinator
- Incident and emergency response plan
- Dedicated police enforcement – paid by project
- Cooperative police enforcement
- Automated enforcement
- Increased penalties for work zone violations
Traffic and incident management and enforcement strategies are significant to the success of a construction project; however, transportation analysis tools are infrequently used to assess the impact of these strategies on the work zone area. The full spectrum of modeling approaches (except traffic signal optimization models) may be applicable to evaluating traffic/incident management and enforcement strategies that the agency could consider; however, most of these strategies cannot be directly modeled to determine the impact the work zone will have on the surrounding area. Generally, the analysis is limited to conducting “what if” scenarios. One exception is the use of safety service patrols where both sketch-planning and more complex tools have been used to assess the impact of reduced clearance time on work zone performance measures such as delay.
Table 3 provides a summary of the transportation modeling approaches that have been historically used to evaluate various TMP strategies. The suitability classification system has the following definition for Table 3:
|
= |
TMP components have often been evaluated by the transportation modeling approach. |
|
= |
TMP components have sometimes been evaluated by the transportation modeling approach. |
|
= |
TMP components have rarely been evaluated by the transportation modeling approach. |
n/a |
= |
No examples of the transportation modeling approach being used to evaluate TMP components. |
Table 3 TMP Strategy Factors
| Factors TMP Strategies | Summary | Transportation Modeling Approach | Case Study | |||||
|---|---|---|---|---|---|---|---|---|
| Sketch-Planning and HCM Methodologies | Travel Demand Models | Traffic Signal Optimization | Macroscopic Simulation | Mesoscopic Simulation | Microscopic Simulation | |||
| Temporary Traffic Control | ||||||||
| Control Strategies | Traffic control approaches used to accommodate road users within the work zone and adjoining corridor in an efficient and safe manner. | Michigan DOT: Ambassador Gateway Bridge MOTSIM Caltrans I-15 Pavement Reconstruction Project |
||||||
| Traffic Control Devices | Use of signs, panels, pavement markings, signals and lighting devices for temporary traffic control | n/a | Glacier National Park: Going to the Sun Road Rehabilitation Project | |||||
| Coordination/Contracting/Innovative Construction Strategies | Project coordination, contracting strategies and construction techniques to improve work zone operations. | n/a | Caltrans I-15 Pavement Reconstruction Project Utah DOT I-15 Reconstruction Design-Build Evaluation | |||||
| Public Information | ||||||||
| Public Awareness Strategies | Methods to educate and reach out to the public, businesses and community concerning the road project and work zone. | n/a | n/a | n/a | n/a | Woodrow Wilson Bridge Replacement | ||
| Motorist Information Strategies | Provision of current/real-time information to road users regarding the project work zone. | n/a | n/a | n/a | Woodrow Wilson Bridge Replacement | |||
| Transportation Operations | ||||||||
| Demand Management Strategies | Techniques intended to reduce the volume of traffic traveling through the work zone. | n/a | Woodrow Wilson Bridge Replacement | |||||
| Corridor/Network Management (traffic operations) Strategies | Strategies to optimize traffic flow through the work zone corridor and adjacent roadways | n/a | Michigan DOT: Ambassador Gateway Bridge MOTSIM | |||||
| Work Zone Safety Management Strategies | Devices, features, and management procedures used to address traffic safety concerns in work zones. | n/a | n/a | n/a | n/a | Utah DOT I-15 Reconstruction Design-Build Evaluation Wisconsin DOT: Transportation Management Plan Development Process |
||
| Traffic/Incident Management and Enforcement Strategies | Strategies to manage work zone traffic operations. | n/a | ||||||
![]() = TMP components have often been evaluated by the Transportation Modeling Approach.
= TMP components have often been evaluated by the Transportation Modeling Approach. ![]() = TMP components have sometimes been evaluated by the Transportation Modeling Approach.
= TMP components have sometimes been evaluated by the Transportation Modeling Approach. ![]() = TMP components have rarely been evaluated by the Transportation Modeling Approach. n/a = No examples of the Transportation Modeling Approach being used to evaluate TMP components.
= TMP components have rarely been evaluated by the Transportation Modeling Approach. n/a = No examples of the Transportation Modeling Approach being used to evaluate TMP components.
2.3 Data
One of the most important factors when deciding to use a transportation modeling approach to assess work zone impacts is the availability and quality of data regarding the project. Regardless, any work zone impact analysis will be a balance between the type of data that are needed, where the data come from, and the quality of the data. Often, an analyst will also have to account for the project development phase and, ultimately, the required precision of the results[3].
2.3.1 Type
Important elements to work zone analysis are data describing the roadway network, the traffic on the roadway network, and cost variables such as value of time and construction costs. The extent to which these data are needed depends upon both the stage of the project life-cycle and the modeling approach being used. The roadway characteristic data are generally easily available; the most difficult being the availability of signal timing plans. Travel demand characteristics are more difficult to obtain and there are no hard and fast rules regarding the use of this data when using a transportation modeling approach except that, in general, the more accurate the data the more accurate the results regardless of the modeling approach being used.
Roadway Characteristics — These data can be thought of as describing the roadway network infrastructure such as physical attributes (lane configuration, intersection location, traffic signal location, alternate routes, etc.) and policy attributes (estimated roadway capacity, signal timing plans, etc.). Together, these attributes are required in order to create the necessary network that the model will use to generate results. Most models and analysis tools will require some form of roadway characteristic data. The type and amount of data will vary by which tool is selected. Roadway characteristic data can usually be collected from construction drawings, field surveys, aerial photographs or geographic information system files. This data is usually sufficient for sketch-planning models, traffic signal optimization, and macroscopic and mesoscopic modeling. For microscopic modeling, to improve the accuracy of the information, the analyst may want to verify the roadway characteristics with field data.
Travel Demand Characteristics — These data describe how the roadway network infrastructure is utilized by the user. This would include traffic counts, vehicle demand data, and transit data if applicable. Travel demand characteristics pertain to vehicle and traffic demand data needed to assess the impact of the work zone. Traffic counts, vehicle mix, delay data, transit data, origin-destination data, etc. are the types of travel demand data that will be required to prepare an assessment model of the work zone. Like roadway characteristic data, all the models and analysis tools discussed in this report will need some form of travel demand characteristic data. The tools chosen will determine to what extent data is needed. Sketch-planning and HCM methodologies will require less data requirements, whereas macroscopic, mesoscopic, and microscopic simulation models may require more data. As stated previously, the more site-specific data provided, and the more accurate the data, the better the results of the model. If site-specific data is unavailable and the resources to collect travel demand data are not available, there are sources that can provide default values for some of these parameters. Many of the models and tools themselves will include default variables to be used in situations where data is not available. Using default data should be done cautiously, as the default values may not reasonably approximate the site-specific conditions.
Cost Attributes — These data include parameters such as the value of time for different vehicle classes (passenger cars and trucks), the cost for different construction alternatives, and the effects on revenue that local businesses might incur due to the work zone. There are a few analysis tools that use the sketch-planning or mesoscopic approach and can input different cost attributes to evaluate the value of time and cost of the impact the work zone will have on the surrounding environment. These attributes include the revenue from a local business that might be impacted by the construction zone, or the cost and time of vehicles or trucks that have to alter their schedules and routes because of the work zone, among other factors.
2.3.2 Source
There are many sources of data related to a work zone analysis. In general, these data sources are separated into two categories: primary and archived.
Primary — Primary sources of data include any number of data collection techniques whereby traffic data counts are collected in the field either using automated sensors such as video cameras, electronic toll collection (ETC) transponders, loop detectors, station counters, etc. Models that require field traffic counts for analysis are traffic signal optimization and mesoscopic and microscopic simulation. The more recent the data collection is performed, the more accurate the modeling results will be. Primary sources of data also include any number of analytical models available to an analyst from previous studies or other agencies such as a regional planning organization.
| Yosemite National Park: Yosemite Village Roadway Reconstruction |
|---|
The Federal Lands Highway Division used a combination of archived data and field traffic counts for the analysis of the Yosemite Village Roadway Reconstruction. FLH engineers conducted a first-cut distribution of hourly and daily travel demand factors obtained from a 1998 traffic study. These values were combined with two-short term collection activities to refine the hourly and daily distributions and establish a rate of travel demand growth from 1998-2004. The field traffic counts were conducted using portable traffic counters which are available agency-wide within FLH. More information can be found in the Yosemite National Park: Yosemite Village Roadway Reconstruction case study. |
Archived — Archived data is used most often in sketch-planning and HCM transportation modeling approaches. Depending on the analysis tool chosen and the required accuracy of the results, it can also be used to some degree by travel demand models, traffic signal optimization models, and macroscopic, mesoscopic, and microscopic simulation models. There are many sources of archived data including public entities such as a regional planning organization or departments in a transportation agency as well as commercial vendors. Using archived data can be a cost effective solution to conducting a work zone analysis if limited resources are available or a quick decision needs to be made.
| New Jersey Turnpike Authority: Lane Closure Application |
|---|
Based upon HCM methodologies, the New Jersey Turnpike Authority Lane Closure Application relies on archived data in order to conduct analyses. Typically, these data are between one to two months old. More information is available in the New Jersey Turnpike Authority: Lane Closure Application case study. |
2.3.3 Quality
An important component to using data is the quality of the data. The purpose of using data (be it primary or archived) is to prepare models that best represent actual field conditions resulting in an analysis producing the most accurate results possible. Primary data can often provide the most valuable data for modeling; however, collecting this data is resource intensive and costly. Many analyses for work zone planning purposes are conducted without this type of resource intensive primary data collection. In the case of significant Type I work zones that will affect a large number of travelers for long durations, field data collection may be beneficial to evaluate the work zone impacts more accurately. An analyst can benefit from visual observation because they can identify behavior in the field that is not as obvious in other data collection methods. This allows the analyst to adjust the model to better reflect existing conditions and improve the results when modeling for work zone implementation. In general, the analyst is concerned with the following four characteristics regarding the quality of the data: collection frequency, geographic coverage, archive length, and accuracy.
Collection Frequency — Collection frequency describes how often data is collected. This is important based upon the type of work zone being analyzed and the project stage. Work zone analyses occurring in the planning and design stage may need sample data collected only once in order to characterize daily travel demand or hourly roadway capacity to support a high-level decision about work zone scheduling. Projects in the construction stage may need data that is collected more frequently (e.g., traffic counts or travel times at five-minute intervals) to assess model outputs.
Geographic Coverage — An important consideration of data quality is the extent to which data is available for a specific location or region. Depending upon the location of the work zone, traffic data may not be available for a certain location (e.g., rural interchange or intersection). In these situations representative data may need to be used from other sources. Also, larger Type I work zones may need to have data available that encompasses an entire region rather than only surrounding the immediate vicinity of the work zone.
Archive Length — Archive length is concerned with the extent to which historical/archived data is available to an analyst. The length of the archive is important when temporal variations need to be considered as part of the work zone analysis. For example, work zones with a long durations occurring over multiple construction seasons will need to account for seasonal fluctuations in traffic demand as part of the analysis. Also, analysts considering the timing of a construction project in terms of taking place now or over the next five years will need to estimate the change in traffic demand over a number of years in order to project out future travel demand.
Accuracy — Accuracy is concerned with comparing outputs of the model with real-world conditions and the requirements of the analyst such that the model can be validated. In other words, what are the tolerances of the model? In some cases, such as a high-level analysis during the planning stage, a rough order of magnitude or directionality is sufficient. However, a work zone analysis occurring during the construction stage may require higher accuracies such that the analyst can estimate queue formation every 15 minutes. Accuracy will depend not just on the project stage but the measure of effectiveness as well. An analyst should always strive to identify and utilize accurate data. The key point with respect to understanding the inherent accuracy of a data source is to understand the level to which one can accurately apply the data. For example, a multi-year dependable archive of sample traffic counts taken a few times each year may be a useful and accurate source of data for estimating rough seasonal trends. However, these data may not be accurate enough to support a peak recurrent delay estimate for a specific day not in the sample set.
Woodrow Wilson Bridge Replacement |
|---|
The WWB project was concerned with all four aspects of data quality as part of several of the modeling projects. For the microscopic simulation analysis, previous field observations were used to help calibrate the model. In the case of using the sketch-planning tool for the first time, engineers ran the model to estimate queuing and delay and then verified those results in the field by observing the actual queue length and driving the work zone to measure travel times and determine delay. The initial field observations were used to ensure the model was calibrated correctly for future use. More information can be found in the Woodrow Wilson Bridge Replacement case study. |
Table 4 provides a summary of the three categories of data factors associated with work zone modeling. Type provides an assessment of the level of detail historically used for each of the three data types: Roadway Characteristics, Travel Demand Characteristics and Cost Attributes. The suitability classification system has the following definition:
|
= |
High level of detail historically used as part of the transportation modeling approach. |
|
= |
Medium level of detail historically used as part of the transportation modeling approach. |
|
= |
Low level of detail historically used as part of the transportation modeling approach. |
n/a |
= |
Data type is not typically used as part of the transportation modeling approach. |
Table 4, under the heading Source, provides a summary of the sources of data commonly used for each of the transportation modeling approaches. The suitability classification system has the following definition:
|
= |
Data source is commonly used for the transportation modeling approach. |
|
= |
Data source is not commonly used for the transportation modeling approach. |
Table 4, under the heading Quality, provides an assessment as to the overall quality required for each of the quality aspects (collection frequency, geographic coverage, archive length, and accuracy). In all cases, it is important that the data available be of high quality such that the outputs of the model are useful in supporting the decisions being made.
Table 4 Data Factors
Factors DATA |
Summary |
Transportation Modeling Approach |
Case Study |
|||||
|---|---|---|---|---|---|---|---|---|
Sketch-Planning and HCM Methodologies |
Travel Demand Models |
Traffic Signal Optimization |
Macroscopic Simulation |
Mesoscopic Simulation |
Microscopic Simulation |
|||
Type
|
||||||||
Roadway Characteristics |
Information regarding the physical design and operational characteristics of the roadway to be modeled. |
|
|
|
|
|
|
New Jersey Turnpike Authority: Lane Closure Application |
Travel Demand Characteristics |
Information regarding vehicle and traffic demand associated with a roadway segment or system beginning analyzed. |
|
|
|
|
|
|
Utah DOT I-15 Reconstruction Design-Build Evaluation |
Cost Attributes |
Value of time for various vehicles classes (passenger cars and trucks) as well as revenue for local businesses impacted by roadway construction. |
|
|
n/a |
|
|
|
Caltrans I-15 Pavement Reconstruction Project |
Source
|
||||||||
Primary |
Roadway detection, probe vehicle, floating cars, ETC, analytical models (e.g., regional travel demand models), etc. |
|
|
|
|
|
|
Yosemite National Park: Yosemite Village Roadway Reconstruction Woodrow Wilson Bridge Replacement |
Archived |
Using historic/archived traffic data available from planning agencies, transportation agency, or commercial vendors (e.g., traffic.com). |
|
|
|
|
|
|
New Jersey Turnpike Authority: Lane Closure Application |
Quality
|
||||||||
Collection Frequency |
How often data is collected. |
|
|
|
|
|
Woodrow Wilson Bridge Replacement |
|
Geographic Coverage |
Extent to which data is available for a specific region or location. |
|
|
|
|
|
|
Woodrow Wilson Bridge Replacement |
Archive Length |
Extent to which historical/archived data is available. |
|
|
|
|
|
|
Woodrow Wilson Bridge Replacement |
Accuracy |
Comparing model results with actual conditions to validate model. |
|
|
|
|
|
|
Woodrow Wilson Bridge Replacement |
2.4 Agency Resources
Developing an analytical approach will be strongly dependent upon the resources the transportation agency has available and dedicates to these analyses. These resources can be categorized as institutional arrangements within the organization that enable or hinder the flow of information; technical staff that are able to conduct the required analysis and/or data collection; funding to acquire the technical expertise or models; and scheduling requirements. All four of these agency resource categories play an important role when making a determination to deploy a transportation modeling approach.
2.4.1 Institutional Arrangements
The Work Zone Safety and Mobility Rule is characterized by a policy-driven focus to institutionalize work zone processes and procedures, with specific provisions for application at the project-level (3). This may mean involving additional agencies in the Planning, PE/Design, and Construction of roadway projects. Each agency needs to recognize that the traveling public is not concerned about lines on the map, but about moving quickly, safely, and efficiently through the network. Therefore, transportation officials need to focus on this system-level result.
For example, operational personnel at successful traffic management centers have found innovative ways to overcome institutional and technical limitations to maintain traffic incident management coordination. By developing small personal groups, a trust is established that permeates throughout the corresponding organizations. The co-location of agencies within an incident management center helps to strengthen the interagency relationships.
While there are many transportation and planning agencies which have developed comprehensive institutional arrangements regarding the use of travel demand modeling for short and long range planning, similar examples for work zone analysis are not all that common. Many of the Type I work zones (Mega Projects) have in place a mechanism to deploy the use of a transportation modeling approach as part of the overall project delivery process. Often, work zone analysis will be included. However, the smaller-scale projects such as Type II, III, and IV work zones do not necessarily include a budget for transportation modeling, let alone work zone analysis.
Often, the lack of an integrated or strategic methodology for work zone analysis can be characterized by four key institutional barriers:
- Culture — There exists within many transportation agencies a culture of compartmentalization whereby planners do not interact with designers who do not interact with operations personnel. In order for work zone impacts to be accounted for during the entire project life-cycle, these barriers need to be broken for a continuous flow of information and data.
- Leadership — Leaders are important to ensuring the successful deployment and use of transportation analysis tools for work zone analysis. Often, successful examples of work zone analyses will focus upon a single individual who took it upon themselves to change an organization’s culture or institutional arrangements to enable the use of work zone analysis throughout the project life-cycle.
- Data Management — Because of the compartmentalization of many transportation agencies, it is sometimes difficult to acquire the necessary data. Often, an analyst will have to go to multiple departments or organizations in order to get the data (e.g., operations, planning, transit).
- Contracting — As discussed below, acquiring the technical expertise to conduct a work zone analysis may require the use of contractors with specialized knowledge and tools. Agencies will need to have in place flexible contracting arrangements (such as contractors on-call) whereby services can be obtained quickly and easily.
Working together to overcome institutional challenges and carefully planning and managing the challenges can provide significant benefits for all agencies involved. The benefits of establishing a strategic methodology for work zone analysis are much greater than what could be achieved through the deployment of a number of components operating in isolation. For example, deploying the use of a transportation modeling approach for work zone analysis early in the project life cycle (such as the Planning stage) can engage key players and stakeholders such that if future work zone analysis is needed later to answer questions on lane closures during the Construction stage, results can be generated quickly and cost effectively.
Michigan DOT: Southeastern Michigan Simulation Network |
|---|
As part of developing the Southeastern Michigan Simulation Network (SEMSIN) Michigan DOT’s Metro Region addressed many of the institutional barriers discussed above. As part of creating Regional Mobility Teams, the culture of the organization changed whereby planners, traffic engineers, and safety personnel now consistently work together to address mobility within work zones throughout the project life-cycle. Also, as part of creating the SEMSIN, a wealth of modeling data resources were discovered and are now readily available to any agency personnel for future use. The successful creation of the SEMSIN can be traced back to a single person who worked for its implementation and use. More information on the development of SEMSIN can be found in the Michigan DOT: Southeastern Michigan Simulation Network case study. |
2.4.2 Technical Staff
A critical component to the successful use and deployment of work zone modeling tools is the technical expertise to use them. Often, transportation agencies will have either in-house expertise regarding the use of a specific model or access to a consultant with the expertise through a contractual arrangement. In this situation, an agency may be limited to a specific model based upon the technical capability at hand. For example, many transportation agencies make a decision to use modeling products from a specific vendor. In this case, if an agency/analyst wanted to use a different modeling tool that is not available from the vendor, additional time and resources would need to be made available in order to acquire and run the model. Even if an outside contractor is used to conduct the analysis, the transportation agency will still need to have enough expertise on-hand in order to oversee and validate the work zone analysis findings.
The other aspect to this is leveraging resources outside of one transportation agency. Many localities have a federally mandated regional planning organization (commonly referred to as a metropolitan planning organization or council of governments) chartered to conduct long-term planning analysis. In this situation, the planning organization may provide a base transportation network that could be used by the transportation agency in a work zone analysis.
2.4.3 Funding
Funding availability to conduct a work zone modeling analysis is another critical component of the agency resources. While there are many progressive transportation agencies trying to account for and mitigate the impact of work zones on the traveling public, an argument may still need to be made to allocate project funding to conduct a comprehensive work zone analysis. Sometimes, funding availability may limit the extent to which a work zone analysis can be conducted because money is not available for acquiring the necessary modeling tool or issuing a contract for the analysis to be conducted by a consultant. Regardless, any type of work zone analysis will require at least a minimum amount of funding and the accuracy and results of the analysis will depend to a certain degree on the amount of money available. As the use of more complicated tools is warranted, such as moving from a simplified delay estimation tool to a mesoscopic or microscopic transportation simulation tool, the costs will likely increase.
2.4.4 Schedule
A critical element in selecting a modeling approach is the project schedule. The amount of time required to conduct an analysis generally increases as one moves from the simplified to the more complex modeling approaches identified in Figure 1, the Work Zone Modeling Spectrum. In order to reduce the constraints of schedule to a work zone analysis, analysts should try to leverage other resources as much as possible. This includes seeking resources in-house that have conducted previous analyses related to the specific work zone area or general location as well as looking to other agencies and analyses that have used similar modeling tools. The point here is to leverage to the fullest extent possible the work that others have done so as not to “recreate the wheel”.
Agencies who have taken a strategic approach to incorporating modeling into the overall work zone decision-making process have an advantage in addressing the schedule constraint. Agencies that have invested in developing modeling resources from the beginning (be it on-call contractors or in-house technical expertise) with a deployed capability in “stand-by” mode are better able address unanticipated questions when they arise and a decision must be made quickly. Those agencies that have invested in standing analytical capabilities will be more nimble in responding to these situations than those who start from scratch for each analysis. Thus, these agencies limit the impact that a schedule constraint has on generating useful results from the models as part of the decision-making process.
2.5 Work Zone Performance Measures
An important aspect in selecting a work zone analysis tool will be selecting a tool that outputs results that can be used to evaluate the work zone performance measures established by the transportation agency at the precision that is required to make a decision. Many transportation agencies use different types of measures of effectiveness for work zone impacts which can range from maximum additional travel time to maximum queue lengths caused by the work zone. Thus, if an agency has a requirement that no work zone may contribute more than 20 minutes of additional travel time delay, then the tool selected must be able to accurately predict that value. In addition, if the model will be used to assess financial incentives and disincentives, then it is imperative the model be able to predict the results accurately in order to set those levels.
2.5.1 Measures of Effectiveness
The following seven work zone measures of effectiveness come from the Work Zone Performance Assessment Measures compiled by FHWA in the publication Work Zone Impacts Assessment: An Approach to Assess and Manage Work Zone Safety and Mobility Impacts of Road Projects (3). These seven were distilled from a larger list based upon the ability for currently available transportation analysis tools to calculate the performance measures.
Most of the transportation modeling approaches presented in Section 1.1 are capable of reporting the various work zone measures of effectiveness an agency requires. If agency policy stipulates a need to measure lane-by-lane queue lengths, the most accurate results will most likely be generated by a microscopic transportation simulation program since it provides results at the vehicle and lane level. However, microscopic tools are particularly complex and costly to deploy when modeling large corridors and regions. In these cases a mesoscopic model or regional planning model could be used to predict queue lengths when lane-level result are not critical. What is important is to select the approach that best provides the needed measures relative to the available data and work zone attributes.
Travel Time — A performance objective for many agencies might be to maintain an average travel time through the work zone for a certain period of time. Travel time is one of the most common measures used to track work zone delay. Microscopic and mesoscopic simulation can determine these results at the vehicle level, whereas sketch-planning, HCM methodologies, and travel demand models will provide travel time results based on the average for the system or work zone area. Some agencies may also collect real-time travel data during construction implementation and provide this information directly to travelers.
Utah DOT I-15 Reconstruction |
|---|
See the Utah DOT I-15 Reconstruction Design-Build Evaluation case study for a discussion on the use of travel time as a performance measure. |
Delay — To improve safety and mobility through a work zone, most agencies will measure delay through the work zone. Delay is defined as the amount of additional travel time drivers spend traveling which is caused by the work zone. Delay and travel time are directly related. Some agencies provide a delay rule that states a construction project can not cause more than 20 minutes of additional delay or total delay through a work zone. Work zone analysis is used to estimate various delay measures (e.g., maximum or average delay) in order for construction to be staged accordingly. Mesoscopic and microscopic simulation models can model vehicle delay and total delay through the work zone. Sketch-planning tools, some travel demand tools, and some macroscopic simulation tools can model average vehicle or total delay through the work zone. Depending on the size and type of work zone and the data available for modeling, these tools may be sufficient for determining the impact the work zone has on delay.
Yosemite National Park |
|---|
See the Yosemite National Park: Yosemite Village Roadway Reconstruction case study for a discussion on how a maximum user delay policy impacted the work zone. |
Queue Length — Queue length is also a common performance measure that many agencies use to determine the impact of a work zone. Some agencies use queue length measures to determine when to set up lane closures or even when to remove lane closures if the queues get too long. Queue length is defined as the number of vehicles or length of vehicles queued to travel through the work zone due to the reduction of roadway capacity caused by the construction. Mesoscopic and microscopic simulation models can analyze queue lengths on a lane-by-lane basis. Data collection for these models will need to be more accurate so the model can properly represent the field conditions. Some sketch-planning tools and some macroscopic simulation models may also estimate queue length, representing the average queues for the time period. If detailed data is not available, sketch-planning models are often used for developing construction schedules that specify when or when not to close lanes.
Zion National Park |
|---|
See the Zion National Park: Entrance Booth Reconstruction case study on the impact that queue length had in the decision to shift construction to night-time. |
Speed — Speed is another traffic flow characteristic like delay that some agencies might measure to determine work zone impact. Similar to delay and travel time, speed is a common measure for assessing mobility through the work zone. Results from modeling tools that determine speed can also be used to establish the speed limits for the work zone during design. There are many transportation modeling approaches to analyze speed. There are analysis tools within sketch-planning models, HCM models, travel demand models, macroscopic simulation, mesoscopic simulation, and microscopic simulation models that provide speed as an endogenous variable in the model output.
Woodrow Wilson Bridge Reconstruction |
|---|
See the Woodrow Wilson Bridge Reconstruction case study for more information on the use of a microscopic simulation tool to evaluate variable speed limits within a work zone project. |
Volume — Traffic volume as a performance measure is defined as the reduction in the amount of vehicles traveling on the roadway due to the work zone. Volume is directly related to capacity when determining the impact the work zone will have on the project. Travel demand models, traffic signal optimization tools, and mesoscopic and microscopic simulation models all measure volume as it relates to the reduction of capacity through the work zone.
In all cases, volume is a count of vehicles passing over a certain point (e.g., vehicles per hour or vehicles per hour per lane). However, interpreting the volume value is different based upon where it is measured. For example, if the work zone to be analyzed creates a bottleneck on the roadway resulting in queuing, volume through the work zone is a measure of throughput. In situations where the work zone is not causing any queuing, volume is a measure of travel demand.
User Cost — User cost refers to the estimated loss of productivity from road user delay caused by the construction project and the work zone. User costs are more difficult to analyze and there are few analysis models that can provide this performance measure as a result. In addition some agencies find it difficult and more time consuming to place values on productivity loss. Road user costs might be considered early in the design stage to determine the best construction staging and they can also be used as an incentive or disincentive in contracts to reduce the overall construction schedule.
Caltrans I-15 Pavement Reconstruction Project |
|---|
See the Caltrans I-15 Pavement Reconstruction Project case study for a discussion on the use of cost data (including hard and soft costs) in selecting a work zone construction scenario. |
Incidents — Incidents as a performance measure refers to the quantity of vehicle incidents that occur as a result of the construction project and the work zone area. When agencies establish goals and objectives to improve the safety and mobility through the work zone, the performance measures established will be related to traffic flow, delay and the number of incidents. There is always a strategic goal to reduce incidents in work zones; however there are very few models available to analyze how to reduce or mitigate incidents. Some agencies use historical data to analyze future work zones. There may be a microscopic simulation tool that can analyze this data depending on the needs of the agency. Determining the quantity of vehicle incidents will most likely be reserved for Type I or Type II construction projects.
Utah DOT I-15 Reconstruction |
|---|
See the Utah DOT I-15 Reconstruction Design-Build Evaluation case study for an example on how a crash analysis was used to influence roadway construction policy. |
Cumulative Impact — The cumulative impact refers to assessing the impact of multiple or linking construction projects within a corridor or a region. This includes situations in a region where multiple construction projects occur simultaneously as well as a single construction project involving multiple work zones that may create an interaction with other. The impact globally may be more significant than the individual impact of each work zone and therefore needs to be considered. The Work Zone Rule definition of significant project addresses work zone impacts from either individual projects or the combined effects of a project’s impacts with those of other concurrent projects nearby. Minimizing cumulative work zone impacts can be achieved by adjusting construction scheduling and project coordination. Mesoscopic simulation or sketch-planning models will provide the best results for evaluating the impact of multiple construction projects within a region. There may also be travel demand models or macroscopic simulation models that can perform this analysis depending on the needs of the agency.
Michigan DOT |
|---|
See the Michigan DOT: Southeastern Michigan Simulation Network case study for an example of addressing the cumulative impact of multiple construction projects in a region. |
Glacier National Park |
|---|
See the Glacier National Park: Going to the Sun Road Rehabilitation Project case study for a detailed discussion on the impact multiple work zones have on work zone staging and design for a single project. |
2.5.2 Precision of Results
The precision of results will be directly related to the modeling tool chosen to analyze work zone impacts. The size and characteristics of the work zone, the needs of the agency, the measures of effectiveness to be evaluated and those the model reports, and funding available for analysis will all determine which type of modeling analysis is best suited to examine work zone impacts. The stage or phase of the work zone may also affect which analysis tool is best for the situation. During the planning stage, the agency may be interested in high-level results, whereas during implementation of a large Type I construction project, more detailed results may be required when more data is available.
While the need for precision is often driven by the stage of the project life-cycle (Planning, PE/Design, or Construction), other external factors related to agency resources (discussed in Section 2.4) may limit the available transportation modeling approaches, thus the overall level of precision. A summary of these tradeoffs is presented in Figure 9 below.
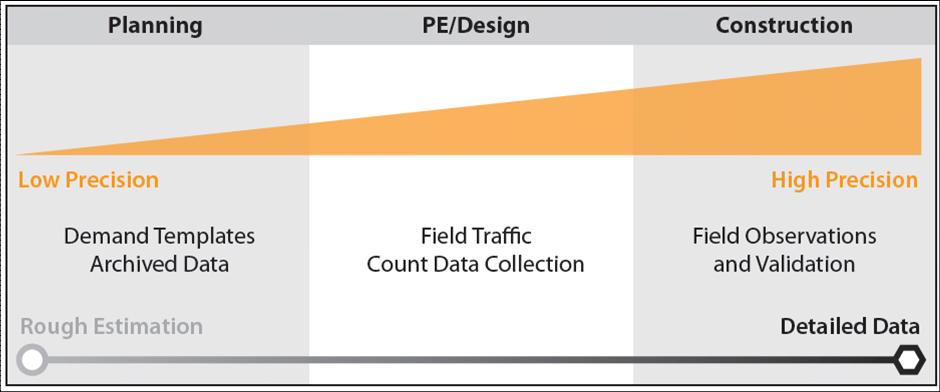
Figure 9 Work Zone Data Spectrum
The bottom bar shows the level of precision generally needed for the project life cycle stages with more precision desired as one moves from Planning to PE/Design to Construction. The top bar shows a progressive refinement of impact parameters (data quality and data availability) to enable more and more precise work zone impact estimation.
Projects within the domain of the Planning stage generally need less precise results and, therefore, less precise data. When rough estimates are required, it is often worthwhile to consider existing data sources when getting started with an analysis. In this case the cost to collect detailed data is often unwarranted and existing data assimilated from multiple sources, such as template libraries and historical data, are generally sufficient to conduct an analysis to support rough estimation.
Projects in the PE/Design stage would require more refined and accurate data than those in the planning stage but not as detailed as those within the construction stage. In this stage of development, depending on the situation, historical data combined with more recent traffic count or visitor data may be sufficient to get the desired results. In some cases it is warranted to use some of the available resources to collect more detailed field data, especially if performance-based contracting is to be used or if liquidated damages will be established, in which case the most detailed data available needs to be used. On the other hand, projects entering or within the Construction stage would need much more accurate and timely data since the analysis will more than likely require differentiation between very similar alternatives that require a higher fidelity of data. For example, a contractor may request an additional lane of traffic be taken away for an extra two hours each Sunday morning in order to more quickly perform the work. Analyzing this type of request is a situation where highly precise results would be warranted in an operational work zone. In this situation, it would be possible to collect field data such as first-hand queue observations and traffic volume. Overall, the amount and types of data required will depend primarily upon the characteristics of the work zone, the analysis area dimensions, the needs and resources of the agency, and the accuracy required to evaluate the performance measures. Data collection will involve a combination of existing and available sources, and new data collected before and during work zone implementation.
An example of the precision of results is the difference between outputs from a sketch-planning tool and a microscopic simulation model. Sketch-planning tools designed specifically for work zone analysis (such as QUEWZ-98 or QuickZone) often provide results in one hour time slices. However, microscopic simulation models provide results on the minute-by-minute level. Thus, if a particular work zone analysis requires results every five minutes (such as a variable speed limit system), a transportation modeling approach providing higher precision of results may be required.
Modeling analysis results can be divided into two categories: rough estimation and detailed assessment.
- Rough Estimation — Sketch-planning tools, HCM methodologies, travel demand models, macroscopic simulation models, and some traffic signal optimization tools will produce results that are often expressed as "maximum" or "average". These tools do not analyze traffic at the individual vehicle level. Results are considered average for the time period and the network and give the analyst an idea of what traffic impact might be like during work zone implementation. These tools are usually less data intensive and may provide enough detail for many work zone analyses.
- Detailed Assessment — Mesoscopic and microscopic simulation models and some traffic signal optimization tools provide detailed results. Tools in these categories provide results that model individual vehicle movements and turning patterns. These tools are usually more resource intensive and require much more data. The results provided give a detailed assessment of existing conditions and multiple work zone alternatives and provide the agency with a good representation of what field conditions will be like during work zone implementation. Detailed assessments are often reserved for large, Type I work zones that will affect large numbers of travelers for a long duration. Another possibility for using mesoscopic or microscopic simulation would be if the agency already has a simulation model prepared for the region or area where the construction will be performed. The analyst can populate the model with the alternatives and new data to determine the best work zone alternative.
Table 5 provides a summary of the transportation modeling approaches that have been historically used to calculate the measures of effectiveness as well as the precision of results generated by the modeling approaches. The suitability classification system is different for each. The measures of effectiveness use the following definition in Table 5:
|
= |
Performance measure is often calculated by the transportation modeling approach. |
|
= |
Performance measure is sometimes calculated by the transportation modeling approach. |
|
= |
Performance measure is rarely calculated by the transportation modeling approach. |
n/a |
= |
Transportation modeling approach should not be used to calculate the performance measure. |
The precision of results use the following definition in Table 5:
|
= |
The transportation modeling approach commonly produces results at this level of precision. |
|
= |
The transportation modeling approach does not commonly produce results at this level of precision. |
Table 5 Performance Measure Factors
Factors PERFORMANCE MEASURES |
Summary |
Transportation Modeling Approach |
Case Study |
|||||
|---|---|---|---|---|---|---|---|---|
Sketch-Planning and HCM Methodologies |
Travel Demand Models |
Traffic Signal Optimization |
Macroscopic Simulation |
Mesoscopic Simulation |
Microscopic Simulation |
|||
Measure of Effectiveness
|
||||||||
Travel Time |
Amount of time it takes vehicles to travel through the work zone. |
|
|
n/a |
|
|
|
Utah DOT I-15 Reconstruction Design-Build Evaluation |
Delay |
Amount of time drivers spend in traveling through the work zone. |
|
|
n/a |
|
|
|
Yosemite Nation Park: Yosemite Village Roadway Reconstruction |
Queue Length |
Number of vehicles or total length of vehicles queued to travel through the work zone due to reduction in roadway capacity caused by the construction. |
|
n/a |
n/a |
|
|
|
Zion National Park: Entrance Booth Reconstruction Woodrow Wilson Bridge: Roadway Closure Analysis |
Speed |
Vehicle speed through the work zone. |
|
|
n/a |
|
|
|
Woodrow Wilson Bridge Reconstruction |
Volume |
Reduction in amount of vehicles operating on the roadway due to the work zone. |
|
|
n/a |
|
|
|
|
User Cost |
Estimated productivity loss due to driver delay caused by the work zone. |
|
|
n/a |
|
|
|
Caltrans I-15 Pavement Reconstruction Project |
Incidents |
Quantity of vehicle incidents that occur as a result of work zone project. |
|
|
n/a |
|
|
|
Utah DOT I-15 Reconstruction Design-Build Evaluation |
Cumulative Impact |
Assessing the impact of multiple roadway construction projects within a region or corridor. |
|
|
n/a |
|
|
|
Glacier National Park: Going to the Sun Road Rehabilitation Project Michigan DOT: I-94 Rehab MOTSIM |
Precision of Results
|
||||||||
Rough Estimation |
Results produced by traffic analysis tools that do not model individual vehicles or turning movements. Results often expressed as "maximum" or "average". |
|
|
|
|
|
|
New Jersey Turnpike Authority: Lane Closure Application Zion National Park: Entrance Booth Reconstruction |
Detailed Assessment |
Results produced by traffic analysis tools modeling individual vehicle movements and turning patterns.. |
|
|
|
|
|
|
Michigan DOT: Southeastern Michigan Simulation Network |
[1] The assumption at this point is that a work zone analysis will be conducted. Section 4.1, Deciding to Analyze or Not Analyze, provides a detailed discussion related to the opportunities and risks associated with conducting a work zone analysis.
[2] The discussion of Transportation Management Plans is based upon the classification developed by FHWA in the report Developing and Implementing Transportation Management Plans for Work Zones available at http://ops.fhwa.dot.gov/wz/resources/publications/trans_mgmt_plans/index.htm. A detailed discussion of each individual strategy discussed in the following sub-sections is available in the FHWA TMP document.
[3] A detailed discussion on the precision of the results is provided in Section 2.5.2, Precision of Results.
Table of Contents | Previous | Next