Traffic Analysis Tools Volume IX: Work Zone Modeling and Simulation
A Guide for Analysts
Michigan Department of Transportation Southeastern Michigan Simulation Network (SEMSIN)
Overview
In 2005, the Michigan Department of Transportation (MDOT) was involved in the environmental clearance process for several major projects dealing with long-distance interstate and international trade. Since each of these projects would have major impacts on network freight flows, especially on the Detroit area freeway network, there was a need to analyze the individual projects within the framework of the larger system and in relation to each other. In addition, much of the Detroit area freeway system operates at or near capacity. Traditional travel demand models and highway capacity analysis could not fully capture the dynamic effects of these impacts on the network. Lastly, divisions of the MDOT responsible for operations (for example, work zone mobility) needed a traffic tool that would enable them to examine the network effects of major road closures and/or detours. Thus, the MDOT saw a need to develop a large-scale, network simulation model, capable of modeling passenger cars, domestic trucks and international trucks, and which would support planning and operational decisions. An SPR-funded pilot project was initiated to develop a network a simulation model. Initially, the core of the Detroit freeway network would be modeled, plus the I-75 corridor extending from the City of Detroit in Wayne County, to the industrial heart of Oakland County, a distance of 30 miles. This project was called the Southeastern Michigan Simulation (SEMSIM).
However, before the SEMSIM, which was a pilot study, was completed, there was an immediate need by three other very large projects for network simulation. The SEMSIM, in its then current state of development, served as the platform, or seed model for these three projects. Specifically, each project, The Ambassador Bridge Gateway Project, the I-94 Rehabilitation Project, and the I-75 Trade Corridor Project, cut out large sections of the SEMSIM network, extending freeway links and adding surface arterial corridors as needed.
The SEMSIM network was created using the Paramics microscopic simulation model and is show in Figure 18 on the left. The network incorporates the Central Detroit Freeway Network and the I-75 corridor extending to Pontiac, Michigan. The overall size is approximately 30 miles north/south and 15 miles east/west. It includes all freeways and most major arterial roads. On the right are the locations of three maintenance of traffic simulation (MOTSIM) assessments that have been or are being conducted based upon the SEMSIM network. These three projects include the Ambassador Gateway Bridge MOTSIM (red), I-75 Trade Corridor MOTSIM (Purple), and the I-94 Rehab MOTSIM (green). The following sections will describe in more detail the application of the SEMSIN network for the three MOTSIM projects.
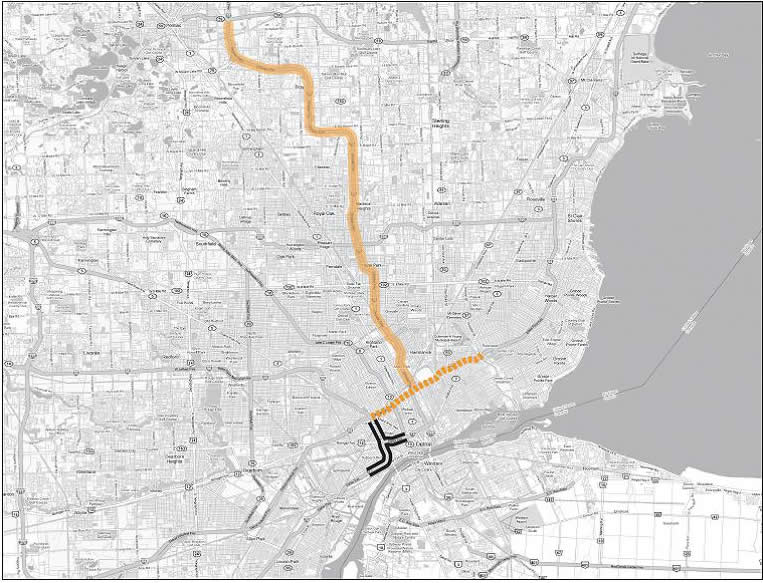
Figure 18 MDOT METSIM Geographic Coverage
Ambassador Gateway Bridge MOTSIM
The first application of the SEMSIM network was the rehabilitation and reconstruction of the I-96/I75 interchange adjacent to the Ambassador Bridge that provides the major commercial connection between Canada and the United States (Figure 19). The overall project includes reconstructing and realigning a 1.5 mile segment of I-75 and 1 mile segment of I-96, and construction of a new interchange with direct access ramps for trucks to the to the Ambassador Bridge, which is the largest commercial border crossing in North America. The reconstruction includes the full closure of many sections of the elevated freeway near the interchange which provides critical connections for freight movement both across the boarder and within the Detroit area. The project began in February 2008 with an estimated completion date of December 2009. A contractor incentive bonus of up to $8 million is being offered for early completion. In all, three separate analyses were conducted as part of the project during the construction stage:
- Gateway MOTSIM 1—Initial assessment which included surrounding roads near the construction project and interstate and arterial roads leading into and around the construction project (red boarder in Figure 2).
- Gateway MOTSIM 2—An expansion of the MOTSIM 1 network to include proposed lane closures for the Summer 2008 construction season along I-75 to the north and south (highlighted purple sections in Figure 2).
- Gateway MOTSIM 3—Developed in March 2008 based upon actual traffic conditions occurring as part of the full closure that began in February 2008. This analysis included a further assessment of Gateway MOTSIM 2 based upon actual conditions.

Figure 19 Ambassador Gateway Bridge MOTSIM Network Overview
The results of the Gateway MOTSIM 1 analysis did not reveal any significant queuing or delay associated with the reconstruction project given the mitigation efforts that were to be implemented as well as the excess capacity available on other roadway links. However, during 2007 MDOT planned lane closures along section of I-75 to the north and south of the construction area that had not been included in the original analysis. The planning of the I-75 lane closures did not take into account the increased traffic due to the I-75/I-96 interchange reconstruction. The Gateway MOTSIM 2 analysis included the route diversions that would take place due to the I-75/I-96 reconstruction. The analysis revealed some areas of concern that lead MDOT officials to modify some of the planned mitigation efforts including travel advisories along I-94 and I-96, the major detour routes.
Gateway MOTSIM 3 began development in June of 2008 in response to feedback from stakeholders that lead MDOT management to alter some of the maintaining traffic ramp closures planned for July to October 2008. Also, traffic volume has been significantly lower since January of 2008. The results of MOTSIM 3 will point to further areas of mitigation and better performance measuring.
I-94 Rehab MOTSIM
The rehabilitation of I-94 in Detroit is an approximately six mile rehabilitation which will include the reconstruction of three interchanges (M-10, I-96 and I-75). The planning process has been occurring for the past 10 years at a cost of $11 million. Currently, the project is in the design stage of the decision-making process. MDOT refers to the current status as the Engineering Report (also known as pre-design or 10 percent of base plans) and has provided an initial construction cost of $1.3 billion. The purpose of the network simulation is to support the project in terms of constructability, staging, maintenance of traffic, cost estimates, financial plans, horizontal and vertical alignments and right-of-way planning. Currently, the team involved in the I-94 Rehabilitation project is using the I-94 Rehab MOTSIM to begin screening construction staging alternatives.
In addition to being another application of the SEMSIM data, the I-94 Rehab MOTSIM is the beginning of developing a new business process for MDOT whereby planners, traffic engineers and designers are all working together and incorporating the use of traffic models early in the decision-making process and using it to help answer many different types of questions. Documenting this process will provide a template for further process improvement.
I-75 Trade Corridor MOTSIM
The I-75 corridor between Detroit and Pontiac, Michigan is part of the truck network that supports critical supply chains linking automobile parts suppliers and manufacturers in Michigan and Ohio in the United States to each other and to the Province of Ontario in Canada. MDOT is currently planning for widening a 19-mile segment from outside Detroit to the City of Pontiac from three to four lanes. Currently in the planning stages (nearing completion of Engineering Report), the I-75 Trade Corridor MOTSIM will enable MDOT planners, engineers and designers to work together and test various scenarios to ensure mobility throughout the work zone, constructability is maintained and staging is adequate. The I-75 Trade Corridor MOTSIM will build upon the SEMSIM network, adding additional freeway links of I-696 and M-59, and Michigan surface arterial roads.
Findings
Process
Early in the development of the SEMSIM and Gateway MOTSIM, process issues immediately started appearing. With the then-current processes in MDOT, large network simulation could turn out to be a very resource intensive undertaking. Unless processes were developed to expedite model development and maintenance, network simulation might be unfeasible. And if each simulation model were limited to a single use or application, this cost might not be justified. The following describes three process issues that emerged.
Approach: Stand-alone, top-down, or bottom-up?
Before SEMSIM was conceived, all of MDOT’s microsimulation models were project-specific, stand-alone models. They did not encompass or relate to the larger network, and they did not relate to each other. Thus, while each project had potentially profound consequences for the network, none of the models were capable of analyzing these. The technology of the time did not provide the needed plasticity for large, multi-purpose, multi-application models. Subsequently newer microsimulation software packages with cut-and-paste capability emerged and this advance allowed an ambitious project like SEMSIM to be conceived. For the first time, an existing model could be modified and reused by multiple applications. The technological problem appeared to have been solved.
Initially, the SEMSIM was conceived to become a complete top-down metropolitan area-wide or “master model”, to be updated, and maintained on an ongoing basis, with a dedicated staff and budget, much like an MPO (Metropolitan Planning Organization) model. It soon became apparent that this approach would be resource intensive, and in any case, events were overtaking the process and MDOT’s ability to implement this idea. What evolved by necessity was a bottom-up, incremental approach, whereby the SEMSIM and each subsequent derived, would serve as a core network for the next baby model. Instead of maintaining a “Master Model”, each project would take whatever models had been developed to date, and update and customize them to its own needs. The costs of each customized model would be born by each project which used it. This leads to a problem of assuring uniformity between and among models, but this problem could be addressed by QA/QC or other institutional devices.
Data
Large scale, network simulation uses lots of data, especially traffic data. Initially, the fear was that there would not be enough data. It soon became apparent however, that the problem was not insufficient data, but rather poor or non-existent data processes. In a scramble to assemble system-wide data in a format that lent itself to mass data analysis and processing, several underlying process issues came to light. At the same time, MDOT had several tools or initiatives that held potential to resolve the problem, most notably, the Michigan Framework. The Framework was a unified GIS system that serves all agencies at all levels of government and even private industry. The Framework allowed every single directional link or structure, or any item that could be located in three-dimensional space, to be assigned a unique identifier (such as a physical reference number and milepoint). MDOT was in the process of inventorying and storing all its traffic and structure data (such as roads, ramps, bridges, traffic counts, bill boards, guardrails, and even ash trees) as Framework layers. This was to be an ideal platform for storing and retrieving traffic data and even coding the SEMSIM network.
The first issue was assembling large masses of freeway volume data from hundreds of stations across the system. The process of geo-coding traffic data collection sites to be Framework layers was accelerated to serve the SEMSIM. In addition, the project scope included the development of traffic analysis tools, such as would aid in cleansing and inputting traffic data and balancing in and out volumes along a corridor. A second issue was turning-movement traffic counts at signals. The traffic signal re-timing studies that were being performed were being collected by various consultants under different contracts, administered by engineers in the various Transportation Service Centers around the State. Not only were these traffic studies not centrally stored, they were not even known to a central data collection office. In fact, there was no central data collection office for the whole Department. A few quick phone calls to DOT’s around the Country, confirmed that MDOT was not unique in this respect. Presently, MDOT is undergoing a systematic process improvement to rationalize and integrate all Departmental traffic data, and to geo-code it so it can be layered on the Michigan Framework. Finally, Michigan now has six inch resolution aerial photography of all its counties, in a projection that is consistent with the Framework. Thus, a Framework trunkline map and a “Sufficiency” file (with road segment characteristics data) can be layered on an aerial photo, with a zoom factor that allows pavement markings to be observed. These can be exported as bitmaps and imported into the simulation software, and network coding greatly expedited.
Organization
Simulation models and data collection are the easy part. They have to do with technology and software and numbers. The really difficult process issues have to do with the Organization itself. The best technology in the world can’t solve a DOT’s problems if its organizational processes are not compatible, or do not “fit”, the new possibilities of the technology. For example, it took almost an entire generation, from 1970’s to the 1990’s before most government organizations fully adapted to the potential and promise of computer technology. Today, few could imagine an office or business without computer technology. They have transformed our processes, and at the same time, have pushed out our production possibilities curve. Likewise with simulation. Old simulation models lie in dusty files around MDOT, under- or unused, because they didn’t get the right information to the right people at the right time. Much of this was due to the limited capabilities of the old technology. But it was also due to the fact that the old organizational structure hadn’t caught up to the new possibilities. A lot more cross-organizational integration would be required. More organizational flexibility would be needed, so that processes that need to iteratively test scenarios can get traffic model updates as needed, and then pass output to downstream processes which may also need customized traffic model output.
In 2008, a concept for integrating MDOT’s business processes to support an Operations-oriented environment was developed, called “Integrated Transportation Systems Operations and Management” or ITSOM. Concomitantly, the Department was reorganized and a new Division of Operations was created. The emphasis throughout, is integration of tasks and functions across MDOT to support an integrated approach to Operations. The Division of Operations combines and extends previous functions such as ITS, Vehicle and Infrastructure Integration (VII), Work Zone Mobility and Safety, Traffic and Safety, and Maintenance. Strategic objectives and task forces charged with implementing these strategic objectives were established. Two of these objectives illustrate the new emphasis on cross-organizational integration and flexibility: 1. “Data Data Data” which would integrate data and data systems across the Department, and 2. “Integrate across the Organization”, which includes, for instance, new channels and forums for communications and inter-divisional training. With implementation of ITSOM, MDOT will be positioned to fully harvest the potential of simulation to support all its Operations functions.
Table of Contents | Previous | Next