Traffic Analysis Tools Volume IX: Work Zone Modeling and Simulation
A Guide for Analysts
Zion National Park Entrance Booth Reconstruction
Zion National Park
Entrance
Booth Reconstruction[14]
| Work Zone Characteristics | |
|---|---|
| Transportation Analysis: | |
| Approach | Sketch-Planning |
| Modeling Tools | QuickZone |
| Work Zones: | |
| Type | Type III |
| Network Configuration | Isolated |
| Geographic Scale: | |
| Work Zone Size | Small |
| Analysis Area | Local |
Overview
Designated a National Park in 1919, Zion National Park is Utah's oldest national park. Zion canyon features soaring towers and monoliths that suggest a quiet grandeur. Zion is also known for its incredible slot canyons, including "The Narrows," which attract hikers from around the world. With nearly three million visitors per year, Zion is Utah's most popular National park. Entrance fees are $20 per vehicle and $10 per person arriving on foot.
There are two major entrances to Zion National Park, a south and an east entrance. A third entrance, located on the west side of the park, provides access only to Zion's Kolob Canyon. The South Entrance is the larger and most frequently-used of the three entrances. The South Entrance is on Utah Route 9 about 60 miles south from Cedar City, via I-15 and Utah Route 17 (see Figure 44 below). The East Entrance is on Utah Route 9, 12 miles east of Mt. Carmel Junction, at U.S. Route 89. The park contains over 12 miles of road. To ease traffic congestion within the park, a shuttle system is available to take visitors to the most popular areas. A shuttle bus service is also available from the town of Springdale, just outside of the park. Shuttles operate from April through October; during that period private automobiles are not allowed on the 6.5 mile stretch of road in Zion Canyon. The shuttles provide the only access to marquee attractions like the Great White Throne, the Watchman, the Grotto, Angels Landing, Weeping Rock and the Temple of Sinawava. Automobiles are allowed on other park roads, including all of Hwy 9, which provides access to the lower part of the park, the Tunnel and the East Entrance/Checkerboard Mesa area.
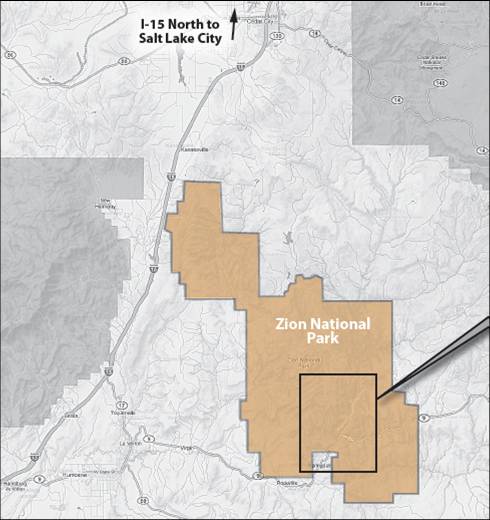
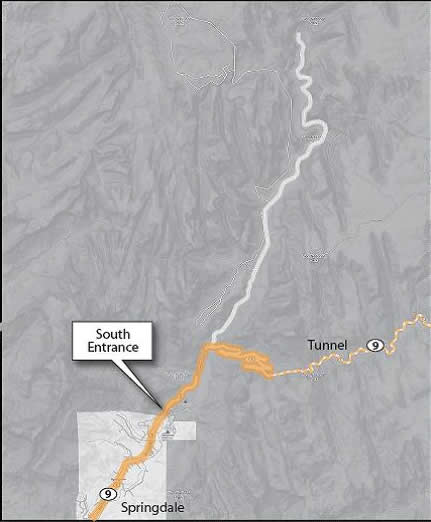
Figure 43 Zion National Park Overview |
Figure 44 Zion National Park South Visitors Entrance |
Approximately 90% of park visitors utilize the south visitor’s entrance. The entrance includes 2 visitor lanes and 1 employee lane, controlled by a radio-frequency tag system. Employees are able to process approximately 240 visitor vehicles an hour of which 50% are cash transactions, 40% credit card and 10% National Park Pass. 75% of the vehicles entering the park are passenger cars/trucks and 25% are RVs. During the peak season, recurring queue can extend as much as ¼ mile from the entrance.
In 2004, a major rehabilitation of the main road through Zion, beginning at the south visitor’s entrance and extending into Zion Canyon was scheduled to take place. This included widening and structural repairs of certain sections of the existing road and milling/paving of the entire 7 mile stretch. A major concern of the National Park Service was the impact to visitors coming to Zion National Park through the town of Springdale. Traffic congestion on roads inside the park was not a concern since visitors are required to use the free shuttle bus service.
Significant queuing and delay at the south visitor’s entrance, where recurrent queues were already present, was of major concern to park administrators. The original work zone plan called for shutting down one visitor entrance lane at a time for construction. The National Park Service did not want construction to cause a queue to form that extended into the town of Springdale, approximately 1/2 mile from the south visitor’s entrance. A queue of this length would not only impact traffic in the town, but employees getting to the park and the operation of the shuttle bus service from the town to the park. The work zone analysis and use of the traffic modeling tool was used to estimate the length of queue and number of vehicles in queue if one of the two visitor entrance lanes were to be closed for construction. This was conducted for the peak tourist months of June, July, August, September and October.
Work Zone Characteristics
The Zion National Park work zone is simple in design and can be considered an isolated work zone with no interaction of surrounding infrastructure. For the purposes of this work zone analysis, only the south visitor’s entrance was modeled since there was no concern about queuing or delay along the seven mile stretch of road within the park.
A critical element regarding this work zone was estimating the capacity of the south visitor’s entrance. This entailed calculating the number of vehicles that can be processed in an hour and is similar to estimating the capacity of a signalized intersection or toll plaza. Work zone capacity was calculated using average transaction time per vehicle and a breakdown of average transaction types per day. It was calibrated against historical queuing data to arrive at an overall facility capacity. Hourly counts were generated from a simple traffic study conducted in April 2002 for an average day both during the week and on the weekend. Seasonality was taken into account by using April as a baseline point and scaling up demand based upon historical knowledge for the months of June, July, August, September and October.
Construction at the south visitor’s entrance was just one component of the overall construction project and was estimated to take between two to three weeks. The use of the traffic model was being used to estimate queuing impacts if construction were to occur during the months of June, July, August, September or October and to determine which month would cause the least amount of impact.
Application
The roadway construction at Zion National Park was planned to only occur Monday through Friday and during daylight hours. This was done to avoid impacting the larger crowds visiting on the weekends and disturbing those visitors camping during the evening and overnight hours. As a result, the work zone analysis focused upon the weekdays. Baseline queuing was calibrated against actual demand seen in the field during the month of April. Once the calibration was complete, traffic model was run where capacity of the south visitor’s entrance was reduced by 50% (the equivalent of one lane of traffic entering the park).
The results of the work zone analysis indicated that the queue will impact the town of Springdale in each of the five months analyzed:
- June: .58 mile queue, 463 vehicles in queue
- July: .66 mile queue, 513 vehicles in queue
- August: .66 mile queue, 513 vehicles in queue
- September: .58 mile queue, 461 vehicles in queue
- October: .45 mile queue, 361 vehicles in queue
The order of magnitude for delay was around 300 minutes or 5 hours with the queue beginning to form around 9 AM, peaking at 3 PM and dissipating by 9 PM. Clearly, people will not wait 5 hours to get into the park. The key data point for this analysis was the estimated number of vehicles in queue and whether that queue will impact the town of Springdale.
Results of the Zion work zone analysis provided the local engineers with the necessary data to reevaluate the construction phasing. After seeing the results engineers knew that the current construction phasing could not take place as originally designed and began to brainstorm on various alternatives including opening up temporary entrance booths and shifting construction to the early evening hours to not coincide with the peak demand. In the end, the results of the work zone analysis provided the engineers with necessary evidence to require the reconstruction to take place at night.
[14] This case study was adapted from the report FLH-QuickZone Case Studies: The Application of FLH-QuickZone in Six Federal Lands Projects available from Federal Lands Highway Division.
Table of Contents | Previous