Traffic Analysis Tools Volume IX: Work Zone Modeling and Simulation
A Guide for Analysts
Caltrans I-15 Pavement Reconstruction Project
California Department of Transportation
I-15 Pavement Reconstruction Project[4]
| Work Zone Characteristics | |
|---|---|
| Transportation Analysis: | |
| Approach | Sketch-Planning Mesoscale |
| Modeling Tools | CA4PRS HCM DynamEq |
| Work Zones: | |
| Type | Type II |
| Network Configuration | Pipe |
| Geographic Scale: | |
| Work Zone Size | Medium |
| Analysis Area | Local |
Overview
The I-15 Pavement Reconstruction project (began construction in October 2008) will improve a four-mile stretch of I-15 near the interchange with I-10 in Ontario, California (referred to as the I-15 Ontario corridor). The reconstruction will rebuild two to three truck lanes in each direction, replacing damaged concrete slabs and base pavements with new concrete slabs using Rapid Strength Concrete (RSC) and new Asphalt Concrete (AC) base. Currently, this section of I-15 includes four to six lanes in each direction and carries an AADT of approximately 200,000, with a particularly high percentage of heavy truck traffic (about 12 percent on average on weekdays). In addition, the I-15 Ontario corridor has consistently high weekday commuter peaks and similar volumes on weekends due to leisure travelers from Los Angeles headed to and from Las Vegas and resort locations along the Colorado River. The project scope and study area are shown in Figure 15.
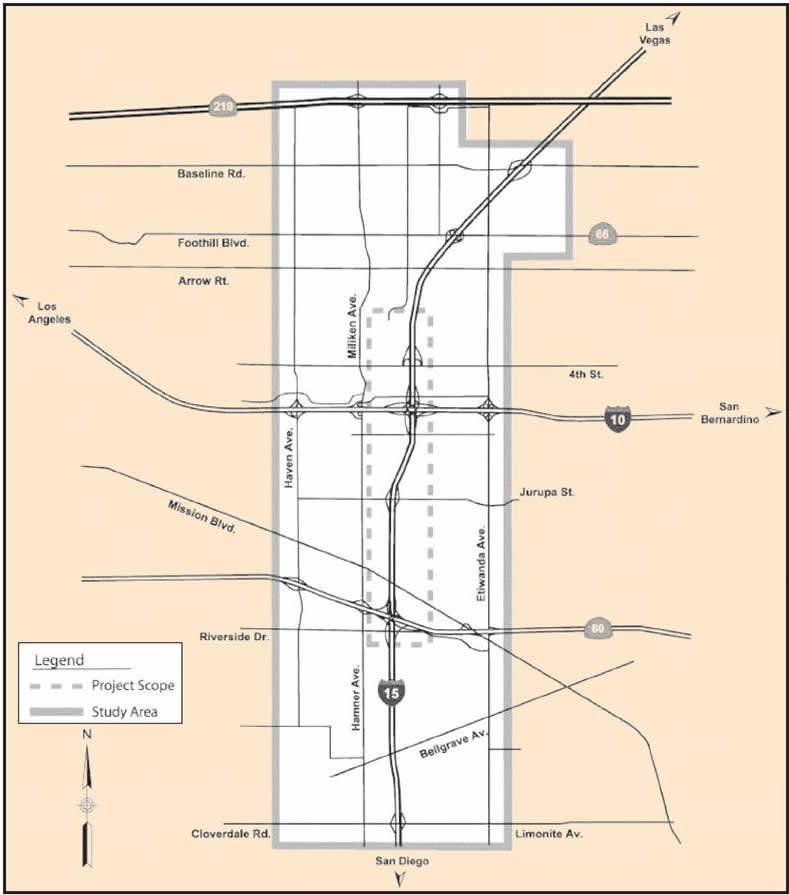
Figure 15 I-15 Pavement Reconstruction Analysis Area
Caltrans gave the preliminary notice to proceed with the design and analysis of the project in December 2004 after an extensive planning process. During the design stage, the integrated pre-construction analysis was to help Caltrans compare all feasible scenarios for the I-15 Ontario project and select the best approach in terms of production schedule, traffic delay, and total cost. To that end, Caltrans employed the use of three traffic modeling tools including the Construction Analysis for Pavement Rehabilitation Strategies (CA4PRS), Highway Capacity Manual Demand-Capacity Model (HCM), and the DynamEq mesoscopic traffic network analysis tool. The use of CA4PRS and HCM represent Phase I of the preconstruction analysis whereby six alternative construction scenarios were analyzed. The use of DynamEq represents phase II of the pre-construction analysis which entailed the development of traffic management plans. This process is shown in Figure 16.

Figure 16 I-15 Analysis Process
The following sections will provide more detail on the use CA4PRS, HCM and DynamEq in the two phases of the pre-construction analysis.
Phase I: Preconstruction Analysis
In the Phase I analysis, six construction scenarios were developed and analyzed using the CA4RPS tool in order to compare number of closures and the HCM to quantify queues and delay costs. The results of these two traffic models were included in an overall cost estimate analysis to determine the most appropriate construction scenario in terms of construction scheduling, impact on drivers and project costs. The following six construction scenarios were analyzed:
- Median widening (Original scheme)
- Value Analysis(VA) By-pass (eventually eliminated from overall analysis)
- Rapid Rehab 55-hour Weekend)
- Rapid Rehab(Continuous Progressive)
- Traditional nighttime(PCC slab replacement)
- Crack-Seat and AC overlay
Closure Assessment:CA4RPS — The CA4PRS was employed because it easily evaluates “what if” scenarios for highway rehabilitation in order to identify solutions that balance on-schedule construction production, traffic inconvenience, and agency costs. In addition, the CA4PRS results are easily integrated with various traffic simulation tools for quantifying road user costs during construction. This feature helped the project team determine rehabilitation strategies that maximize production and minimize inconvenience to the public. Caltrans collected data for the I-15 CA4RPS analysis using previous analyses of similar projects from around the state including I-10 Pomona, I-710 Long Beach and I-15 Devore. Results of the CA4RPS included the total number of closures as listed in the column labeled Number of Closures in Table X.
Traffic Analysis: HCM — The impacts of construction work zone closures analyzed using the CA4RPS on freeway traffic were quantified using the HCM Demand-Capacity Model. The model was created in Microsoft Excel based upon the methodology articulated in the HCM. First, total and maximum delays were calculated with variable traffic demand reduction by percentage and work zone roadway capacity. Second, road user cost (the time value of travelers adjusted by an annual growth factor) was estimated based on the calculated vehicle-delay hours during construction for each scenario. Finally, the California Freeway Performance Measurement System (PeMS) was used to estimate traffic demand. The results of this analysis (which included various sensitivity analyses) included two values: road user cost (RUC) and maximum roadway user delay per person. These results are listed in Table 6.
Cost Analysis — A typical construction cost analysis was conducted for each of the scenarios that did not include any type of traffic modeling component.
Results from the Closure Assessment, Traffic Analysis and Cost Analysis are listed in Table 6. As can be seen in the results, the outputs from the Closure Assessment, Traffic Analysis and Cost Analysis were used to develop an overall Total Cost. The Closure Assessment values were used to estimate the RUC and Delay for the Traffic Analysis. The RUC was discounted by one-third and added to the Cost Analysis value to create a Total Cost. These results indicate that Scenario 1, Original, is the most cost-effective after considering all of the critical variables involved.
Table 6 I-15 Reconstruction Assessment Results
| Scenario Name | Closure Scheme |
Closure Assessment (Number of Closures) |
Traffic Analysis | Cost Analysis | Total Cost[5] |
|
|---|---|---|---|---|---|---|
| RUC ($M) | Delay (Min) | |||||
| Original | Median + Structure Widening | 35 weekends | 3 | 16 | 78 | 79 |
| Rapid Rehab 1 | Full closure One roadbed |
35 weekends | 119 | 363 | 83 | 123 |
| Rapid Rehab 2 | Full closure One roadbed |
8 weeks | 123 | 363 | 77 | 118 |
| Traditional | Partial closure | 1,220 nights | 133 | 22 | 88 | 113 |
| Long-life CSOL | Full closure One roadbed |
20 weekends | 69 | 363 | 60 | 83 |
Phase II: DynamEq
The Phase II analysis for the I-15 Ontario project entailed two sub-studies: (1) a traffic network simulation using DynamEq to assist in the development of a TMP; and (2) a supplemental construction staging plan analysis which involved a more detailed analysis using the CA4RPS tool. Of primary concern here is the use of the DynamEq traffic modeling tool for developing the TMP. Based upon the Phase I Preconstruction Analysis, the recommended construction scenario was number 1 which entailed a total of 35 55-hour long weekend road closures. DynamEq was specifically used to analyze the detailed Construction Staging Plan and conduct an operational analysis of the primary detour routes for six key stages in the construction process where detours were considered to be critical. The six staging scenarios analyzed are summarized below:
- 2B—Closure of I-10W to I-15S and I-15S to Jurupa ramps
- 2C—Closure of I-10E to I-15S ramp
- 2D—Closures of I-15S to I-10W and from 4th Street to I-15S ramps
- 3D—Closures of Jurupa to I-15N and I-15N to I-10E and I-10W ramps
- 3F—Closure of EB I-10 to NB I-15 connector and both NB ramps at 4th Street
- 4B—Closure of SB I-15 to WB and EB SR 60
DynamEq was employed for use in this analysis due to the relatively large study area and the number of detour routes involved. While DynamEq is a user equilibrium model (meaning vehicles make optimal use of the network with the goal of minimizing overall system delay) the reality is that many of the vehicles operating on the network are unfamiliar to the area and do not have perfect information. Thus, there will be in-equilibrium in system usage. In order to account for this behavior in the DynamEq model, a new class of vehicles was created that are unfamiliar with the area and will always follow posted detour routes regardless of congestion levels.
Results of the study indicated significant user delay ranging from 8 to 121.4 minutes. Four of the six staging scenarios had significant delays of more than 30 minutes. The analysis results had two major impacts on the overall project design and development of the TMP. First, the results indicated the need for more than one detour route for some of the staging scenarios. This problem was not previously identified in other analyses. Second, a public outreach campaign is critical to ensuring demand reductions and detour routing.
[4] This case study was adapted from the reports: I-15 Pavement Reconstruction Project: Construction Operational Analysis prepared by Cambridge Systematics, June 7, 2007; Pre-Construction Analysis and Construction Staging Plan for The I-15 Ontario Pavement Reconstruction Project prepared by EBL Consulting and RBF Consulting, October 2006; and TAT Volume VII: Predicting Performance with Traffic Analysis Tools: Case Studies to be published in 2008.
[5] Total Cost = (RUC/3) + Cost Analysis
Table of Contents | Previous | Next