4.0 Rural High AADT
4.1 Yosemite National Park
Key Observations
- Complex geometric changes and traffic control by phase can be effectively modeled in QuickZone, including full closures and a variety of one-way and two-way traffic patterns on the same facility throughout the project.
- QuickZone helped to identify a feasible single-season construction schedule – reducing impacts to park visitors and reducing total project duration and costs.
- Development of an analytical traffic operations model early in the project life cycle motivates use and refinement in following project phases.
4.1.1 Overview
Yosemite National Park in California is one of the most popular national park destinations in the nation, averaging more than 40,000 visitors through its entrance gates each day throughout the year. One of the primary entrance destinations for park visitors is Yosemite Village, the primary hub of activity within the park and home to the Valley Visitors Center, a wide variety of lodging and dining options, trail heads, and other visitor services.
The shape of Yosemite Valley (Figure 4.1.1) makes access to Yosemite Village scenic for the park visitor but quite limiting for a traffic manager. Given the steep terrain around the valley, the only roadways into and out of Yosemite Village are Northside and Southside Drives running along the Merced River which flows through the center of the valley. Both facilities are two-lane, one-way facilities with stop-controlled intersections along their length at two bridge crossings.
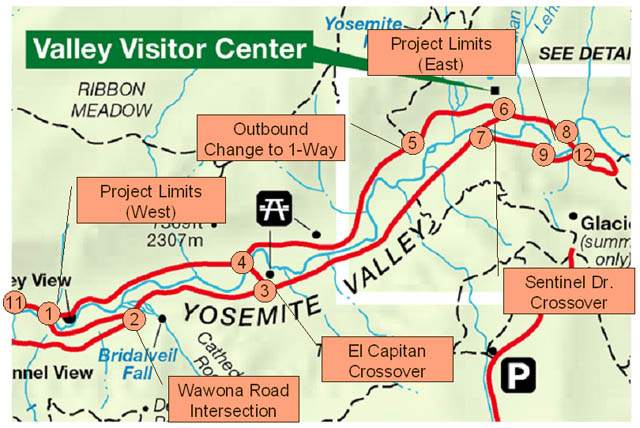
Figure 4.1.1 Yosemite Case Study Area
These two key valley roadways are scheduled for a significant repaving and rehabilitation project starting in 2006–2008. The Central Federal Lands Highway Division (CFLHD) of the FHWA is responsible for the planning, design and construction phases of the project, working in conjunction with the National Park Service to minimize impact on park visitors and the environment while cost-effectively conducting the needed roadwork.
Concern regarding significant delays in the construction phase led CFLHD staff and NPS personnel to consider a range of phasing and staging alternatives. This concern is nontrivial given current (no roadwork) traffic conditions, where weekend congestion and delays are already a recurring event during peak travel months.
One alternative considered was an alternating full closure plan where work on Southside Drive could be conducted quickly while all inbound/outbound traffic would be directed onto Northside Drive (temporarily configured to support 2-way traffic). In a second phase, Northside Drive would be closed and all traffic diverted onto Southside Drive. The advantage of this alternative was that the project could be completed faster (one season) and more efficiently at a lower cost. The disadvantage of such an approach was that capacity reductions from the roadwork had to be in place around the clock, and could not be timed to avoid weekly and daily peaks in travel demand.
A second alternative was to pursue project planning under a more traditional approach where one lane of each facility would be repaved while the other remained open to traffic. This approach would allow for work to be suspended during peak demand hours but would be less efficient to conduct, lengthening the project duration to two seasons and incurring additional costs.
The original role of QuickZone in the Yosemite project was to identify the likely travel delays expected under the two alternatives, allowing CFLHD and NPS staff to make an informed choice between the two, trading off road user delay against project cost. As the case study progressed, however, QuickZone became integral in the incremental refinement of a phasing and staging plan combining advantageous aspects of both alternatives.
4.1.2 Network Design
Network design for each alternative was different given the significant changes in geometry and traffic flow associated with the full closure components of the single-season alternative. The first alternative was coded using two networks (Figure 2). In the first phase, links representing Southside Drive are removed from the network and new links representing inbound operations on Northside Drive are added. The reverse is true for phase 2, where links representing Northside Drive are removed from the network and new links added to Southside Drive for outbound operations. These networks were run as separate files in QuickZone and results are combined external to the model. The second alternative was coded using a single network for all project phases.
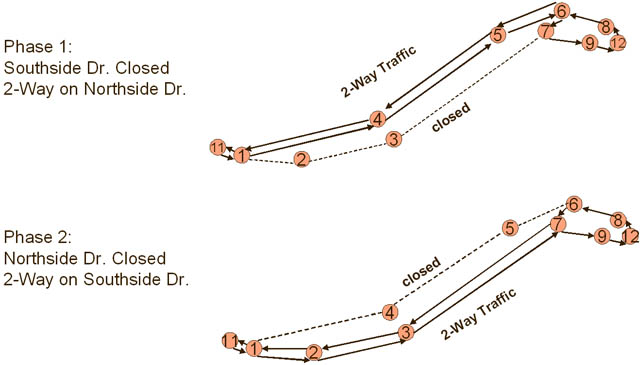
Figure 4.1.2 Yosemite QuickZone Network
Travel demand data were assembled from a number of sources and then refined through two short-term data collection activities. A first-cut distribution of hourly and daily travel demand factors were obtained from a 1998 traffic study. Monthly variations in travel demand were obtained from park entrance station data. Finally, two-short term (one two-week collection activity in June 2004 and one one-week collection activity in August 2004) were conducted to refine hourly and daily distributions and to establish a rate of travel demand growth from 1998–2004. Given that recurrent weekend congestion had worsened over the period, data were collected to identify when and by how much visitors had shifted departure or arrival times to avoid congested periods since 1998 (Figure 3). The supplementary data collection effort in 2004 was conducted using NuMetrics Hi-Star portable traffic counters, a commonly utilized technology within CFLHD.
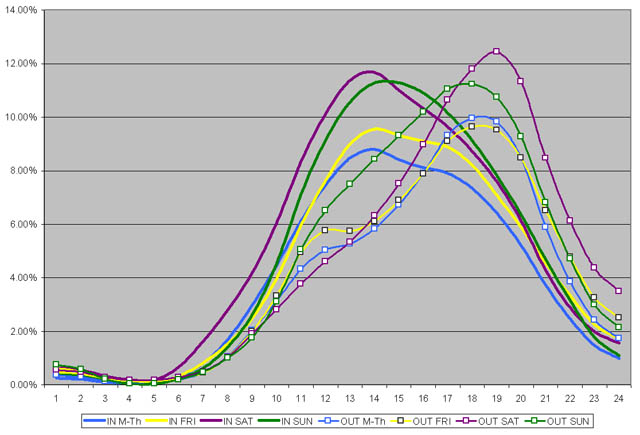
Figure 4.1.3 2004 Hourly Demand Pattern By Day of Week (from HI-STAR)
Traffic control operations modeled in QuickZone 1.0 included lane closures, flagger operations, and full closures. Capacity of flagger operations were estimated externally to the model and then input for affected links. The Yosemite case study was also used to test QuickZone Version 2.0, where the capacities of flagger operations are internally calculated.
4.1.3 Results
The single-season alternative, although cost-saving and shorter in total duration, was predicted to generate long and unacceptable delays for park visitors, particularly on weekend afternoons during summer months. The two-season alternative, when no-work hours had been refined by additional QuickZone analysis, produced no more than 10 minutes of additional visitor delay. The differential in road user delay between the single-season and two-season alternative was too large to justify the reduced cost of the single-season alternative.
In discussing the results, however, it became clear that the full-closure elements of the single-season alternative could be viable if the delay during the peak months of July, August and September could be avoided. In response, CFLHD staff developed a hybrid third alternative plan that combined full closure activity during relatively low-demand months (March–June, October–November), and traditional one-lane paving operations in the peak summer months.
This third alternative plan had the advantage of recouping most of the cost savings of the single-season approach with significantly lower travel delays. Delay was not eliminated, however. In June, outbound delays were predicted to approach 30 minutes for outbound traffic on Sunday afternoons. Likewise, in October, inbound delays on weekends could approach 60 minutes.
No final decision about the timing or phasing of the work has been made at this time (August 2004), since the project is still in development. However, the time and effort invested in data collection and QuickZone analysis have already had a marked impact in helping to shape the planned work to minimize impacts to park visitors while finding effective ways to reduce project duration and costs. CFLHD staff plan to continue utilizing the QuickZone model for the Yosemite case study throughout the project life cycle, including the actual construction phase.
4.1.4 Contact Information
Heidi Hirsbrunner
Highway Design Manager
Central Federal Lands Highway Division
12300 West Dakota Avenue
Lakewood, CO 80228
Heidi.Hirsbrunner@fhwa.dot.gov
303-716-2270
Patrick Flynn
Project Manager
Central Federal Lands Highway Division
12300 West Dakota Avenue
Lakewood, CO 80228
Patrick.Flynn@fhwa.dot.gov
303-716-2091
Heather Woll
Technology Development Engineer
Central Federal Lands Highway Division
12300 West Dakota Avenue
Lakewood, CO 80228
Jheather.Woll@fhwa.dot.gov
720-963-376
4.2 Zion National Park
 Key Observations
- QuickZone can analyze queuing on roadways that include entrances booths/stations.
- The results of the QuickZone analysis provided quantitative estimates of impacts to both the park (reduction in entrance fees) and visitors (increase in delay).
- The results of the analysis motivated project staff to seek alternatives to the original traffic control plan.
4.2.1 Overview
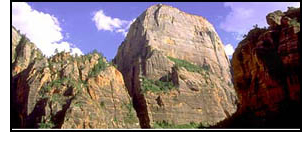
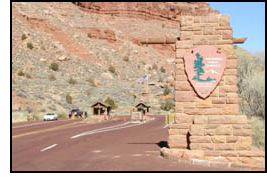
Designated a National Park in 1919, Zion National Park is Utah's oldest national park. Zion canyon features soaring towers and monoliths that suggest a quiet grandeur. Zion is also known for its incredible slot canyons, including "The Narrows," which attract hikers from around the world. With nearly three million visitors per year, Zion is Utah's most popular National park. Entrance fees are $20 per vehicle and $10 per person arriving on foot.
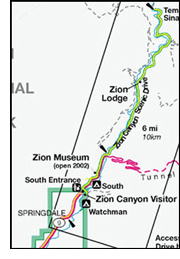
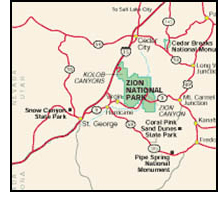 There are two major entrances two Zion National Park, a south and an east entrance. A third entrance, located on the west side of the park, provides access only to Zion's Kolob Canyon. The South Entrance is the larger and most frequently-used of the three entrances. The South Entrance is on Utah Route 9 about 60 miles south from Cedar City, via I-15 and Utah Route 17. The East Entrance is on Utah Route 9, 12 miles east of Mt. Carmel Junction, at U.S. Route 89. The park contains over 12 miles of road. To ease traffic congestion within the park, a shuttle system is available to take visitors to the most popular areas. A shuttle bus service is also available from the town of Springdale, just outside of the park. Shuttles operate from April through October; during that period private automobiles are not allowed on the 6.5 mile stretch of road in Zion Canyon. The shuttles provide the only access to marquee attractions like the Great White Throne, the Watchman, the Grotto, Angels Landing, Weeping Rock and the Temple of Sinawava. Automobiles are allowed on other park roads, including all of Hwy 9, which provides access to the lower part of the park, the Tunnel and the East Entrance/Checkerboard Mesa area.
Currently, approximately 90% of park visitors utilize the south visitors entrance. The entrance includes 2 visitor lanes and 1 employee lane, controlled by an radio-frequency tag system. Employees are able to process approximately 240 visitor vehicles an hour of which 50% are cash transactions, 40% credit card and 10% National Park Pass. 75% of the vehicles entering the park are passenger cars/trucks and 25% are RVs. During the peak season, recurring queue can extend as much as ¼ mile from the entrance.
In 2004, a major rehabilitation of the main road through Zion, beginning at the south visitors entrance and extending into Zion Canyon was scheduled to take place. This includes widening and structural repairs of certain sections of the existing road and milling/paving of the entire 7 mile stretch. A major concern of the National Park Service was the impact to visitors coming to Zion National Park through the town of Springdale. Traffic congestion on roads inside the park was not a concern since visitors are required to use the free shuttle bus service.
 Significant queuing and delay at the south visitors entrance, where recurrent queues were already present, was of major concern to park administrators. The original work zone plan called for shutting down one visitor entrance lane at a time for construction. The National Park Service did not want construction to cause a queue to form that extended into the town of Springdale, approximately 1/2 mile from the south visitors entrance. A queue of this length would not only impact traffic in the town, but employees getting to the park and the operation of the shuttle bus service from the town to the park. QuickZone was primarily used to estimate the length of queue and number of vehicles in queue if one of the two visitor entrance lanes were to be closed for construction. This was conducted for the peak tourist months of June, July, August, September and October.
4.2.2 Network Design
The Zion National Park QuickZone network is simple in design and includes 4 nodes and 6 links. Only the south visitors entrance was modeled since there was no concern about queuing or delay along the seven mile stretch of road within the park. The network is shown in figure 4.2.1 below. The work zone link (the middle of the three links) is the visitors entrance area which consists of four lanes: one exit lane, two visitor entrance lanes and one employee entrance lane. The far left line is Utah Route 9 which terminates at the town of Springdale. The far right line is inside the park. Queues will form to the left of the work zone link as the capacity is reduced due to construction.
The network was created using the QuickZone Network Editor and a paper map. The capacity of the south visitors entrance (or the number of vehicles that can be processed in an hour) was calculated using average transaction time per vehicle and a breakdown of average transaction types per day. It was also calibrated against historical queuing data to arrive at an overall facility capacity. Hourly counts were generated from a simple traffic study conducted in April for an average day both during the week and on the weekend. Seasonality was taken into account by using April as a baseline point and scaling up demand based upon historical knowledge for the months of June, July, August, September and October.
Construction at the south visitors entrance was just one component of the overall construction project and was estimated to take between two to three weeks. QuickZone was being used to estimate the impact if construction were to occur during the months of June, July, August, September or October and to determine which month would cause the least amount of impact. To conduct this type of analysis, the QuickZone network was setup to analyze the months of June, July, August, September and October separately. This resulted in five individual work zone plans with the only difference being the start and end date.
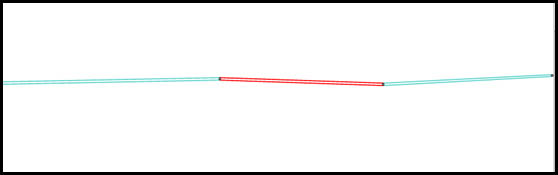
Figure 4.2.1 Zion National Park QuickZone Network
4.2.3 Results
 The roadway construction at Zion National Park was planned to only occur Monday through Friday and during daylight hours. This was done to avoid impacting the larger crowds visiting on the weekends and disturbing those visitors camping during the evening and overnight hours. As a result, the QuickZone analysis focused upon the weekdays. Baseline queuing was calibrated against actual demand seen in the field during the month of April. Once the calibration was complete, the QuickZone model was run where capacity of the south visitors entrance was reduced by 50%.
The results of the QuickZone analysis indicate that the queue will impact the town of Springdale in each of the five months analyzed:
- June: .58 mile queue, 463 vehicles in queue
- July: .66 mile queue, 513 vehicles in queue
- August: .66 mile queue, 513 vehicles in queue
- September: .58 mile queue, 461 vehicles in queue
- October: .45 mile queue, 361 vehicles in queue
The order of magnitude for delay was around 300 minutes or 5 hours with the queue beginning to form around 9 AM, peaking at 3 PM and dissipating by 9 PM. Clearly, people will not wait 5 hours to get into the park. The key data point for this analysis was the estimated number of vehicles in queue and whether that queue will impact the town of Springdale.
Results of the Zion QuickZone analysis have given CFLHD engineers the necessary data to reevaluate the construction phasing. After seeing the results in QuickZone, CFLHD engineers knew that the current construction phasing could not take place as originally designed and began to brainstorm on various alternatives including opening up temporary entrance booths and shifting construction to the early evening hours to not coincide with the peak demand. Currently, CFLHD engineers are continuing to discuss possible alternate construction phasing with park rangers. As these new ideas are developed, CFLHD engineers will analyze them in QuickZone to determine which will have the least impact on park visitors and employees.
4.2.4 Contact Information
Michael Smith
Transportation Engineer
Central Federal Lands-Highway Division
12300 West Dakota Avenue
Lakewood, CO 80228
720-963-3627
MichaelD.Smith@fhwa.dot.gov
Heather Woll
Technology Development Engineer
Central Federal Lands Highway Division
12300 West Dakota Avenue
Lakewood, CO 80228
Jheather.Woll@fhwa.dot.gov
720-963-376