2. BACKGROUND AND DESCRIPTION OF THE WORK ZONE PERFORMANCE MEASURE PILOT TEST
BACKGROUND
In a recent study (4), several state DOTs were queried as to their efforts and interest in work zone safety and mobility performance measures. In general terms, many states compute delay, queuing, and road user costs at some level as part of their work zone planning and design procedures. These are accomplished via simple traffic volume-to-work zone capacity comparisons or application of macroscopic or microscopic traffic simulation analyses. States may use some of these measures or values in establishing incentives and disincentives for contracting purposes. Meanwhile, efforts to actually measure traffic and safety impacts during work zones are extremely limited. A few states did indicate that they monitor work zones in the field to make sure a performance threshold (such as a maximum queue length or maximum delay time) is not exceeded at a project. If conditions do get worse than expected, the agency may terminate the work activity (typically a lane closure) to allow traffic congestion to disperse or assess penalties, although it is also possible that the field crews may not do anything and allow conditions to continue. Traditionally, though, the conditions that lead to these actions and the performance measure values often do not get documented anywhere other than in the daily project diary, and are simply used in follow-up negotiations between the agency and the contractor regarding project payments, time charged, or other features.
Two states (Indiana and Michigan) have recently initiated the reporting of queues back to district or headquarter offices in their agency on a more formal basis (5, 6). The intent of this reporting is to determine why the queues occurred, since both agencies conduct traffic analyses during project design to avoid generating queues. The ultimate goal is to refine and improve the inputs and assumptions being used in the analysis tools, such as the work zone capacity assumed or the expected hourly demand volumes to the work zone. However, some basic metrics may be generated by the agencies for tracking purposes, such as the percent of work zones each year that meet the delay expectations for that particular project. Both agencies noted the challenges that exist in attempting to monitor and analyze queues occurring in urban work zones due to the interdependence between the queues that develop and the diversion to other routes that then occurs.
The Missouri DOT (MoDOT) conducts regular reviews of its work zones statewide and compares the traffic conditions existing at those work zones with their expectations from traffic analyses made earlier in the work zone planning and design process (7). Figure 1 shows an example of this performance measure. These observations are qualitative rather than quantitative in nature. Consequently, the relationship between “meeting expectations” and amount and duration of delay and congestion that occur is not immediately apparent. However, this approach does address a key concern heard from field personnel that performance measures need to be tied to what is considered acceptable (or the “target”) for that particular work zone or category of work zones, and not considered independently from the other decisions that go into the successful completion of a particular project. Other mobility/operational measures sometimes considered by state DOTs include vehicle delays measured as part of the inspector drive-through of the project, and user complaints (8).
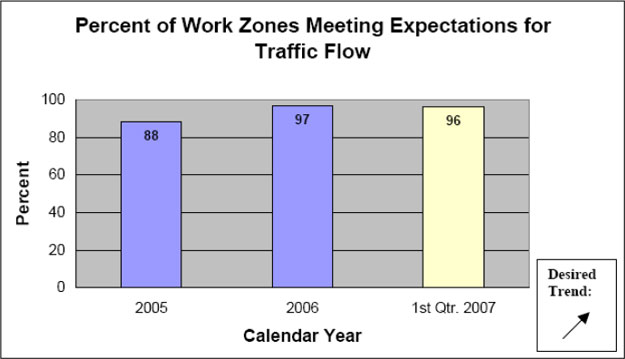
Figure 1. Traffic Mobility Performance Measure Used by Missouri DOT (7).
With regard to work zone safety performance monitoring, many states do monitor the number of fatalities that occur in their work zones annually. Unfortunately, agencies acknowledge that without exposure data (e.g., number of work zone hours or work periods, or the traffic volumes traveling through the work zones) to normalize these numbers, changes in crash frequencies from year to year are difficult to interpret. In addition, the relatively small numbers of work zone fatalities that occur in most states often do not yield meaningful insights into problems or possible corrective actions that should be taken (some states do enlarge the database considered by including injury crashes in the analysis). Also, most crash databases do not include much information concerning the work zone characteristics at the time of the crash (e.g., the type of temporary traffic control [TTC] in place, the proximity of workers and equipment to traffic), which limits what can be extracted from the data.
Even if an adequate data sample is available for work zone safety performance monitoring, another key concern that plagues most agencies is the time lag that typically exists in obtaining crash data from individual projects. Interestingly, the Ohio DOT (ODOT) manually collects police accident reports every two weeks from high-profile projects in its jurisdiction and compares to crashes during construction to the three-year average existing before the project began (9). ODOT personnel scrutinize those segments where the current work zone crash rate is much higher than the three-year average, believing the higher crash rate is an indicator of potential traffic management and control concerns. Figure 2 illustrates an example of the work zone crash monitoring activities by ODOT.
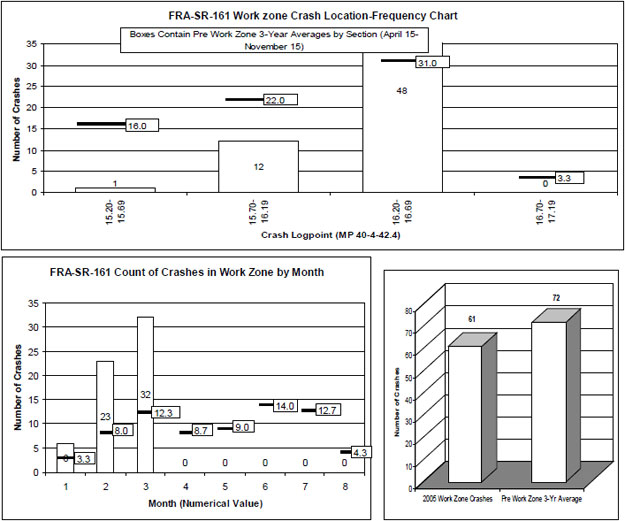
Figure 2 . Ohio DOT Work Zone Safety Performance Measures (recreated from 9).
A number of researchers have examined work zone crashes in traditional before-during or work zone versus no-work zone analyses in recent years, attempting to identify and quantify the factors that contribute to crashes and/or to evaluate countermeasures to reduce crash risk (e.g., 10, 11, 12). Generally speaking, these studies utilize data from multiple work zones in a region or state, and may even include data from multiple states. These types of analyses are fairly complex and not typically attempted by state DOT personnel; rather, universities or consultants are contracted to perform the study. These studies generally suffer from delays in obtaining access to the crash data, although some states have implemented electronic crash report data entry systems which can significantly reduce this delay time. Even if crash data access concerns can be overcome, the design features, operating strategies, and management techniques utilized during each work zone project of interest must be manually extracted from project files, inspector diaries, or other data sources and combined with the crash data before analyses can be performed. This process itself can be extremely time-consuming, and the various combinations of these features/strategies/techniques possible make it difficult to establish a uniform dataset with enough projects to allow meaningful conclusions to be drawn. Given the challenges associated with the use of crash data for performance measurement, some agencies rely on surrogate measures such as TTC quality inspection scores, average speeds or speed variance at a project, or frequency of fire department responder calls (8).
DESCRIPTION OF THE WORK ZONE PERFORMANCE MEASURE PILOT TEST
For this pilot test, a set of desirable work zone safety and mobility-related performance measures was first identified. Those measures pertaining to work zone exposure and mobility were then targeted to be computed for each of five work zone projects nationally. Safety performance measures were not computed in this pilot test effort for two main reasons. First, many state DOTs report very lengthy lag times (several months, or even years in some cases) between when crashes occur and when a data set of information about the crashes can be obtained by the agency for analysis purposes. Waiting for such data from every project was not judged to be a worthwhile use of time for this pilot test. The second, and perhaps more important, reason for not including work zone safety performance measures in the test is that such measures are already fairly well-defined and understood by practitioners. Although it may be challenging for some agencies to obtain the data and to find the time to compute crash rates and other work zone safety performance measures, the measures once computed are recognized as useful. In contrast, it is less clear what types of exposure and mobility-related work zone performance measures can be computed with data sources that are typically available to agencies, and how best to interpret those measures once they are computed.
Consequently, the goals of the pilot test project were to identify and compute various types of work zone exposure and mobility-related performance measures, and to do this with different data collection methodologies that could be used for work zone mobility performance measurement. Specifically, the pilot test targeted a proposed manual method of data collection that relies on field crew personnel to document queues that develop during work activities, and the use of electronic traffic surveillance technology that may be available at certain work zone projects. Within the electronic category are project locations where transportation management centers (TMCs) already in place have point measurement devices (traffic sensors) that can measure traffic volumes, speeds, and detector occupancy values; locations where a portable work zone intelligent transportation system (ITS) has been deployed for incident detection and response, driver advisories, or other purposes; and point-to-point travel time measurement technologies that are becoming more and more affordable and prevalent. Given that neither type of data has been sufficiently evaluated as a potential source for work zone performance measurement data, the pilot tests were designed to have both types of data available at the same time so that direct comparisons of the measures estimated from each could be made. Ground-truth data collection by research staff was also obtained to assess how well each data source can represent actual conditions at a particular work zone.
These alternative methods of obtaining and computing the mobility-related performance measures were tested at the following five work zone project locations across the country:
- I-95, Lumberton, North Carolina
- I-95, Philadelphia, Pennsylvania
- I-405, Seattle, Washington
- I-15/US95 Design-Build Project, Las Vegas, Nevada
- I-15 Express Lane Project, Las Vegas, Nevada
This report describes the results of those pilot test efforts, and highlights the lessons learned and factors to consider when developing these types of work zone performance measures.
previous | next