CA4PRS Use in Washington State
slide 1
CA4PRS Use in Washington State
by
Jeff Uhlmeyer, State Pavement Engineer
View the PDF
Version [708 KB]
![]() You will need the Adobe
Reader to view the PDFs on this page.
You will need the Adobe
Reader to view the PDFs on this page.
slide 2
WSDOT Efforts to Mitigate Construction Impacts:
- Alternative contracting
- Rapid construction strategies
- Alternative closure windows
- Specialized materials
- Training and education
slide 3
CA4PRS: A tool for estimating contractor productivity
- Estimates contractor productivity given:
- Traffic closure window
- Lane availability and use for construction
- Construction materials
- Pavement structure
- Scheduling constraints
- Resource constraints
slide 4
slide 5
| Construction Window: | Weekend Closure (55 hours/weekend) |
|---|---|
| Working Method: | Sequential Single Lane (T2) |
| Section Profile: | PCCP: 13.0 inches, New Base: 0.0 inches |
| Curing Time: | 8 hours |
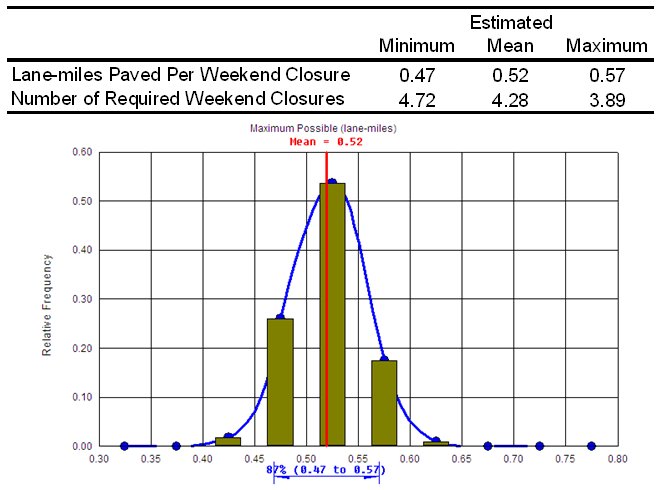
| Objective (lane-miles): | 2.22 |
| Maximum Possible (lane-miles) | 0.57 |
| Maximum Possible (c/l-miles) | 0.57 |
| Construction Windows Needed to Meet Objective: | 3.90 |
| Resource | Allocated | Utilized |
|---|---|---|
| Demolition Hauling Truck (per hour per team) | 6.0 | 6.0 |
| Base Delivery Truck (per hour) | 8.0 | 0.0 |
| Batch Plant (cu-yd/hour) | 200.0 | 77.1 |
| Concrete Delivery Truck (per hour) | 12.5 | 10.3 |
slide 6
CA4PRS productivity estimates can assist:
- Evaluating different closure scenarios
- Selecting most appropriate closure strategy
- Identifying equipment and material requirements
- Identifying ranges of potential contractor productivity
- Verifying contractor productivity estimates
slide 7
CA4PRS and WSDOT
- Is CA4PRS appropriate for projects in Washington State?
- At what level of project planning is CA4PRS applicable?
- How should WSDOT use CA4PRS?
slide 8
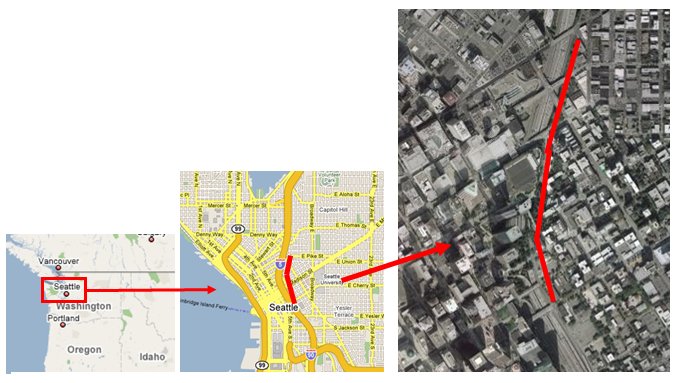
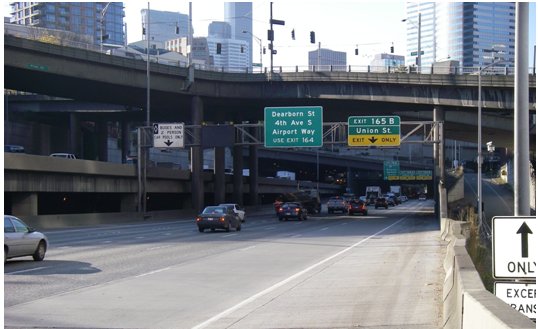
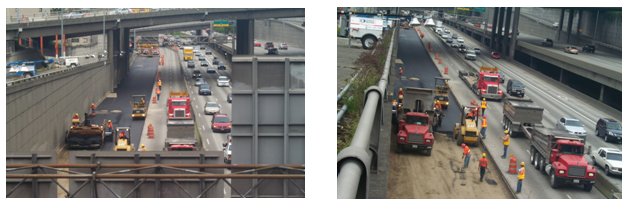
I-5 Olive to James Rehabilitation
- Reconstructed outside lanes, drop lanes and ramp segments
- Removed of 6,500 yd3 of material
- Placed of 2,500 tons of HMA base and 5,640 yd3 concrete pavement
- Four 55-hour weekend closures
slide 9
Project Location
slide 10
slide 11
Paving Quantities and Stage Paving Lengths (lane-miles)
| Stage | Fixed Form Paving |
Slipform Paving (yd3) |
Total Paving Quantity (yd3) |
Stage Psuedo Length (lane-miles) |
|---|---|---|---|---|
| Stage 1 | 776 | 1100 | 1876 | 0.74 |
| Stage 2 | 572 | 995 | 1567 | 0.62 |
| Stage 3 | 488 | 808 | 1296 | 0.51 |
| Stage 4 | 364 | 540 | 904 | 0.36 |
| Total Paving Quantity: 2.22 (yd3) |
||||
slide 12
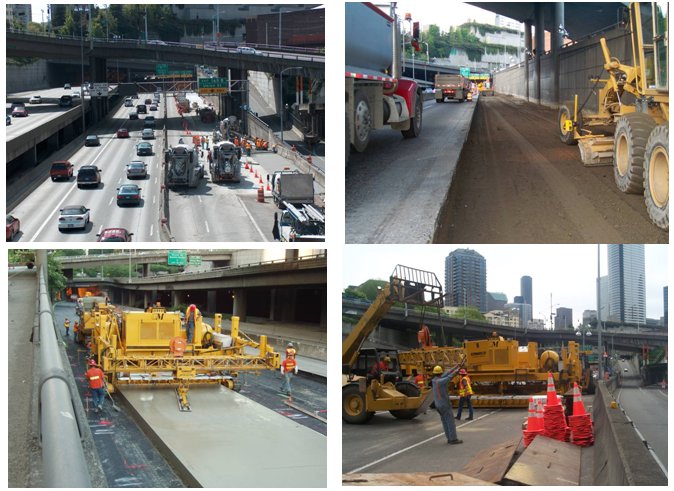
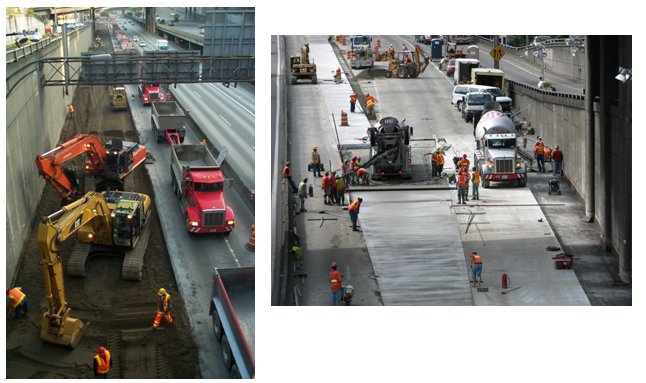
Construction Sequence
- Establish traffic control and installation of construction barrier
- Demolish and remove existing pavement
- Subgrade repair
slide 13
Construction Sequence
- HMA base paving
- PCC paving
- PCC curing, sawcutting and pavement marking
- Removal of equipment and traffic control
slide 14
Job Specific Constraints
- Narrow work zone
- Slipform paving machine constraints
slide 15
Job Specific Constraints
- Paving lane access
- Adjacent commercial development
- Site access
slide 16
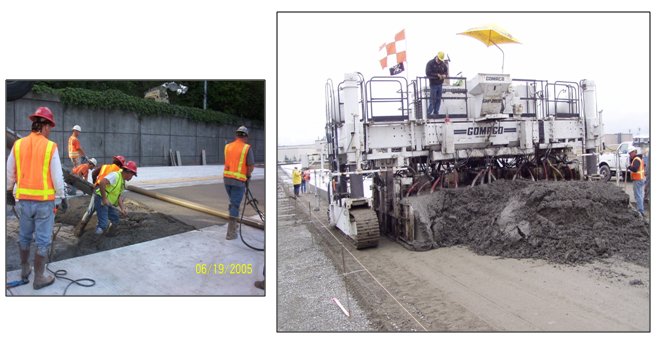
Construction Process
slide 17
Job Specific Constraints
slide 18
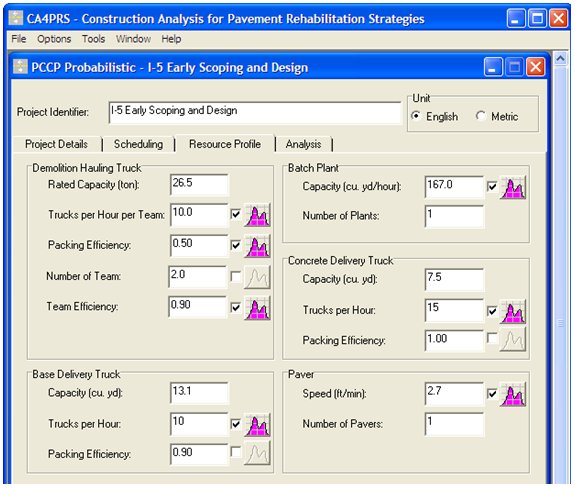
1st Analysis: CA4PRS Applicability For Early Scoping and Design Evaluation
- Sufficient project information available for CA4PRS estimate development
- Input parameters established from similar and previously completed projects
- Slipform and fixed form operations combined into a pseudo paving speed of 2.67 ft/min
slide 19
1st Analysis: CA4PRS Applicability For Early Scoping and Design Evaluation
slide 20
slide 21
2nd Analysis: CA4PRS Applicability For Post-Award Pre-Construction Evaluation
- Contractor schedules used to refine:
- Construction sequencing
- Activity lag times
- Mobilization and demobilization times
slide 22
slide 23
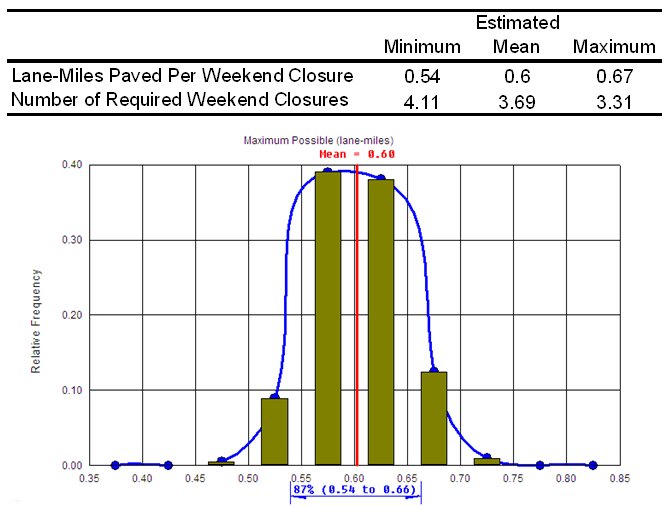
CA4PRS Guidelines
- Base decisions on probabilistic outputs
- Maintain a database of construction productivity
- Assign triangular distributions to probabilistic inputs if distribution data is unavailable
- Round estimated construction windows up to nearest whole number
slide 24
Evaluation Conclusions
- CA4PRS can be used during early scoping and design as well as post-award pre-construction verification
- Produce estimates from probabilistic analysis
- CA4PRS estimates are reasonably accurate with generic input parameters
slide 25
Evaluation Conclusions
- Input parameter selection determines estimate accuracy
- Input parameter variation may not encompass productivity for constrained projects
- CA4PRS requires further refinement to make it more generic and flexible
slide 26
CA4PRS at UW
- The University of Washington graduates 120 civil engineers each year to meet regional demand
- CEE 404 Infrastructure Construction
- Transportation project development and construction
- CA4PRS combines real-world information with project planning
slide 27
CA4PRS Analysis
I-5 Bow Hill,
Crack and Seat Overlay
slide 28
Project Parameters
- Crack and Seat and Overlay two NB lanes of I-5 between MP 231.8 to MP 243.33 (south of Bellingham, WA)
- 20 lane-miles
- Classified as a rural freeway with a 23,000 ADT and 9% trucks
- Two 12-ft lanes with a 4 feet inside and a 10 feet outside shoulders
- Constructed in 1966 using 9 inches of JPCP
- Rehabilitated in 1993 with a 4 inch HMA overlay and sub-sealing due to considerable faulting
slide 29
Construction Process
- Expose PCCP pavement by milling the 4 inch overlay Shoulders remain as is, no milling
- Divert traffic on SB I-5 lanes using counter-flow traffic operations
- Overlay the crack and seat slabs with 8 inches of HMA pavement in three lifts: 4 inch initial lift followed by two additional 2 inch lifts
slide 30
Construction Scenarios
- Baseline. All operations (milling, crack and seat and the full 8 inch overlay paving) are accomplished during each closure.
- Baseline but with 2 Milling teams and 2 paving teams. It is likely that 2 milling and paving teams (e.g., 2 milling machines and 2 paving machines) can operate in the project area.
- Just milling 4.2 inches of mainline pavement with 2 milling teams. An obvious breakpoint in the work would be after milling off all the HMA in the mainline.
- Just milling 4.2 inches of mainline pavement with 4 milling teams 50% efficiency. The lower efficiency is an attempt to account for the added complexity of operations with 4 milling teams.
- Crack and seat plus a 4.2 inch overlay to bring the mainline pavement height up to the existing shoulder height. This operation would follow the "just milling" one.
- Overlay the final 4.0 inches for the mainline and shoulders. This operation would follow the "crack and seat plus 4.2 inches overlay" one.
slide 31
| Input | Value | Distribution/Comments |
|---|---|---|
| Mobilization | 1.0 hour | None – Deterministic. Set traffic control, mobilize equipment. |
| Demobilization | 2.0 hours | None – Deterministic. |
| Half Closure Traffic Switch | 0.5 hours | Triangular (min = 0.25 hrs, max = 0.75 hrs). Time to switch traffic if only closing 1 lane in NB direction. |
slide 32
| Input | Value | Distribution/Comments |
|---|---|---|
| Milling and Hauling | ||
| Number of Team | 1 team | None – Deterministic. |
| Team Efficiency | 0.8 | Triangular (min = 0.7, max = 0.9) |
| Milling Machine | ||
| Machine Class | Large | Choices are large, medium, small |
| Material Type | AC – Hard | Good choice for hard rock in western WA |
| Efficiency Factor | 0.7 | Triangular (min = 0.6, max = 0.8) Tooth replacement may affect downtime. |
| Hauling Truck | ||
| Rated Capacity | 18.0 tons | None – Deterministic. |
| Trucks/hr/team | 13/hr | Triangular (min = 11/hr, max = 15/hr) |
| Packing Efficiency | 1 | None – Deterministic. |
slide 33
| Input | Value | Distribution/Comments |
|---|---|---|
| Batch Plant | ||
| Capacity | 350 t/hr | Triangular (min = 300 t/hr, max = 400 t/hr) |
| Number of Plants | None – Deterministic. | |
| HMA Delivery Truck | ||
| Capacity | 16 tons | None – Deterministic. |
| Trucks per Hour | Triangular (min = 11/hr, max = 15/hr) | |
| Packing Efficiency | None – Deterministic. | |
| Paver | None | N/A (no base material) |
| Non-paving speed | 15 mph | |
slide 34
| Input | Value | Distribution/Comments |
|---|---|---|
| Construction Window | weekend nighttime continuous |
55-hour weekend closures 10-hour nighttime closures 168-hour continuous week-long closures |
| Section Profile | 2-2-4 | Bottom lift: 4 inches (0.33 mph for paver) |
| Change in Roadway Elevation | +4 inches |
The new roadway will be 4 inches higher than the old after milling and overlaying. |
slide 35
| Input | Value | Distribution/Comments |
|---|---|---|
| Shoulder Overlay | Simultaneous | Shoulders already contain 4.2 inches of HMA. They will be overlayed with
an additional 4 inches of HMA. |
| Working Method |
Full closure | Only allowed option in CA4PRS. |
| Cooling Time Analysis |
User Spec. |
Time calculated in MultiCool and manually entered |
| Lane Widths | ||
| No. of Lanes | 2 | |
| Lane Widths |
12 ft each | Travelled lanes only |
slide 36
| Input | Value |
|---|---|
| Start Time | 1000, 7/15/2011 |
| Environmental Conditions | |
| Ambient Air Temp. | 60°F |
| Average Wind Speed | 5 mph |
| Sky Conditions | Clear&Dry |
| Latitude | 44° North |
| Existing Surface | |
| Material Type | PCC |
| Moisture Content | N/A |
| State of Moisture | N/A |
| Surface Temp. | 55°F |
slide 37
| Input | Value |
|---|---|
| Mix Specifications | |
| Mix Type | Dense Graded |
| PG Grade | 70-22 |
| Delivery Temp. | 300°F |
| Stop Temp. | 130°F |
| Lift Thicknesses | |
| 1st 4 inches of HMA | Paved as one 4-inch lift |
| 2nd 4 inches of HMA | Paved as two 2-inch lifts |
slide 38
| Scenario | Closure Production | Construction Windows | Total Working Hours |
|---|---|---|---|
| 14-hour nighttime closures | Not possible | N/A | N/A |
| 55-hour weekend closures | 1.01 lane-miles | 19.71 | 1084.3 hrs |
| Continuous closure | 38 days to pave 20 lane-miles | 38 days to pave 20 lane-miles | 905.4 hrs |
| Constraints: Milling Machines, HMA trucks | |||
slide 39
| Scenario | Closure Production | Construction Windows | Total Working Hours |
|---|---|---|---|
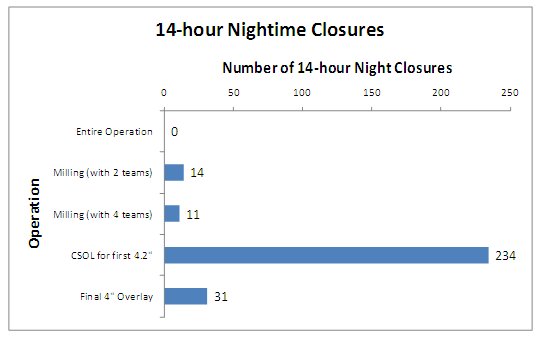
| 14-hour nighttime closures | Not possible | N/A | N/A |
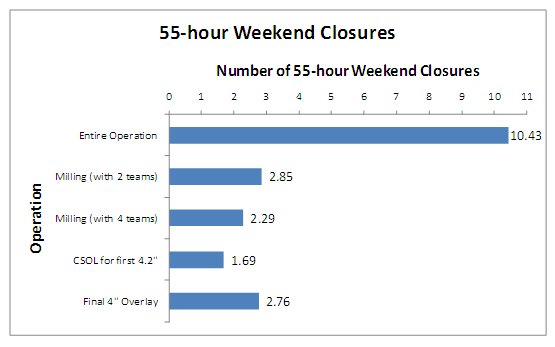
| 55-hour weekend closures | 1.92 lane-miles | 10.43 | 573.7 hrs |
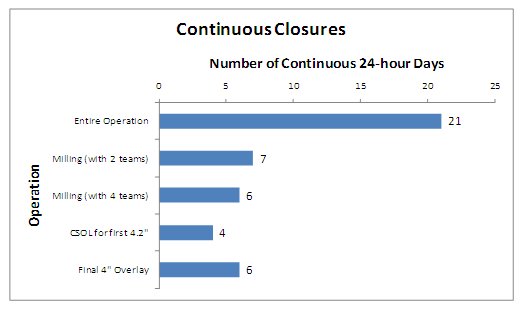
| Continuous closure | 21 days to pave 20 lane-miles | 21 days to pave 20 lane-miles | 498.3 hrs |
| Constraints: HMA batch plant, Milling machine | |||
slide 40
| Scenario | Closure Production | Construction Windows | Total Working Hours |
|---|---|---|---|
| 14-hour nighttime closures | 1.47 lane-miles | 13.60 | 190.4 hrs |
| 55-hour weekend closures | 7.01 lane-miles | 2.85 | 156.9 hrs |
| Continuous closure | 7 days to mill 20 lane-miles | 7 days to mill 20 lane-miles | 498.3 hrs |
| Constraints: Milling machine | |||
slide 41
| Scenario | Closure Production | Construction Windows | Total Working Hours |
|---|---|---|---|
| 14-hour nighttime closures | 1.84 lane-miles | 10.89 | 52.5 hrs |
| 55-hour weekend closures | 8.75 lane-miles | 2.29 | 125.7 hrs |
| Continuous closure | 6 days to mill 20 lane-miles | 7 days to mill 20 lane-miles | 498.3 hrs |
| Constraints: Milling machine | |||
slide 42
| Scenario | Closure Production | Construction Windows | Total Working Hours |
|---|---|---|---|
| 14-hour nighttime closures | 0.09 lane-miles | 233.34 | 3266.7 hrs |
| 55-hour weekend closures | 11.82 lane-miles | 1.69 | 93.0 hrs |
| Continuous closure | 4 days to pave 20 lane-miles | 4 days to pave 20 lane-miles | 88.7 hrs |
| Constraints: Batch plant | |||
slide 43
| Scenario | Closure Production | Construction Windows | Total Working Hours |
|---|---|---|---|
| 14-hour nighttime closures | 0.65 lane-miles | 30.99 | 733.9 hrs |
| 55-hour weekend closures | 7.25 lane-miles | 2.76 | 151.7 hrs |
| Continuous closure | 6 days to pave 20 lane-miles | 6 days to pave 20 lane-miles | 157.2 hrs |
| Constraints: Batch plant | |||
slide 44
slide 45
slide 46
slide 47
Observations
- 10-hour nighttime closures were not considered. They are less productivity than 14-hour closures
- Milling may be possible during 14-hour nighttime closures. No other modeled operation seems feasible
- No probabilistic scenarios were run but it is reasonable to add the following uncertainties to the estimates:
- 14-hour nighttime closures: ±5 days
- 55-hour weekend closures: ±1 weekend
- Continuous closures: ±2 days
slide 48
Observations
- The best possible solution is likely a combination of closure scenarios
- Milling – performed over 14 nighttime (14 hour closures)
- CSOL and overlays (8 inch total) performed over five 55 hour closures
- No traffic analysis was done at this point. Results may become clearer with traffic numbers
slide 49
Contact Information
Jeff Uhlmeyer, State Pavement Engineer
Washington State Department of Transportation
360-709-5485
uhlmeyj@wsdot.wa.gov